Proceeding Paper

Evaluation of an On-Ground Regional Passenger Cabin Demonstrator †

1
Fraunhofer Institute for Building Physics IBP, 83626 Valley, Germany
2
Institute and Clinic for Occupational, Social and Environmental Medicine, LMU University Hospital, LMU Munich, 80336 Munich, Germany
3
Institut für Technische und Angewandte Physik GmbH, 26129 Oldenburg, Germany
4
Faculty of Industrial Design Engineering, Delft University of Technology, 2628 Delft, The Netherlands
5
School of Science and Technology, Department of Engineering, Nottingham Trent University, Nottingham NG11 8NS, UK
*
Author to whom correspondence should be addressed.
Presented at the 14th EASN International Conference on “Innovation in Aviation & Space towards sustainability today & tomorrow”, Thessaloniki, Greece, 8–11 October 2024.
Eng. Proc. 2025, 90(1), 100; https://doi.org/10.3390/engproc2025090100
Published: 18 April 2025

Abstract

:
The comparatively environmentally friendly turboprop aircraft should be used more often, but still need some improvements, especially regarding noise. To facilitate research into these improvements, an On-Ground Regional Passenger Cabin Demonstrator was built and validated through a comparison with passengers’ reactions to real turboprop flights. Seventy-three subjects answered questions on various environmental factors during a simulated flight in the Cabin Demonstrator. Subject testing revealed that the Cabin Demonstrator was overall perceived as realistic compared to real flights, and the comfort level was comparable to the previously conducted in-flight subject test. Thus, the Cabin Demonstrator can be used for multiple future tests.

1. Introduction

Turboprop aircraft are a useful alternative for short-haul flights to reduce CO2 emissions [1], but they have a higher noise and vibration level compared to turbojets [2,3]. Turboprop aircraft can be louder than turbojet aircraft by up to 30 decibels [2]. However, noise and vibration are important (dis)comfort factors in turboprop aircraft [4] and have negative impacts on well-being, health, performance, etc., for both passengers and cabin crew [5,6]. It could be assumed that the willingness to fly with a turboprop aircraft decreases if passengers perceive the aircraft as too loud and thus do not feel comfortable [7]. Therefore, it is necessary to improve turboprop aircraft.
To examine and improve the turboprop aircraft, an On-Ground Regional Passenger Cabin Demonstrator (Clean Sky 2 Joint Undertaking project, Leader LEONARDO) was built by our project partner LEONARDO and transferred to Fraunhofer Gesellschaft for passenger experience evaluation. Before investigations could be carried out in the Cabin Demonstrator, it had to be validated. Validation is the most important criterion to verify that the demonstrator produces the same results as a real turboprop aircraft [8]. To validate the Cabin Demonstrator, real flights and simulated flights in the demonstrator were performed, during which the test subjects evaluated various aspects of the “flights”. These evaluations were compared with each other. If the evaluations of the simulated flights are similar to those in the real ones, the demonstrator can be considered validated. The aim of the validated demonstrator (Figure 1) is to test new technologies more easily and quickly compared to complex and expensive real flights, e.g., for multiple tests like subject tests and comfort evaluation and tests of composite materials and structures, systems and energy consumption.

2. Materials and Methods

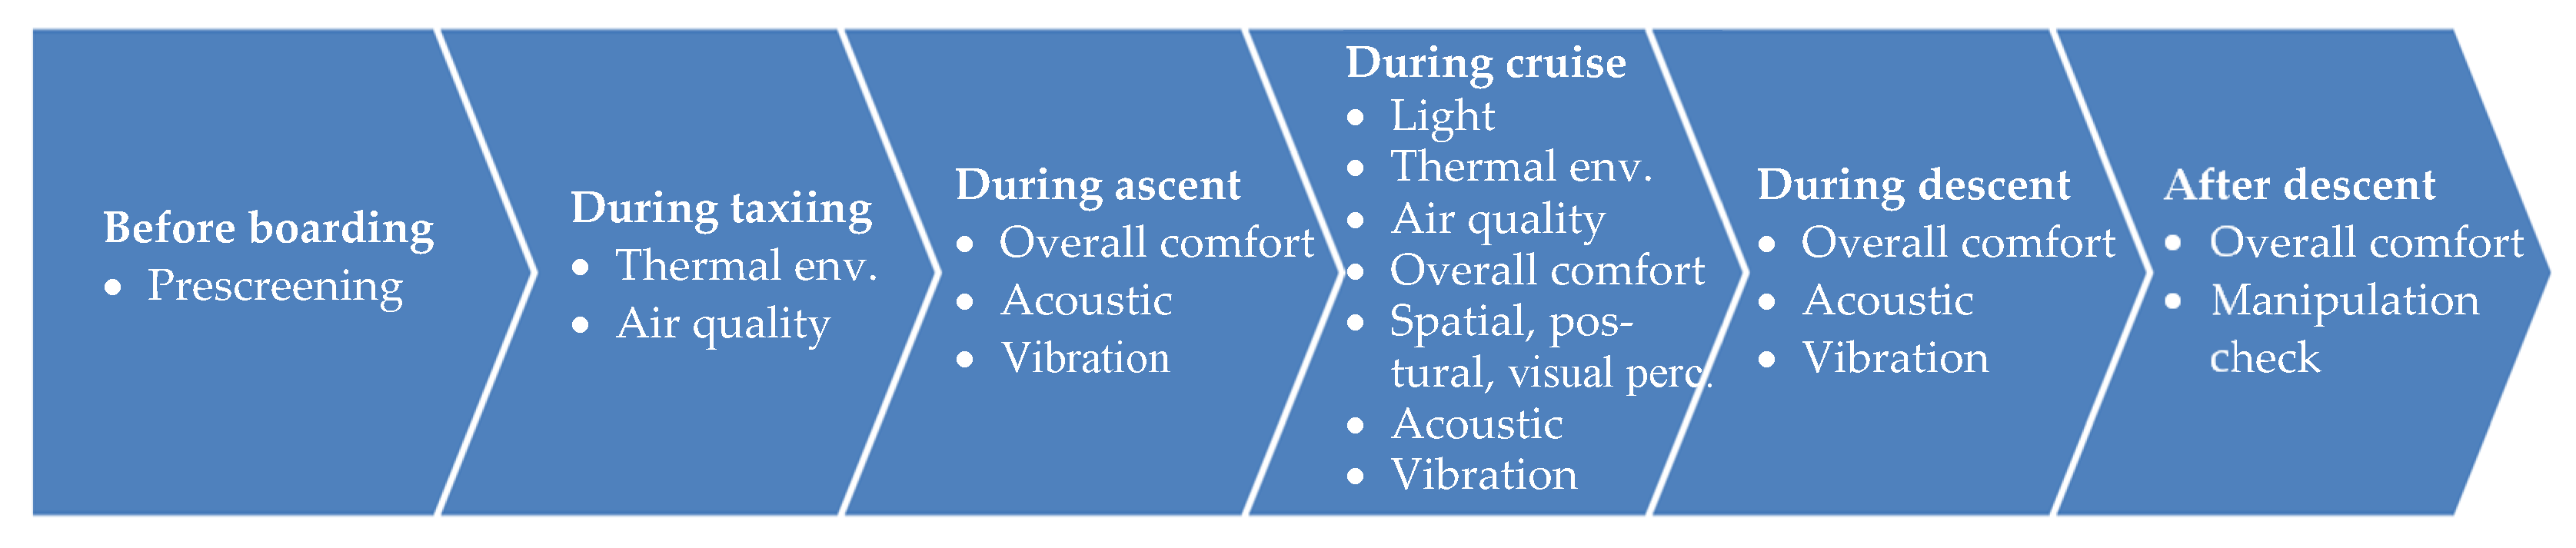
2.1. Design and Procedure

To test and validate the Cabin Demonstrator, two real flights were assessed as a baseline. The real flights were carried out as part of the ComfDemo (grant agreement no. 831992-ComfDemo-H2020-CS2-CFP08-2018-01) project. This project included, for example, the identification of relevant subject target groups, planning out the content and procedures for questionnaires and, finally, providing results from real flights. The two 70 min real flights took place in an ATR72-500 in autumn 2021. The departure and arrival location was The Hague Airport, Rotterdam, the Netherlands. Further information and results are described in detail elsewhere [9,10,11]. Three 70 min demonstrator flights took place in the On-Ground Regional Passenger Cabin Demonstrator at the Fraunhofer IBP in Holzkirchen, Germany, in spring 2024. The Cabin Demonstrator is a full-scale fuselage section of a newly designed regional aircraft, able to host 25 passengers and equipped with a galley and lavatory.
To simulate a turboprop aircraft, shakers were installed under the seats to generate vibrations. In addition, a subwoofer and Genelec loudspeakers were installed behind the last row and in the galley. These played the characteristic sound of a turboprop aircraft including various flight phases from taxiing to take-off, ascent, cruise, descent and landing.
The study was approved by the Fraunhofer ethics council. Furthermore, the subjects were briefed with study information and signed informed consent forms.

2.2. Measures

To measure various comfort factors, numerous questionnaires were previously screened and selected by the ComfDemo project. The following factors have been included in the demonstrator validation using the adapted versions of the Ideal Cabin Environment Questionnaire [12], the Occupant Indoor Environmental Quality Survey [13,14], ISO 28802 [15] and ISO 2631-1 [16]:
  • Acoustic environment;
  • Air quality;
  • Lighting environment;
  • Thermal environment;
  • Vibration;
  • Overall comfort and discomfort.
During ascent, the middle of the cruising phase and descent, subjects answered questions about comfort, discomfort, acceptability and pleasantness for each environmental factor. Moreover, loudness, preferred loudness and annoyance were assessed to evaluate the acoustic environment in detail, as well as overall vibration and vibrations in different body areas to evaluate vibration in detail.
In addition, postural sensations and spatial and visual perception were measured [17,18]. The flight in the Cabin Demonstrator was intended to replicate the same conditions as the real flight. Therefore, the same test sequence from the real flight was used, which represents the chronological sequence of the various and partly repetitive questions answered during the flight phases (Figure 2). During the flights, objective parameters were also measured, for example, indoor climate.

2.3. Participants

For the demonstrator sample, subjects with similar characteristics to the sample in the real flights were chosen, particularly regarding age, gender, height and weight. This similarity was intended to ensure that the assessment of comfort was not biased by demographic factors. To achieve these characteristics, test subjects were recruited via a casting agency. In addition to demographic requirements, the subjects had to have flown at least five times in their lives to have the necessary flying experience for comparisons. For safety reasons, participants with certain illnesses such as a nervous system disorder, musculoskeletal problems or claustrophobia were excluded.
To characterize the sample, questions regarding demographic variables such as age, gender, height and weight, as well as current health status [19] and flight-related questions (adapted from [20,21]), were asked.

3. Results

3.1. Sample Chararcteristics

Overall, 73 subjects completed the questionnaires in the Cabin Demonstrator. In group 1, two no shows occurred; hence, 23 people took part in this trial. In groups 2 and 3, the cabin was fully booked with 25 people each. The sample was composed as follows: 45 men and 27 women, mean age 33.55, age range from 18 to 63, mean weight of 74.3 kg and mean height of 178 cm. They had flown about five times on average in the last year and reported a positive flight experience and attitude. In total, 30.1% reported experience with a turboprop aircraft, 64.4% reported no experience and 5.5% did not know. No differences were found within the three groups regarding their answers to the demographic and flight-related questions. Regarding demographics in particular, it can be stated that the characteristics of the sample were very comparable with those of the sample for the real flight (Table 1). However, the participants on the simulated flight reported significantly more leisure flights and fewer other flights. Additionally, these subjects indicated that they used short-haul flights less frequently and had less experience with turboprop aircraft compared to the participants on the real flights.

3.2. Environmental Comfort

As already listed under Measures, many environmental factors were evaluated. Since the specific features of turboprop aircraft are vibration and noise, only these environmental factors are considered in detail. The results of the cabin demonstrator were compared with those of the real flights by comparing 95% confidence intervals.
At the end of the survey, a manipulation check was performed to assess how realistic the flight was and to get an overall picture of the participants impressions of the flight in comparison to their usual flight experiences. Subjects reported that their experience in the Cabin Demonstrator was moderately to very comparable with previously experienced flights and the pleasantness of the flight was only slightly influenced by the fact that it was a simulated flight. Therefore, it can be confirmed that the results are ecologically valid.

3.2.1. Acoustic Environment

The acoustic environment was rated as slightly more comfortable than uncomfortable (Table A1). Acceptability, pleasantness and satisfaction were evaluated as neutral. The aircraft noise was perceived as slightly loud and slightly annoying and was preferred to be slightly quieter. The engine was mentioned as the most frequent source of noise by far. In addition, other passengers, a high-pitched sound and the ventilation system were named as sources of noise.
Acoustic discomfort, acceptability and annoyance were comparable with results from the real flights, but comfort, pleasantness and perceived and preferred noise were rated better in the demonstrator.

3.2.2. Vibration

In the Cabin Demonstrator, subjects rated vibration as very comfortable, acceptable, somewhat pleasant and satisfactory (Table A2). Overall, only a slight vibration was perceived. During ascent, hardly any vibrations were felt in the head and upper back and a slight vibration was perceived in the other parts of the body. During the middle of the cruising phase and descent, hardly any vibrations were reported in the head, arms, hands, upper back and knees. In addition, a slight vibration was reported in the upper back, thighs, feet, sitting bones, seat edge touching the body and buttocks.
In all aspects concerning the evaluation of the vibration, vibration in the Cabin Demonstrator was rated better than in the real flights.

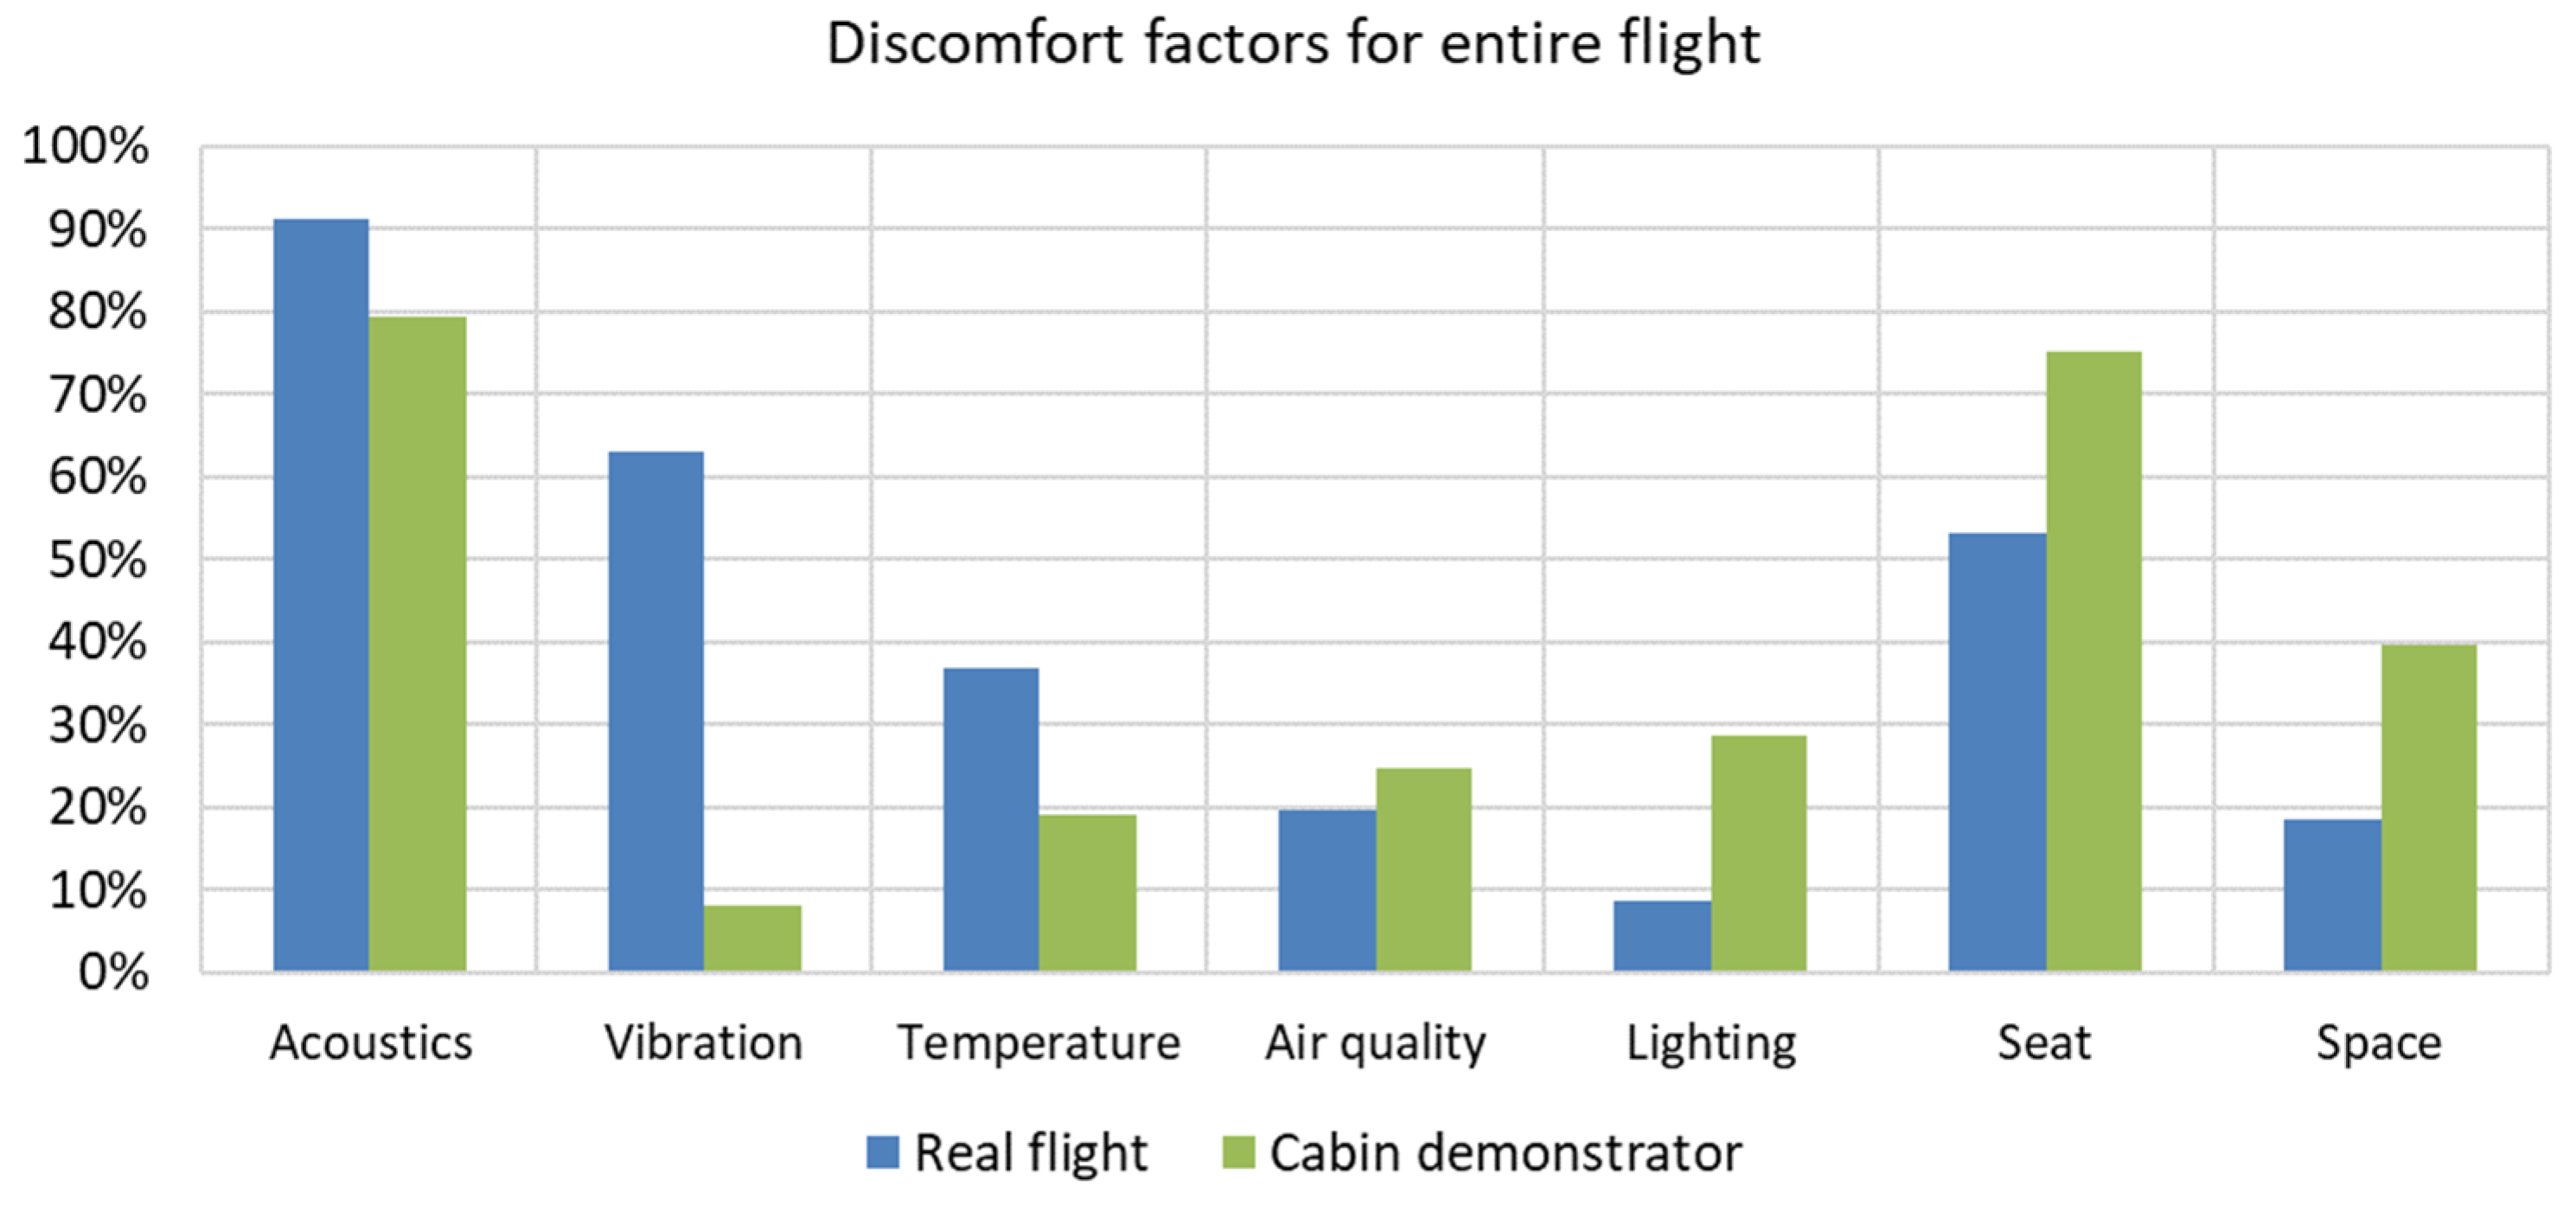
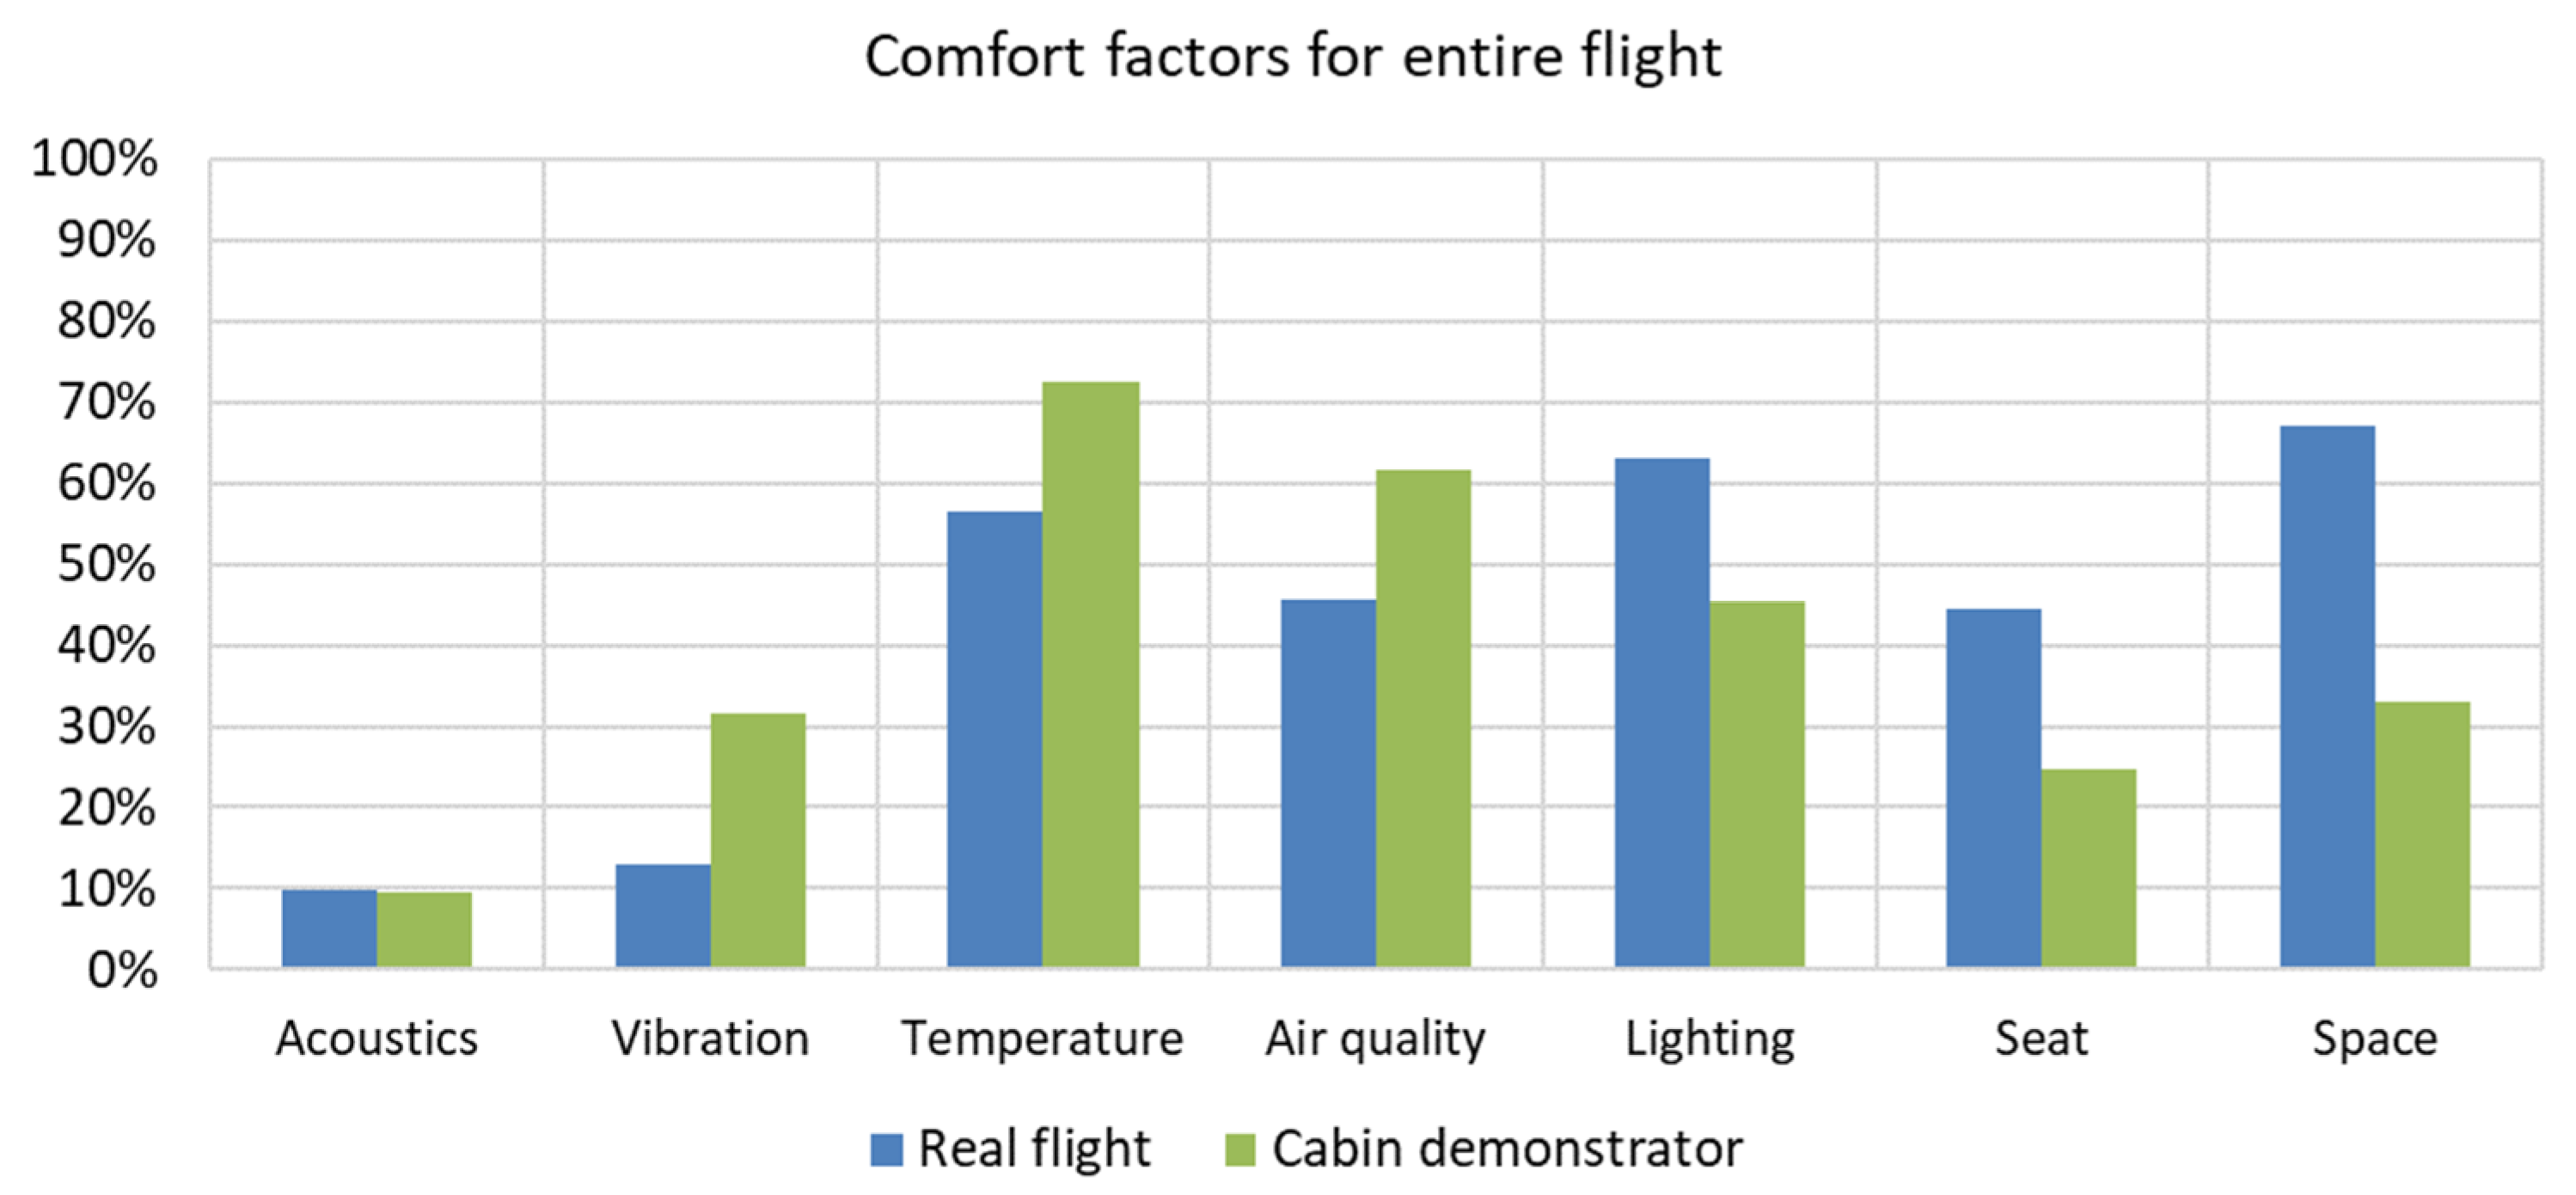
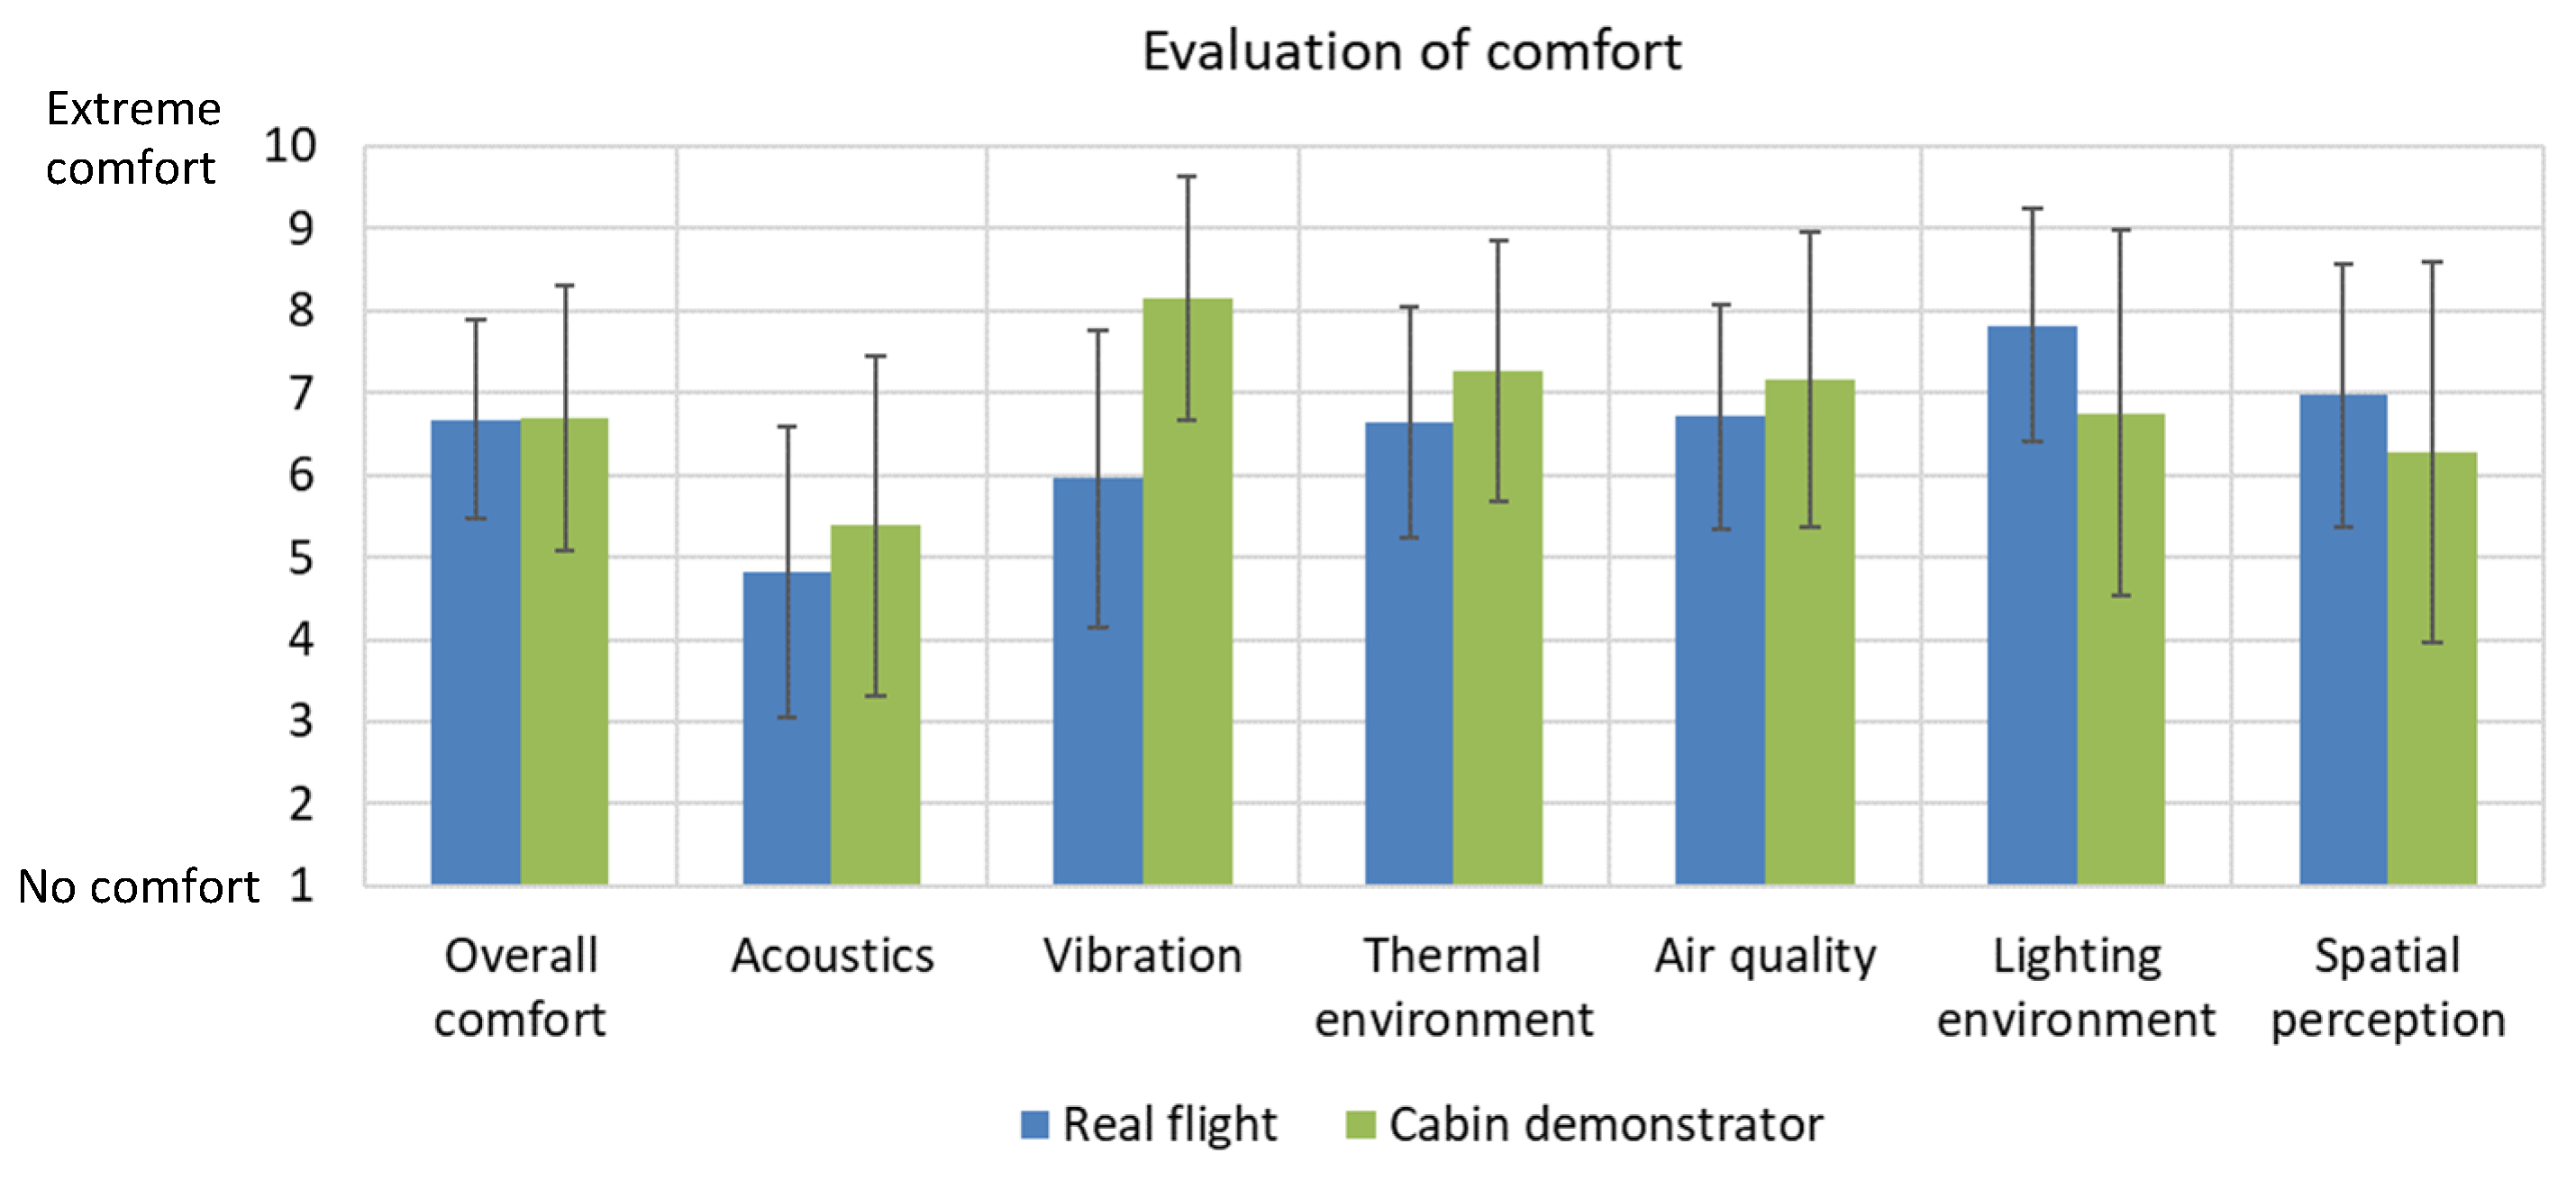
3.2.3. (Dis-)Comfort

During ascent, the middle of the cruising phase, decent and taxiing, subjects were asked to mark the three factors most contributing to the level of both discomfort and comfort they experienced. The seven factors temperature, noise, lighting, air quality, vibration, seat and space could be selected from. After the flight, these two questions were asked again but with reference to the entire flight. More than half of the subjects identified noise (79.5%) and their seat (75.3%) as the factors most contributing to discomfort in the demonstrator. Space (39.7%) was cited as the third most important factor for discomfort. For the experienced level of comfort, temperature (72.6%), air quality (61.6%) and lighting (45.2%) were reported as the most contributing factors. Vibration in the demonstrator appeared to be a factor that had a comparatively low impact on discomfort (8.2%) or comfort (31.5%).
The results of the entire flight in the demonstrator were compared with the results from the real flights published by Vink et al. [4]. In both studies, noise was the dominant discomfort factor (Figure 3). Seats were also an important factor in discomfort. The biggest difference in terms of discomfort between the real flights and the lights in the Cabin Demonstrator was vibration: while vibration was the second most frequently mentioned discomfort factor for the entire flight in the real flights, this factor was the least frequently mentioned driver of discomfort in the Cabin Demonstrator. One reason could be that in real flights, ascending, descending, turbulence or the general movement of the aircraft are also perceived as body movements and thus have a negative influence on the perception of vibration.
Temperature and lighting were among the top three factors contributing to comfort in both studies (Figure 4). However, in real flights, seat comfort was reported as another important comfort factor, whereas in the Cabin Demonstrator, air quality was reported as the third most important factor.
Figure 5 provides an overview of the evaluation of comfort regarding the various environmental factors in the real flights and those in the Cabin Demonstrator. Overall, the results of the demonstrator were very comparable to those in a real turboprop aircraft. Only the deviation in the assessment of the vibration was not negligible. This should be investigated in greater depth in future studies. The acoustic environment (t(182) = 2.00 *), vibration (t(182) = 8.88 ***) and the thermal environment (t(182) = 2.87 **) were evaluated as being better in the Cabin Demonstrator, whereas the lighting environment (t(182) = −3.89 ***) and spatial perception (t(181) = −2.36 *) were evaluated as being worse. No differences in overall comfort (t(182) = 0.13) or air quality (t(182) = 1.90) were detected.
One of the most important questions was whether the subjects would fly in a turboprop aircraft again: 94.5% would choose this aircraft again. The few participants who answered “no” stated that the aircraft was too loud. Even after the real flight, 87.9% stated that they would choose a turboprop aircraft again.

4. Discussion

The large number of people who would fly in a turboprop aircraft again indicates how important it is to continue researching these aircraft to increase their use. In general, noise is the biggest discomfort factor. Seat comfort also seems to be important. To make turboprop aircraft more attractive, the Cabin Demonstrator provides new opportunities to research new technologies quickly and cost-effectively.
The validation of the demonstrator can be considered as largely successful, only vibration needs revision. Thus, the Cabin Demonstrator can be used for further investigations. Some environmental factors were rated slightly better in the demonstrator than in the real flight. This better rating is partly due to a new and improved cabin design. The better evaluation of vibration in the Cabin Demonstrator may be due to the fact that there was a lack of turbulence. Presumably, turbulence or the general movement of the aircraft are also perceived as body movements and thus have a negative influence on the perception of vibration. The slightly lower rating of the lighting environment can be attributed to a lack of daylight and the short-term replacement of a broken light. The comparatively lower rating of the spatial perception in the Cabin Demonstrator could be caused by the fact that the real flights were performed in an ATR72-500 with higher seat pitch. Normally, this turboprop aircraft has 18 rows of seats (30″ pitch). In the aircraft that was used for the real flights, there were only 15 rows (34″ pitch). A larger pitch increases legroom, which makes passengers feel more comfortable.
Future research could concentrate on optimizing the level of vibration in the cabin demonstrator to make it more realistic, for example, by using stronger shakers. Nevertheless, the demonstrator can be used to research new technologies and improve passengers’ cabin experience.

5. Conclusions

The On-Ground Regional Passenger Cabin Demonstrator makes it easier to improve turboprop aircraft. The willingness to fly with such an aircraft is already high. If the noise is also improved, these aircraft could be used more often. If more passengers use turboprop aircraft, this will lead to lower fuel consumption and reduced CO2 emissions, which in turn will have a positive effect on the environment. Therefore, the demonstrator contributes to making the aviation industry more environmentally friendly while still being passenger friendly.

Author Contributions

Conceptualization, A.R., V.N., B.H., P.V., Y.S. and N.M; methodology, A.R., V.N., B.H. and P.V.; formal analysis, A.R., B.H. and P.V.; investigation, A.R., V.N., B.M., D.S., B.H., A.E., M.B., P.V., Y.S. and N.M; data curation, A.R., B.H. and P.V.; writing—original draft preparation, A.R.; writing—review and editing, V.N., B.M., D.S., B.H., A.E., M.B., P.V., Y.S. and N.M; visualization, A.R. and P.V.; supervision, V.N.; project administration, V.N., B.H., M.B., P.V. and N.M.; funding acquisition, V.N. All authors have read and agreed to the published version of the manuscript.

Funding

This research was funded by Clean Sky 2 Joint Undertaking, grant number 831992, 945548 and 945521.

Institutional Review Board Statement

The real flights study was conducted in accordance with the Declaration of Helsinki, and approved by the Human Research Ethics Committee of the Delft University of Technology (#1823) and by the Ethics Committee at the Faculty of Medicine, Ludwig-Maximilians-University, Munich (#21-1010). The demonstrator study was approved by the Fraunhofer ethics council.

Informed Consent Statement

Written informed consent was obtained from all subjects involved in the study.

Data Availability Statement

The data presented in this study are available on request from the corresponding author due to privacy of subjects.

Acknowledgments

We would like to thank the complete ComfDemo-team for their help in implementing the real flights and our colleagues from Fraunhofer IBP for their help in implementing the flights in the Cabin Demonstrator. We would like to thank LEONARDO and their partners for the excellent work on the cabin demonstrator.

Conflicts of Interest

The authors declare no conflicts of interest. The funders had no role in the design of the study; in the collection, analyses, or interpretation of data; in the writing of the manuscript; or in the decision to publish the results.

Appendix A

In Appendix A, detailed results about the evaluation of the acoustic environment (Table A1) and vibration (Table A2) can be found.
Table A1. Results from real flights and flights in Cabin Demonstrator regarding acoustic environment.
ItemsFlight PhaseReal FlightsFlights in Cabin Demonstrator
Mean (SD)95% CIMean (SD)95% CI
Perceived noise
(1 = very loud,
7 = very quiet)
Ascent2.49 (0.93)2.30; 2.682.71 (0.83)2.52; 2.90
Middle of cruise2.59 (1.05)2.38; 2.812.82 (0.75)2.65; 3.00
Descent2.85 (1.12)2.62; 3.083.04 (0.87)2.84; 3.24
Preferred noise
(1 = much louder,
7 = much quieter)
Ascent5.65 (0.91)5.46; 5.835.34 (0.82)5.15; 5.53
Middle of cruise5.72 (0.83)5.55; 5.895.32 (0.74)5.14; 5.49
Descent5.41 (0.89)5.23; 5.605.18 (0.70)5.02; 5.34
Annoyance
(1 = not annoying,
4 = very annoying)
Ascent2.05 (0.69)1.91; 2.201.99 (0.79)1.80; 2.17
Middle of cruise2.17 (0.72)2.02; 2.322.04 (0.98)1.81; 2.27
Descent2.06 (0.81)1.90; 2.232.01 (0.64)1.86; 2.16
Comfort
(1 = no comfort,
10 = extreme comfort)
Ascent4.58 (2.08)4.15; 5.015.14 (2.07)4.65; 5.63
Middle of cruise4.72 (2.00)4.31; 5.135.62 (2.34)5.07; 6.33
Descent5.22 (2.05)4.80; 5.635.79 (2.29)5.26; 6.33
Discomfort
(1 = no discomfort,
10 = extreme discomfort)
Ascent5.10 (2.31)4.62; 5.584.89 (2.25)4.35; 5.42
Middle of cruise4.66 (2.30)4.18; 5.134.84 (2.33)4.29; 5.15
Descent4.42 (2.23)3.96; 4.884.58 (2.36)4.01; 5.15
Acceptability
(1 = very unacceptable,
7 = very acceptable)
Ascent4.46 (1.56)4.14; 4.784.55 (1.42)4.22; 4.88
Middle of cruise4.45 (1.53)4.13; 4.764.60 (1.56)4.24; 4.97
Descent4.71 (1.49)4.40; 5.024.63 (1.42)4.30; 4.96
Pleasantness
(1 = very unpleasant,
7 = very pleasant)
Ascent3.35 (1.22)3.10; 3.613.68 (1.18)3.41; 3.96
Middle of cruise3.20 (1.16)2.96; 3.443.79 (1.39)3.47; 4.12
Descent3.59 (1.40)3.31; 3.873.90 (1.39)3.58; 4.23
SD = Standard deviation; CI = confidence interval.
Table A2. Results from real flights and flights in Cabin Demonstrator regarding vibration.
ItemsFlight Phase Real FlightsFlights in Cabin Demonstrator
Mean (SD)95% CIMean (SD)95% CI
Perceived vibration
(1 = no vibration,
5 = strong vibration)
Ascent2.62 (0.77)2.46; 2.781.93 (0.45)1.82; 2.04
Middle of cruise2.49 (0.67)2.35; 2.632.00 (0.53)1.88; 2.12
Descent2.43 (0.73)2.28; 2.582.04 (0.58)1.91; 2.18
Sum vibration for body areas (11–55, higher values more vibration)Ascent23.05 (6.35)21.69; 24.4019.88 (4.69)18.56; 21.20
Middle of cruise22.29 (5.92)21.04; 23.5317.86 (4.13)16.76; 18.96
Descent21.63 (7.19)20.12; 23.1418.36 (4.45)17.17; 19.55
Comfort
(1 = no comfort,
10 = extreme comfort)
Ascent5.74 (2.10)5.31; 6.178.21 (1.66)7.82; 8.59
Middle of cruise6.14 (1.92)5.74; 6.538.14 (1.82)7.71; 8.56
Descent6.03 (2.16)5.59; 6.478.14 (1.56)7.77; 8.50
Discomfort
(1 = no discomfort,
10 = extreme discomfort)
Ascent3.81 (2.12)3.37; 4.252.25 (1.39)1.91; 2.58
Middle of cruise3.36 (1.98)2.95; 3.772.49 (1.70)2.09; 2.90
Descent3.56 (2.14)3.12; 4.002.51 (1.60)2.12; 2.89
Acceptability
(1 = very unacceptable,
7 = very acceptable)
Ascent5.33 (1.24)5.08; 5.585.99 (1.15)5.71; 6.25
Middle of cruise5.36 (1.27)5.10; 5.625.96 (1.06)5.71; 6.21
Descent5.36 (1.37)5.08; 5.645.90 (1.02)5.66; 6.14
Pleasantness
(1 = very unpleasant,
7 = very pleasant)
Ascent4.14 (1.36)3.86; 4.425.12 (1.34)4.81; 5.44
Middle of cruise4.11 (1.27)3.85; 4.375.30 (1.27)5.00; 5.60
Descent4.22 (1.35)3.95; 4.505.21 (1.23)4.92; 5.50
SD = Standard deviation; CI = confidence interval.

References

  1. Babikian, R.; Lukachko, S.P.; Waitz, I.A. The historical fuel efficiency characteristics of regional aircraft from technological, operational, and cost perspectives. J. Air Transp. Manag. 2002, 8, 389–400. [Google Scholar] [CrossRef]
  2. Kincaid, R.K.; Laba, K.E.; Padula, S.L. Quelling cabin noise in turboprop aircraft via active control. J. Comb. Optim. 1997, 1, 229–250. [Google Scholar] [CrossRef]
  3. Mansfield, N.; West, A.; Vanheusden, F.; Faulkner, S. Comfort in the regional aircraft cabin: Passenger priorities. In Proceedings of the 21st Congress of the International Ergonomics Association, Cham, Switzerland, 13–18 June 2021. [Google Scholar] [CrossRef]
  4. Vink, P.; Vledder, G.; Song, Y.; Herbig, B.; Reichherzer, A.S.; Mansfield, N. Aircraft interior and seat design: Priorities based on passengers’ opinions. Int. J. Aviat. Aeronaut. Aerosp. 2022, 9, 3. [Google Scholar] [CrossRef]
  5. Mellert, V.; Baumann, I.; Freese, N.; Weber, R. Impact of sound and vibration on health, travel comfort and performance of flight attendants and pilots. Aerosp. Sci. Technol. 2008, 12, 18–25. [Google Scholar] [CrossRef]
  6. Pennig, S.; Quehl, J.; Rolny, V. Effects of aircraft cabin noise on passenger comfort. Ergonomics 2012, 55, 1252–1265. [Google Scholar] [CrossRef] [PubMed]
  7. Richards, L.G.; Jacobson, I.D.; Kuhlthau, A.R. What the passenger contributes to passenger comfort. Appl. Ergon. 1978, 9, 137–142. [Google Scholar] [CrossRef] [PubMed]
  8. Montalvo, A.; Parra, P.; Polo, Ó.R.; Carrasco, A.; Da Silva, A.; Martínez, A.; Sánchez, S. Model-driven system-level validation and verification on the space software domain. Softw. Syst. Model. 2022, 21, 2367–2394. [Google Scholar] [CrossRef]
  9. Reichherzer, A.; Norrefeldt, N.; Herbig, B.; Müller, B.; Vink, P.; Song, Y.; Euhus, A.; May, A.; Bellmann, M.; Mansfield, N. Validation of a turboprop cabin demonstrator. J. Phys. Conf. Ser. 2024, 2716, 012027. [Google Scholar] [CrossRef]
  10. Müller, B.; Lindner, A.; Norrefeldt, V.; Song, Y.; Mansfield, N.; Vink, P. Measurement of noise and indoor climate on board a turboprop airplane flight. In Proceedings of the 33rd Congress of the International Council of the Aeronautical Sciences (ICAS 2022), Stockholm, Sweden, 4–9 September 2022. Available online: https://www.icas.org/ICAS_ARCHIVE/ICAS2022/data/preview/ICAS2022_0115.htm (accessed on 31 March 2025).
  11. Reichherzer, A.; Herbig, B.; Vink, P.; Song, Y.; Vledder, G.; Yao, X.; Mansfield, N.; Bellmann, M. Subjective evaluation of noise and vibration in a turboprop aircraft. In Proceedings of the Towards Sustainable Aviation Summit (TSAS) 2022, Toulouse, France, 18–20 October 2022. [Google Scholar]
  12. Ideal Cabin Environment (ICE). Health effects of airline cabin environments in simulated 8-hour flights. Aerosp. Med. Hum. Perform. 2017, 88, 651–656. [Google Scholar] [CrossRef] [PubMed]
  13. Veitch, J.A.; Charles, K.E.; Farley, K.M.J.; Newsham, G.R. A model of satisfaction with open-plan office conditions: COPE field findings. J. Environ. Psychol. 2007, 27, 177–189. [Google Scholar] [CrossRef]
  14. Newsham, G.R.; Veitch, J.A.; Charles, K.E. Risk factors for dissatisfaction with the indoor environment in open-plan offices: An analysis of COPE field study data. Indoor Air 2008, 18, 271–282. [Google Scholar] [CrossRef] [PubMed]
  15. ISO 28802:2012; Ergonomics of the Physical environment—Assessment of Environments by Means of an Environmental Survey Involving Physical Measurements of the Environment and Subjective Responses of People. International Organization for Standardization: Geneva, Switzerland, 2012.
  16. ISO 2631-1:1997; Mechanical Vibration and Shock—Evaluation of Human Exposure to Whole-Body Vibration. International Organization for Standardization: Geneva, Switzerland, 1997.
  17. Kremser, F.; Guenzkofer, F.; Sedlmeier, C.; Sabbah, O.; Bengler, K. Aircraft seating comfort: The influence of seat pitch on passengers’ well-being. Work 2012, 41, 4936–4942. [Google Scholar] [CrossRef] [PubMed]
  18. Veitch, J.; Farley, K.; Newsham, G. Environmental Satisfaction in Open-Plan Environments: 1. Scale Validation and Methods; National Research Council of Canada: Ottawa, ON, Canada, 2002. [CrossRef]
  19. McDowell, I. Measures of self-perceived well-being. J. Psychosom. Res. 2010, 69, 69–79. [Google Scholar] [CrossRef] [PubMed]
  20. Ramos, É.M.S.; Bergstad, C.J.; Nässén, J. Understanding daily car use: Driving habits, motives, attitudes, and norms across trip purposes. Transp. Res. Part F Traffic Psychol. Behav. 2020, 68, 306–315. [Google Scholar] [CrossRef]
  21. Beck, M.J.; Rose, J.M.; Merkert, R. Exploring perceived safety, privacy, and distrust on air travel choice in the context of differing passenger screening procedures. J. Travel Res. 2018, 57, 495–512. [Google Scholar] [CrossRef]
Figure 1. Demonstrator by LEONARDO; interiors by Geven. (a) Passenger area; (b) galley area.
Engproc 90 00100 g001
Figure 2. Test sequence of questionnaires during flight phases.
Engproc 90 00100 g002
Figure 3. Percentage of passengers that reported various discomfort factors.
Engproc 90 00100 g003
Figure 4. Percentage of passengers that reported various comfort factors.
Engproc 90 00100 g004
Figure 5. Evaluation of comfort in the Cabin Demonstrator (mean values and standard deviation).
Engproc 90 00100 g005
Table 1. Characteristics (mean values ± standard deviation) of the sample on the real flights and the flights in Cabin Demonstrator. Differences were calculated by t-test or Chi2-test.
CharacteristicsReal FlightsFlights in Cabin
Demonstrator
Differences
Age33.86 (±14.31)33.55 (±14.57)t(165) = 0.16
Gender58 men + 35 women
+ 1 other
45 men + 27 women
+ 1 other
Chi2(1) = 0.01
Weight [kg]73.0 (±13.2)74.3 (±10.7)t(165) = −0.67
Height [cm]176 (±10)178 (±8)t(165) = −1.66
Current health status 13.24 (±0.70)4.35 (±0.70)t(156) = −0.09
Flights per year 7.10 (±10.00) (2019)4.66 (±5.00) (2023)t(163) = 1.90
Leisure flights [%]76.36 (±34.60)90.00 (±23.33)t(161) = −2.88 **
Business flights [%]13.02 (±27.04)7.60 (±20.18)t(160) = 1.42
Other flights [%]9.76 (±24.72)1.03 (±4.00)t(160) = 2.99 **
Flight duration
 short < 2 h [%]32.25 (±37.18)17.50 (±26.90)t(160) = 2.84 **
 medium 2–4 h [%]30.81 (±35.22)39.50 (±34.45)t(160) = −1.57
 long > 4 h [%]35.80 (±37.03)39.40 (±36.40)t(160) = −0.73
Flight experience [1,2,3,4,5,6,7]5.70 (±1.26)5.53 (±1.52)t(164) = 1.54
Turboprop experienceYes: N = 48
No: N = 29
Don’t know: N = 13
Yes: N = 22
No: N = 47
Don’t know: N = 4
Chi2(2) = 17.10 ***
1 1 = poor; 5 = excellent. * p < 0.05; ** p < 0.01; *** p < 0.001.
Disclaimer/Publisher’s Note: The statements, opinions and data contained in all publications are solely those of the individual author(s) and contributor(s) and not of MDPI and/or the editor(s). MDPI and/or the editor(s) disclaim responsibility for any injury to people or property resulting from any ideas, methods, instructions or products referred to in the content.

