1. Introduction
The different agricultural products value chains are essential for producing and distributing food, medicines, clothes, among many other products [
1,
2]. Two of the most important agricultural value chains worldwide are the sugar and corn chains [
3]. One essential activity for all agents in those value chains is to correctly predict the agricultural products’ prices [
1,
4,
5,
6,
7]. The quality of this prediction impacts decision-making and revenue generation for all agents in the value chains. However, most of the literature on time series analysis for price prediction focuses on prediction stock market prices, such as the works by [
8,
9,
10]. Traditionally, econometrics models such as autoregressive integrated moving average (ARIMA), seasonal ARIMA (SARIMA), and SARIMA with exogenous factors (SARIMAX) are used [
1,
4,
5,
6,
7,
8,
9,
10]. In the last decade, several machine learning (ML) models showed better performance, with lower mean absolute error (MAE), mean squared error (MSE), root mean squared error (RMSE), and higher R2 score [
1,
4,
5,
6,
7]. In addition, the long short-term memory network (LSTM) is considered a state-of-the-art model for price prediction [
6].
Ouyang et al. [
11] compared the use of ARIMA, LSTNet (an LSTM-based network), and different configurations of artificial neural networks to predict the prices of twelve agricultural commodities. They have concluded that the LSTNet presented the best results. Kanchymalay et al. [
4] compared, using a multi-layer perceptron, a support vector regression (SVR), and a Holt Winter exponential smoothing method to predict crude palm oil prices. The authors concluded that the SVR model presented the best results. Ref. [
6] evaluated using a backpropagation neural network and an LSTM to predict high and low prices of soybean futures, concluding that the LSTM presented better results.
The main objective of this work is to evaluate the use of state-of-the-art ML models to predict the daily prices of corn and sugar in Brazil in relation to traditional econometrics models. The following models were implemented: ARIMA, SARIMA, SVR, AdaBoost, LSTM, and ML ensembles with different configurations. All the models were evaluated on the test subset, composed of the whole year of 2019, considering three metrics: MAE, MSE, and R2 score.
2. Methodology
The methodology used in this paper was composed of five main steps:
i. Data gathering, collecting daily prices for sugar (from 2004 to 2019) and corn (from 2003 to 2019) from the CEPEA agricultural prices database [
12]; ii. data preprocessing, encompassing the following tasks: identifying and handling missing data and outliers, and dividing the datasets into subsets for both products. The subsets used were: (i) training: beginning of the dataset until the validation subset; (ii) validation: cross-validation using the blocking time series method; and (iii) testing: 2019; iii. exploratory data analysis, considering an analysis of each price time series and an autocorrelation analysis with the implementation of the augmented Dickey–Fuller test (ADF) test, autocorrelation (ACF) and partial autocorrelation functions (PACF), and their respective plots; iv. models implementation and hyperparameters analysis, considering the following models: (i) econometrics: ARIMA and SARIMA; (ii) ML: SVR and AdaBoost; (iii) DL: LSTM; and (iv) ensembles: E1 (AdaBoost + SVR), E2 (SVR + LSTM, and E3 (AdaBoost + LSTM); and v. models comparison for both products considering three error metrics: MAE, MSE, and R2.
The implementation was realized using Python on a Google Collaboratory CPU (
https://colab.research.google.com/, accessed on: 20 April 2021), with the following technical specifications: Intel(R) Xeon(R) CPU @ 2.30GHz CPU, 12GB of RAM. The libraries used were: NumPy (
https://numpy.org/, accessed on: 20 April 2021), Pandas (
https://pandas.pydata.org/, accessed on: 20 April 2021), Matplotlib (
https://www.tensorflow.org/, accessed on: 20 April 2021), TensorFlow (
https://www.tensorflow.org/, accessed on: 20 April 2021), Scikit-Learn (
https://scikit-learn.org/), and Statsmodels (
https://www.statsmodels.org/, accessed on: 20 April 2021).
3. Results and Discussions
The result of the ADF test showed that both agricultural products’ price series present autocorrelation. The analysis of the ACF and PACF plots also pointed out that there is seasonality in the data.
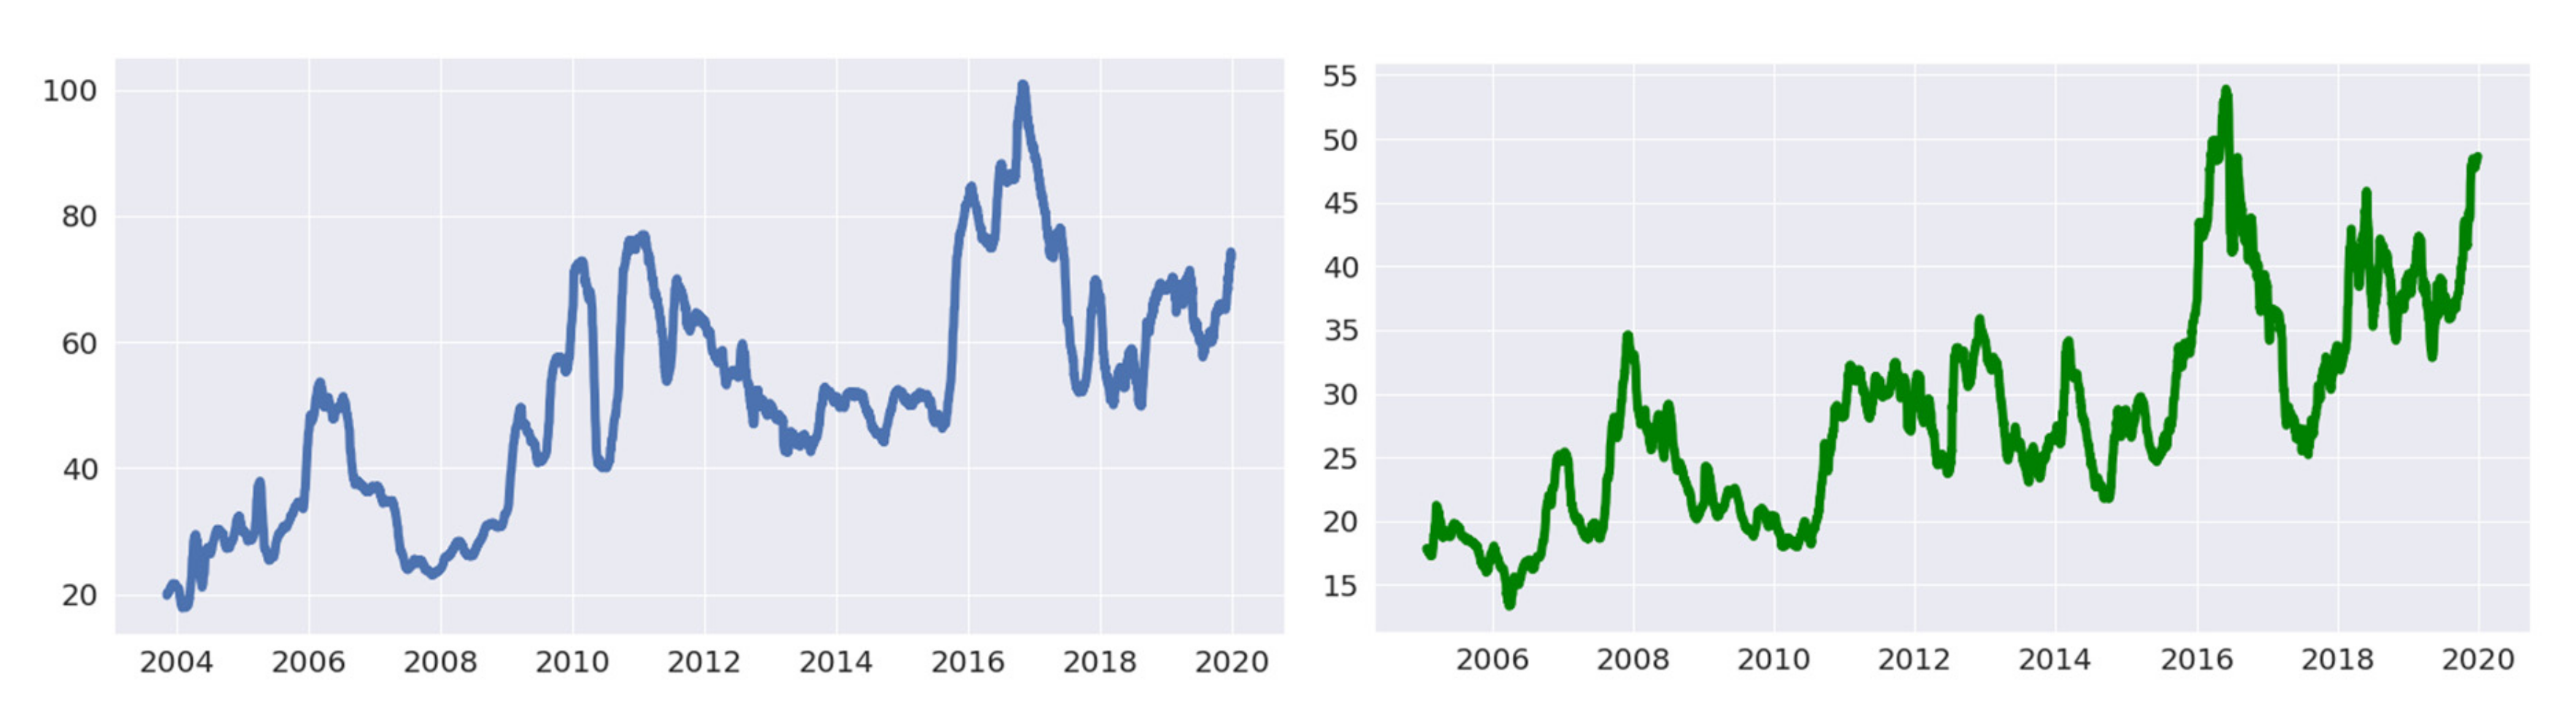
Figure 1 illustrates the prices in R
$/ton for both sugar and corn. It is important to observe that: (i) for sugar, the highest price peaks were observed between 2016 and 2017, between 2010 and 2012, and between 2006 and 2007; (ii) for sugar, the lowest prices were observed in 2004, 2008, and between 2013 and 2015; (iii) for corn, the highest price peaks were observed between 2016 and 2018, and between 2007 and 2008; (iv) for corn, the lowest prices were observed in 2006, 2010, 2015, and 2018; and (v) for both products, the were increasing significantly during 2020. Those points reflect several factors, such as the fluctuations in product demand worldwide, the occurrence of financial crises, the fluctuation in product supply (influenced mainly by the occurrence of droughts), the variation of exchange rates, and the impacts of the COVID-19 pandemics.
Table 1 presents a comparison of the final models implemented on the test subset (the year of 2019), considering the best hyperparameters values identified during the cross-validation procedure. It is essential to observe that, even though the prices time series for both products differed considerably, the models that presented the best results were: (i) SVR, (MAE: 0.287 for corn and 0.430 for sugar); (ii) ensemble of the SVR and LSTM models (MAE: 0.335 for corn and 0.458 for sugar); (iii) ensemble of the AdaBoost and SVR models (MAE: 0.395 for corn and 0.476 for sugar); and (iv) ensemble of the AdaBoost and LSTM models (MAE: 0.425 for corn and 0.500 for sugar). One of the reasons that may explain the superior performance for the SVR is the small dataset size.
The econometrics models presented the worst results for both products for the three metrics considered, implying that those models did not capture the trends in those datasets. Two of the main reasons that may explain this observation are: (i) both products’ prices were significantly volatile during the period; and (ii) both datasets presented non-stationary data and varying trends. It is also important to observe that all models presented better results for predicting corn prices in relation to the sugar prices, which can be related mainly to its lower price variation. Additionally, the observation that ML models and ensembles presented better results indicates that ML models and ensembles could improve agricultural products prices prediction results. This observation has important implications for researchers and practitioners, as it can help improve the quality of the price predictions for a given agricultural product. Furthermore, practitioners could use it to implement the ML models used in this work and backtest their results for different agricultural products and periods. This could provide valuable information for decision-making. It is essential to note that the methodology used in this work can be implemented for other products. Lastly, the main limitations observed were: (i) the small datasets used, which could have impacted on the LSTM results; (ii) the unknown market dynamics, making it challenging to generate new features; and (iii) the lack of standard datasets and model implementations in the literature for comparing the results obtained for the different agricultural products.
4. Conclusions and Future Works
Agricultural products value chains are essential for producing and distributing food, medicines, and clothes, among many other products. Therefore, improving product prices prediction is essential to improve decision-making by the different value chain agents. However, most works in the literature focus on predicting stock market prices. In this work, the use of traditional econometrics (ARIMA and SARIMA), ML (SVR and LSTM), and ML ensembles models (with different configurations) was evaluated for predicting daily prices for corn and sugar in Brazil.
It was observed that: (i) the SVR model presented the best results for both products, followed by the SVR and LSTM ensemble; (ii) the econometrics models presented the worst results for both products; and (iii) all models presented better results for predicting corn prices in relation to the sugar prices. Future work is related to: implementing other ML models, using unsupervised learning to improve pattern detection, implementing deep reinforcement learning models to allow for autonomous decision making, and evaluating other datasets and periods.
Author Contributions
Conceptualization, R.F.S.; methodology, R.F.S., B.L.B.; investigation, R.F.S., B.L.B.; writing—original draft preparation, R.F.S.; writing—review and editing, B.L.B., C.E.C.; supervision, C.E.C. All authors have read and agreed to the published version of the manuscript.
Funding
This work was carried out with the support from Itaú Unibanco S.A., linked to the Centro de Ciência de Dados (C2D) of the Polytechnic School of the University of São Paulo (USP).
Conflicts of Interest
The authors declare no conflict of interest.
References
- Kamilaris, A.; Kartakoullis, A.; Prenafeta-Boldu, F.X. A review on the practice of big data analysis in agriculture. Comput. Electron. Agric. 2017, 143, 23–37. [Google Scholar] [CrossRef]
- Verdouw, C.N.; Beulens, A.J.M.; Trienekens, J.H.; Wolfert, J. Process modelling in demand-driven supply chains: A reference model for the fruit industry. Comput. Electron. Agric. 2010, 73, 174–187. [Google Scholar] [CrossRef]
- FAO. Food and Agriculture Organization of the United Nations. FAOSTAT Database; FAO: Rome, Italy, 2021; Available online: http://www.fao.org/faostat/en/#data/QC (accessed on 1 March 2021).
- Kanchymalay, K.; Salim, N.; Sukprasert, A.; Krishnan, R.; Hashim, U.R.A. Multivariate time series forecasting of crude palm oil price using machine learning techniques. In IOP Conference Series: Materials Science and Engineering; IOP Publishing: Bristol, UK, 2017; Volume 226, p. 012117. [Google Scholar]
- Khamis, A.; Abdullah, S.N.S.B. Forecasting wheat price using backpropagation and NARX neural network. Int. J. Eng. Sci. 2014, 3, 19–26. [Google Scholar]
- Wang, C.; Gao, Q. High and low prices prediction of soybean futures with LSTM neural network. In Proceedings of the 2018 IEEE 9th International Conference on Software Engineering and Service Science (ICSESS), Beijing, China, 23–25 November 2018; pp. 140–143. [Google Scholar]
- Xiong, T.; Li, C.; Bao, Y. Seasonal forecasting of agricultural commodity price using a hybrid STL and ELM method: Evidence from the vegetable market in China. Neurocomputing 2018, 275, 2831–2844. [Google Scholar] [CrossRef]
- Kara, Y.; Boyacioglu, M.A.; Baykan, O.K. Predicting direction of stock price index movement using artificial neural networks and support vector machines: The sample of the Istanbul Stock Exchange. Expert Syst. Appl. 2011, 38, 5311–5319. [Google Scholar] [CrossRef]
- Di Persio, L.; Honchar, O. Artificial neural networks architectures for stock price prediction: Comparisons and applications. Int. J. Circuits Syst. Signal Process. 2016, 10, 403–413. [Google Scholar]
- Weng, B.; Lu, L.; Wang, X.; Megahed, F.M.; Martinez, W. Predicting short-term stock prices using ensemble methods and online data sources. Expert Syst. Appl. 2018, 112, 258–273. [Google Scholar] [CrossRef]
- Ouyang, H.; Wei, X.; Wu, Q. Agricultural commodity futures prices prediction via long-and short-term time series network. J. Appl. Econ. 2019, 22, 468–483. [Google Scholar] [CrossRef]
- CEPEA. Preços Agropecuários. 2021. Available online: https://www.cepea.esalq.usp.br/br (accessed on 5 January 2021).
| Publisher’s Note: MDPI stays neutral with regard to jurisdictional claims in published maps and institutional affiliations. |
© 2021 by the authors. Licensee MDPI, Basel, Switzerland. This article is an open access article distributed under the terms and conditions of the Creative Commons Attribution (CC BY) license (https://creativecommons.org/licenses/by/4.0/).


