1. Introduction
Successful grape production entails the implementation of management practices that control weeds which maintain grapevine performance and conserve soil quality. Integrated weed management, coupled with the use of autonomous robotic platforms (UGVs and UAVs), allows effective weed management, as a beneficial methodology for the environment [
1].
It is a fact that robotics technology is used more frequently as years go by. Crop production is one of the fields robotics, providing alternative ways to weed management by mitigating its biotic and abiotic stresses. For instance, automatic weeding robots nowadays have replaced chemical herbicides to a large extent [
2]. Weed spots are detected in cultivation with the help of UGV image acquisition and specific algorithms [
3,
4], in order for an autonomous robotic system to control weeds by herbicide spraying or through mechanical procedures [
5].
In this direction, this work proposes a new image-based technique with the implementation of an RGB-D camera mounted on an autonomous navigated robotic platform in order to depict the dispersion of the weeds at the inter-row path of the vineyards. The objective is to enable the weed mapping at inter-row path reducing labor cost and time. The real-time data from an RGB-D camera are filtered with a color and shape filter consecutively in order to reduce the “useless” information. Subsequently, the proposed technique was tested in many datasets in different vineyards with different levels of weed development.
2. Materials and Methods
The experimental procedure took place in a vineyard located at Ktima Gerovasiliou (Epanomi, Thessaloniki, Greece, 40°27′3″, 22°55′32″) during the summer period of 2020 and 2021.
2.1. UGV Platform and Sensors
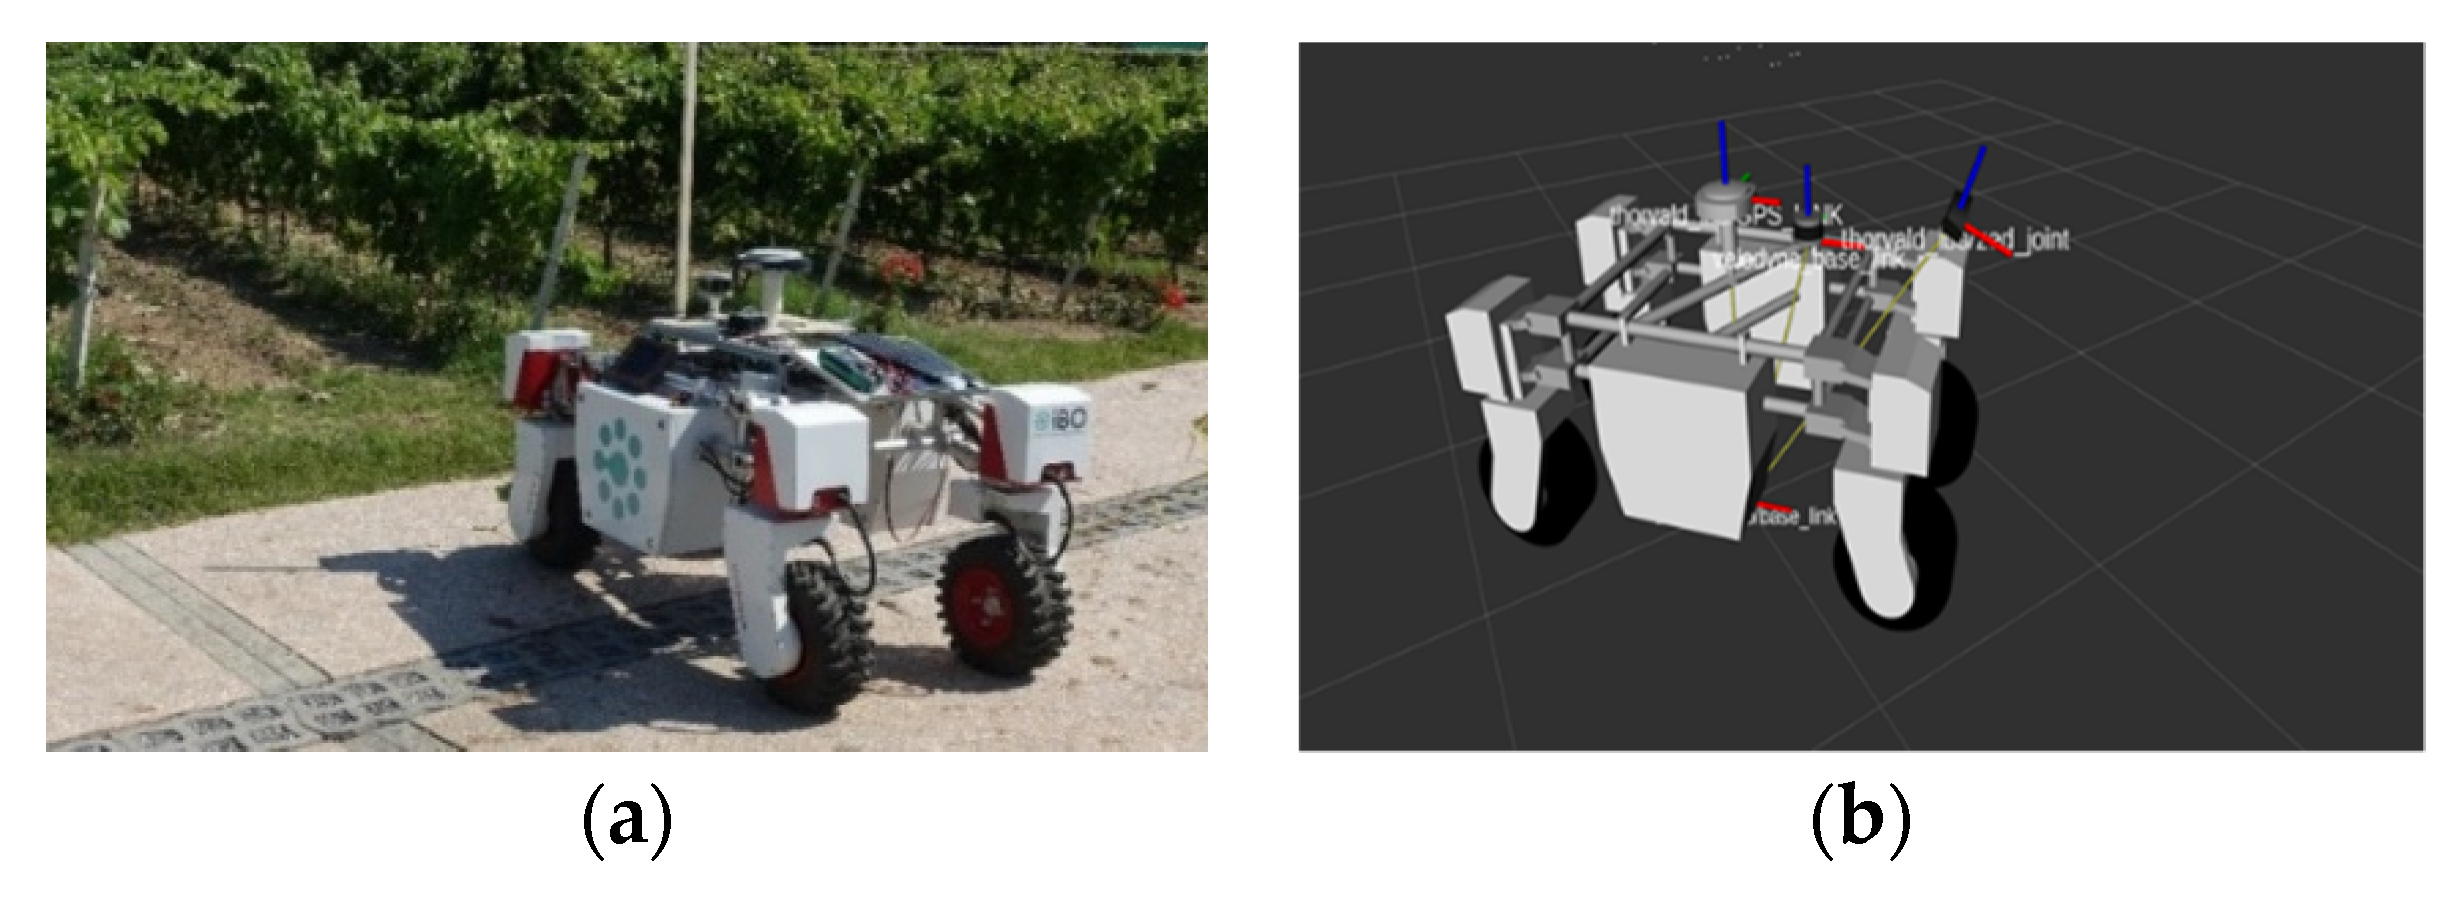
An autonomous robotic platform (Thorvald, Saga Robotics, Oslo, Norway) was used as a robotic platform for data acquisition. The robotic platform moved autonomously in a straight line, parallel to the vine row and in the center of the inter-row path. An RGB-D stereo camera was placed on a height-adjustable bar at the front side of the robotic platform. Furthermore, a Lidar sensor (Velodyne VLP 16) was used to scan the space around the vehicle and create a two-dimensional map containing the obstacles detected in space. Finally, a GNSS receiver (Spectra SP80 RTK) was used in order to inform the navigation system about the position of the vehicle in the field with latitude and longitude coordinates. All the sensors were placed on the vehicle in such a way without dead spots in the data that were received from them.
Figure 1 shows the Thorvald robotic platform and the mounted sensors for platform navigation and weed mapping in the vineyard.
2.2. Data Acquisition
The robotic platform moved at 1.5 km h
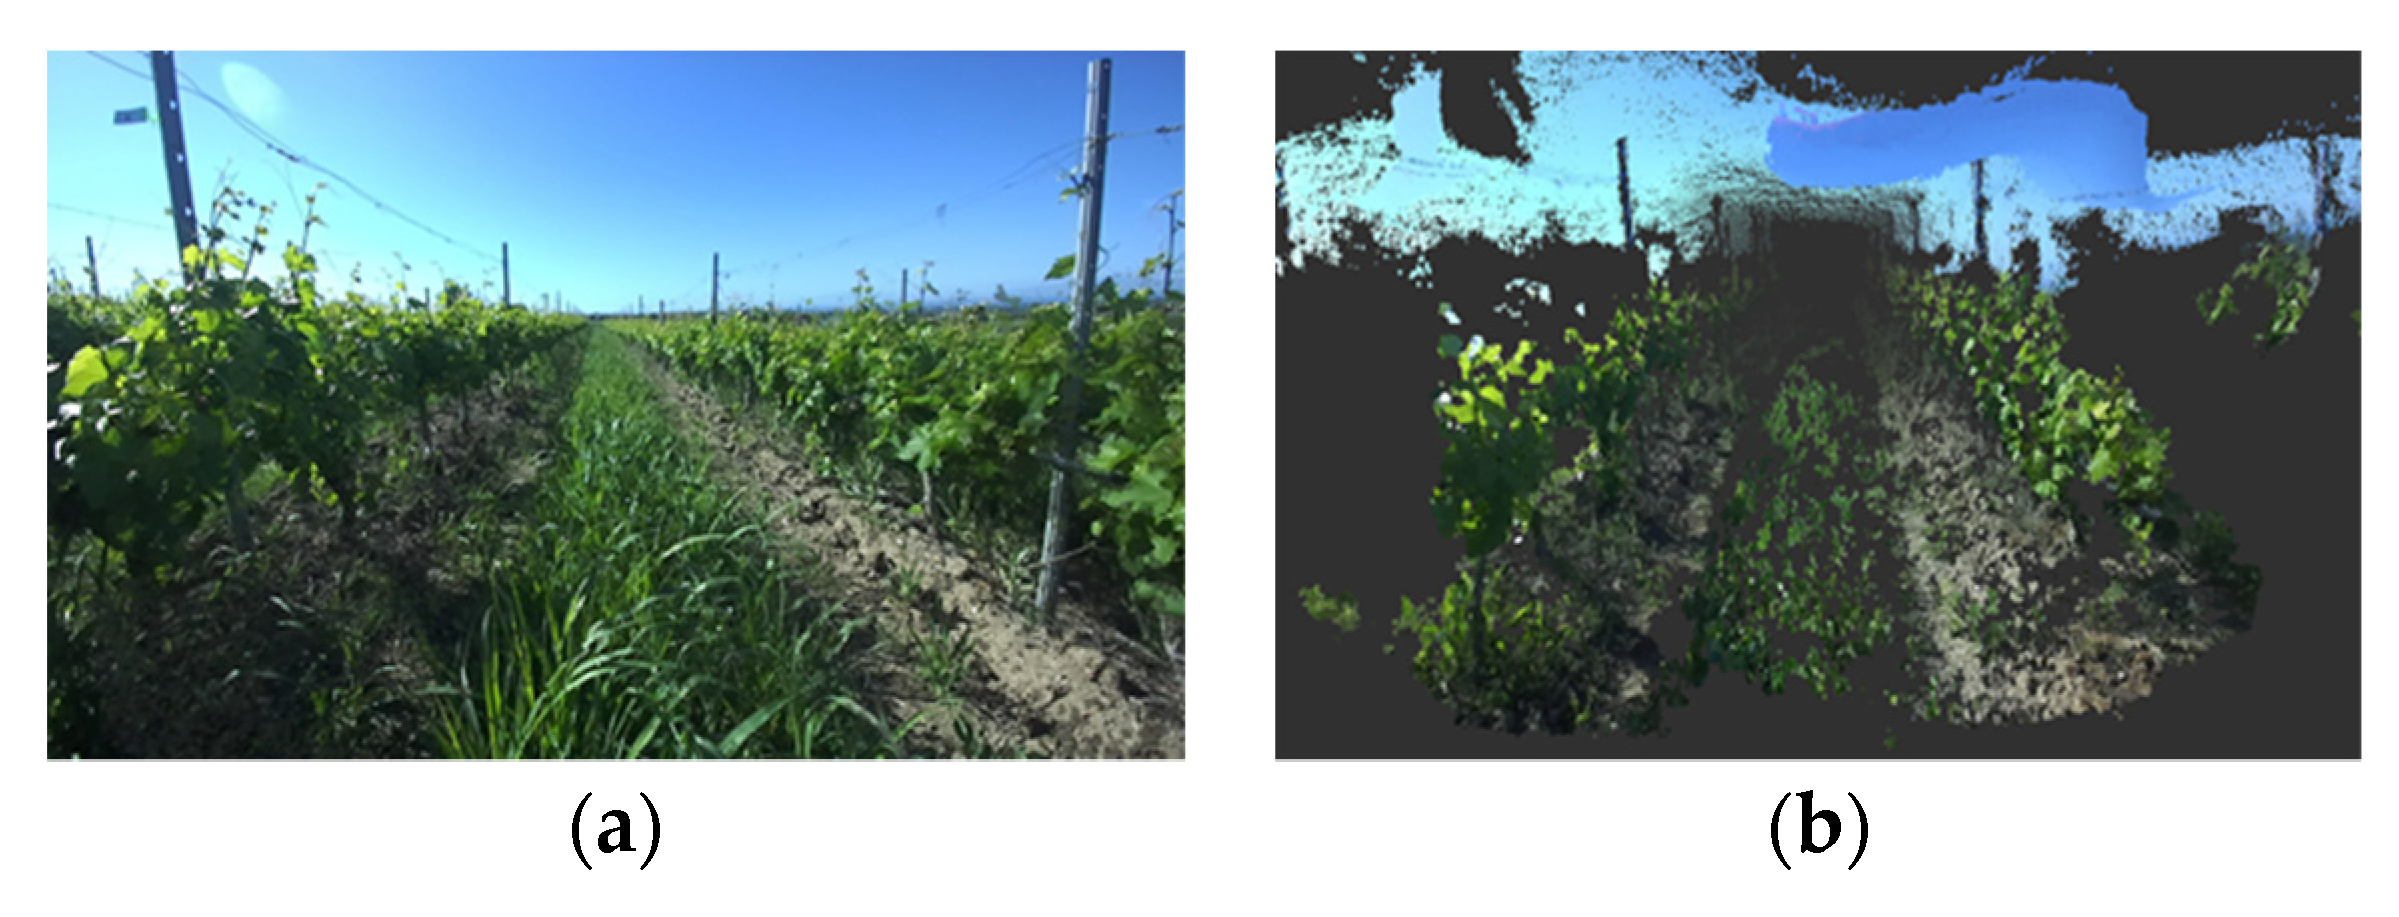
−1, producing insignificant vibrations at this speed. The ZED 2 stereo camera was mounted at the frond side of the platform and was used exclusively for weed mapping in the vineyard. A recording system was set up for data acquisition (Jetson TX2). This sampling system was equipped with the necessary instrumentation for data collection and remote operation mode. The sampling frequency was 15 Hz, ensuring high-quality data. The ZED 2 supplied RGB images (1280 × 720 pixels) together with depth information. The ZED 2 camera provided an image both in the form of photography (
Figure 2a) and in the three-dimensional form with the creation of a point cloud (
Figure 2b).
2.3. Methodology
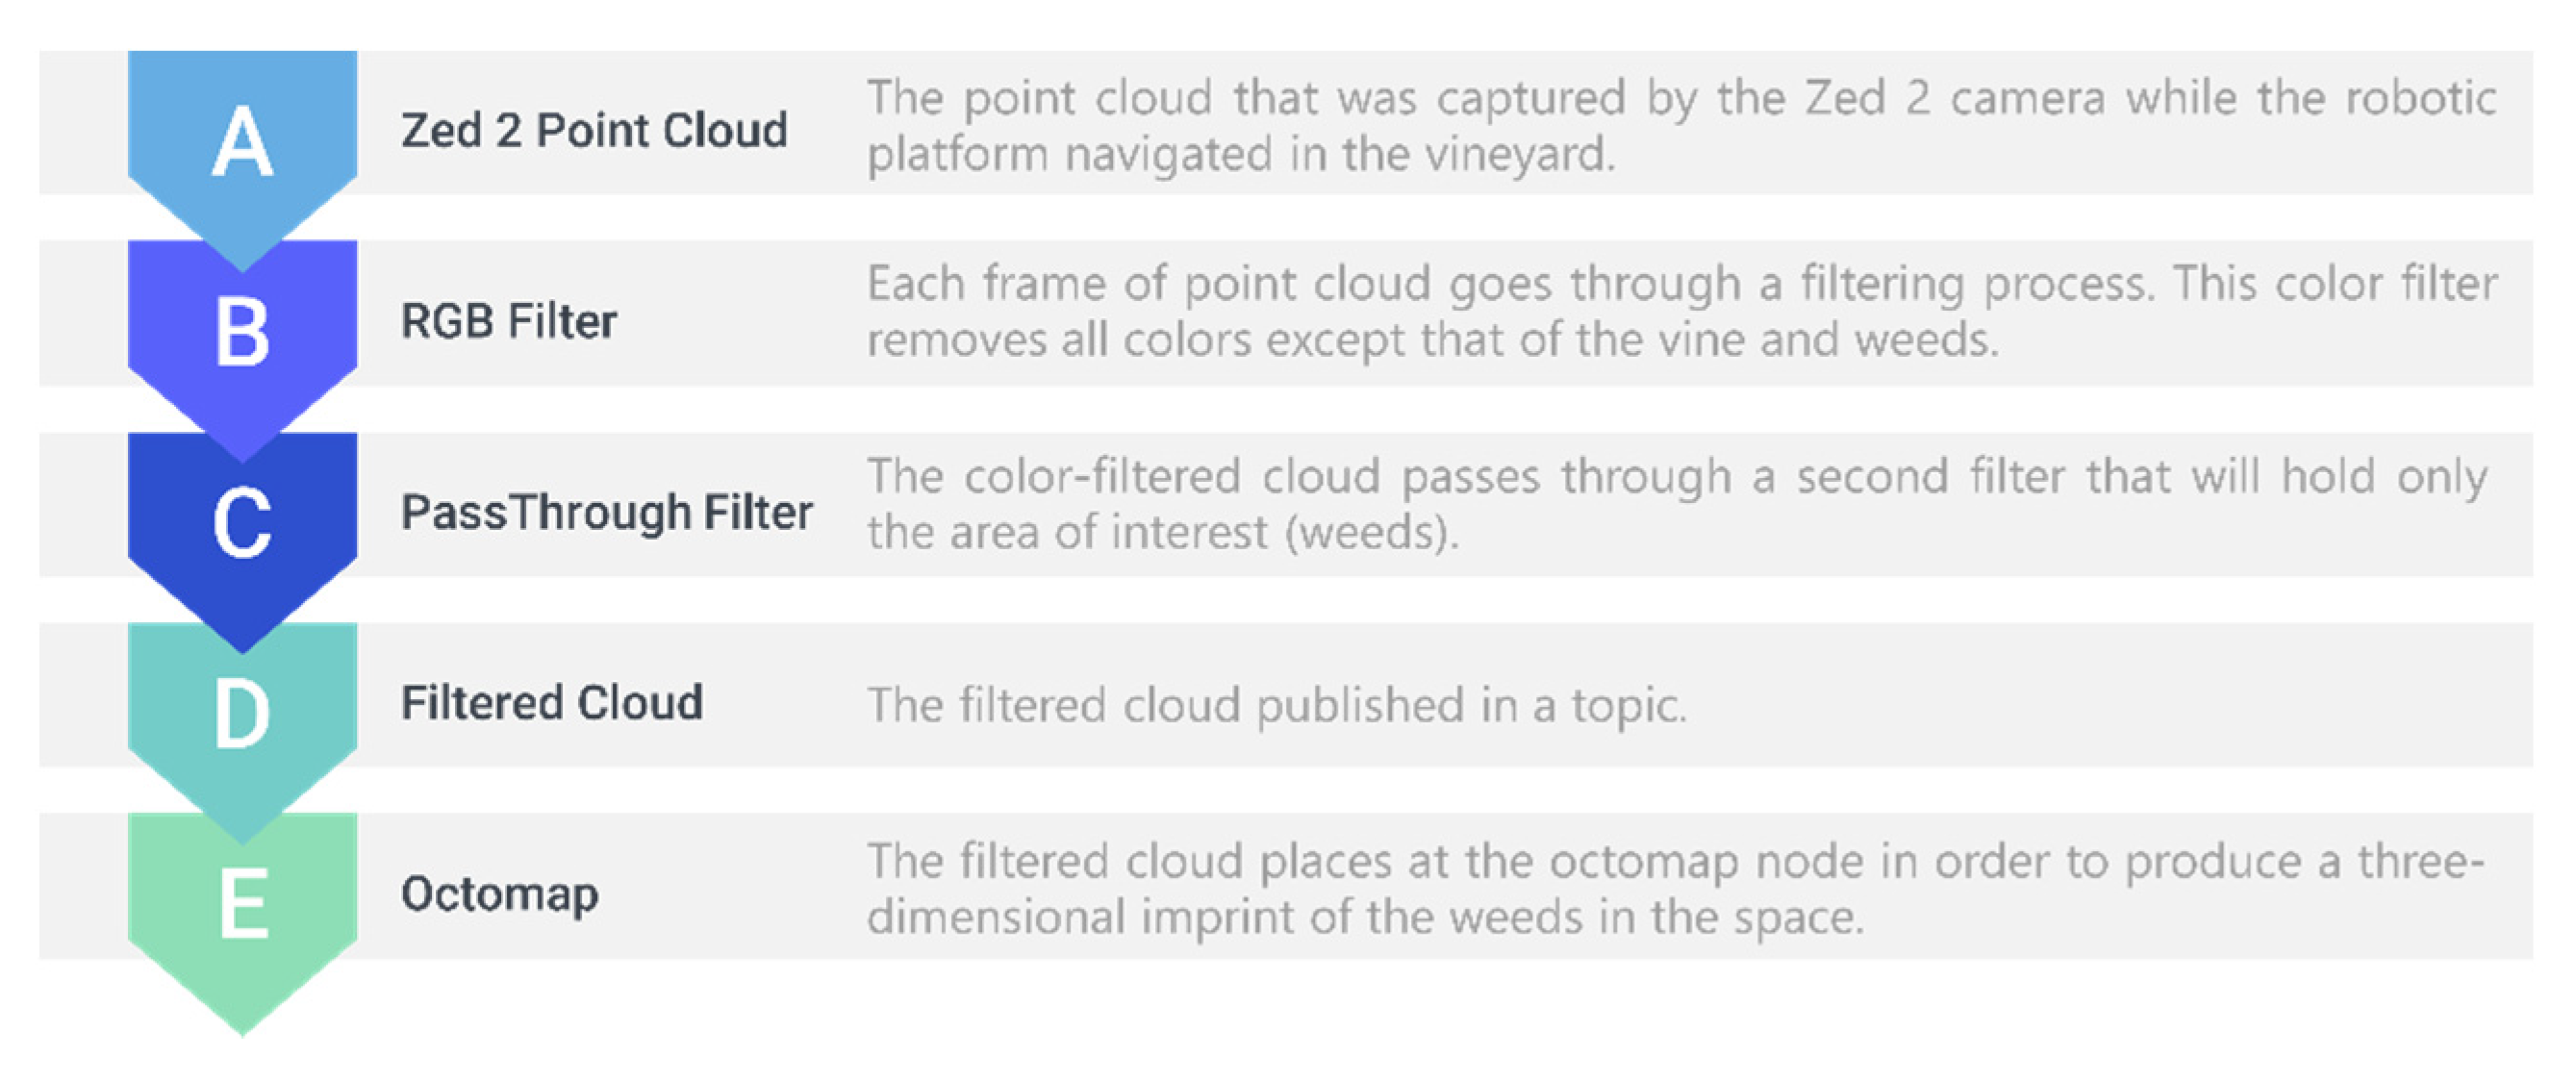
In order to detect the weeds in the inter-row path, the PCL_ROS library was used to locate the weeds in the data (point cloud) that were collected from the vineyard. This library comprises tools and filters that allow us to identify the weeds in the inter-row path and remove the “useless” information such as the vines and the soil. In this work, a simple technique was used to detect the weeds in the vineyard. This technique was based on the fact that the weeds are located at the inter-row of the vineyard and their height is over the field ground, also they have a green hue. Considering this assumption, two filters were developed in order to retain the information that meets these conditions. The entire process is presented in
Figure 3.
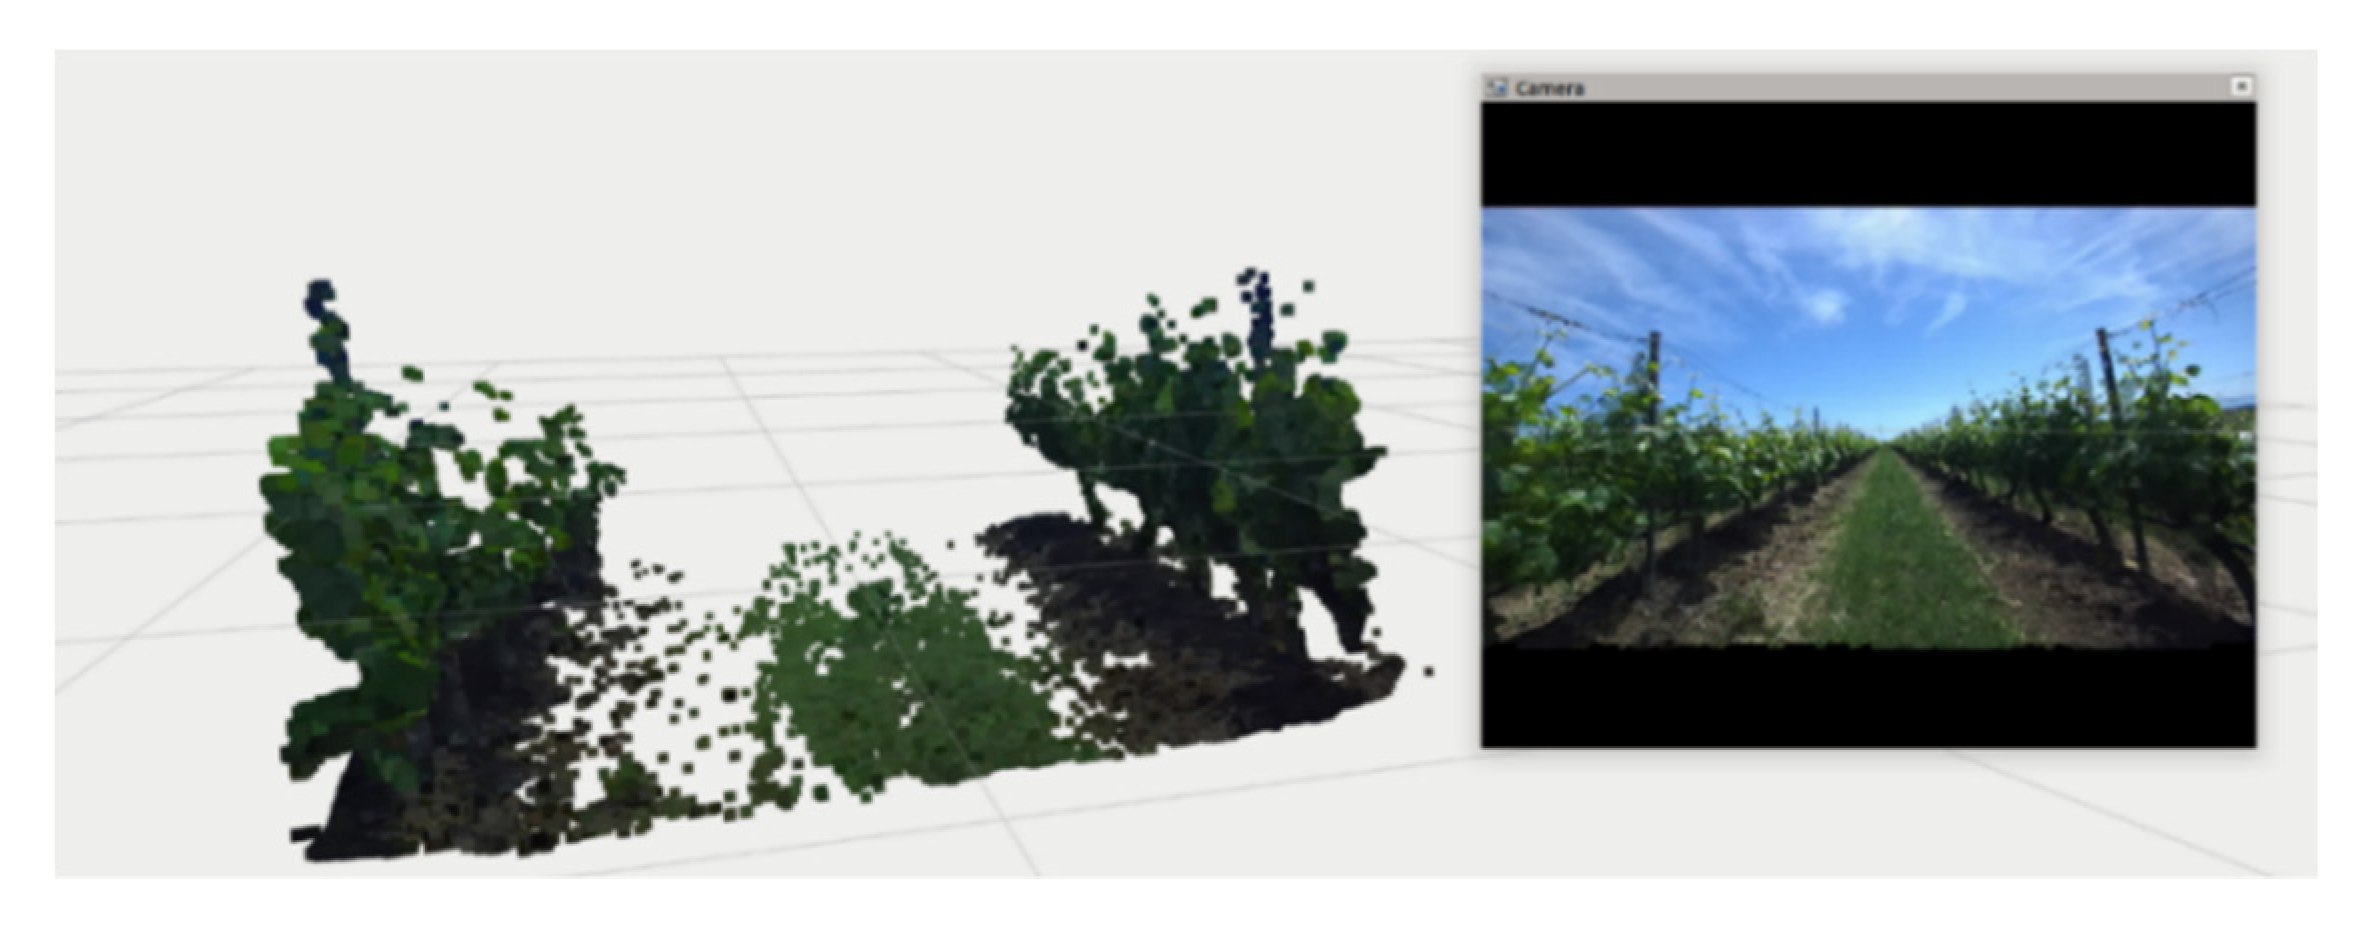
Initially, the color filter removes all colors except that of the vine and weeds. To remove the remaining colors, a second filter was created in order to remove all shades except those of green. The RGB filter values were selected after a number of tests took place at different time periods in the vineyard. The results of the first filter filtration are presented in
Figure 4. As it is clearly shown, the removal of “useless” colors in weed detection and the retention of the information necessary for detection are observed. To be more specific, the removal of the blue color is observed in
Figure 4, due to the noise of the camera as well as the removal of the soil that exists in the corridor. After this filtering, the remaining information includes the weeds and the vineyard.
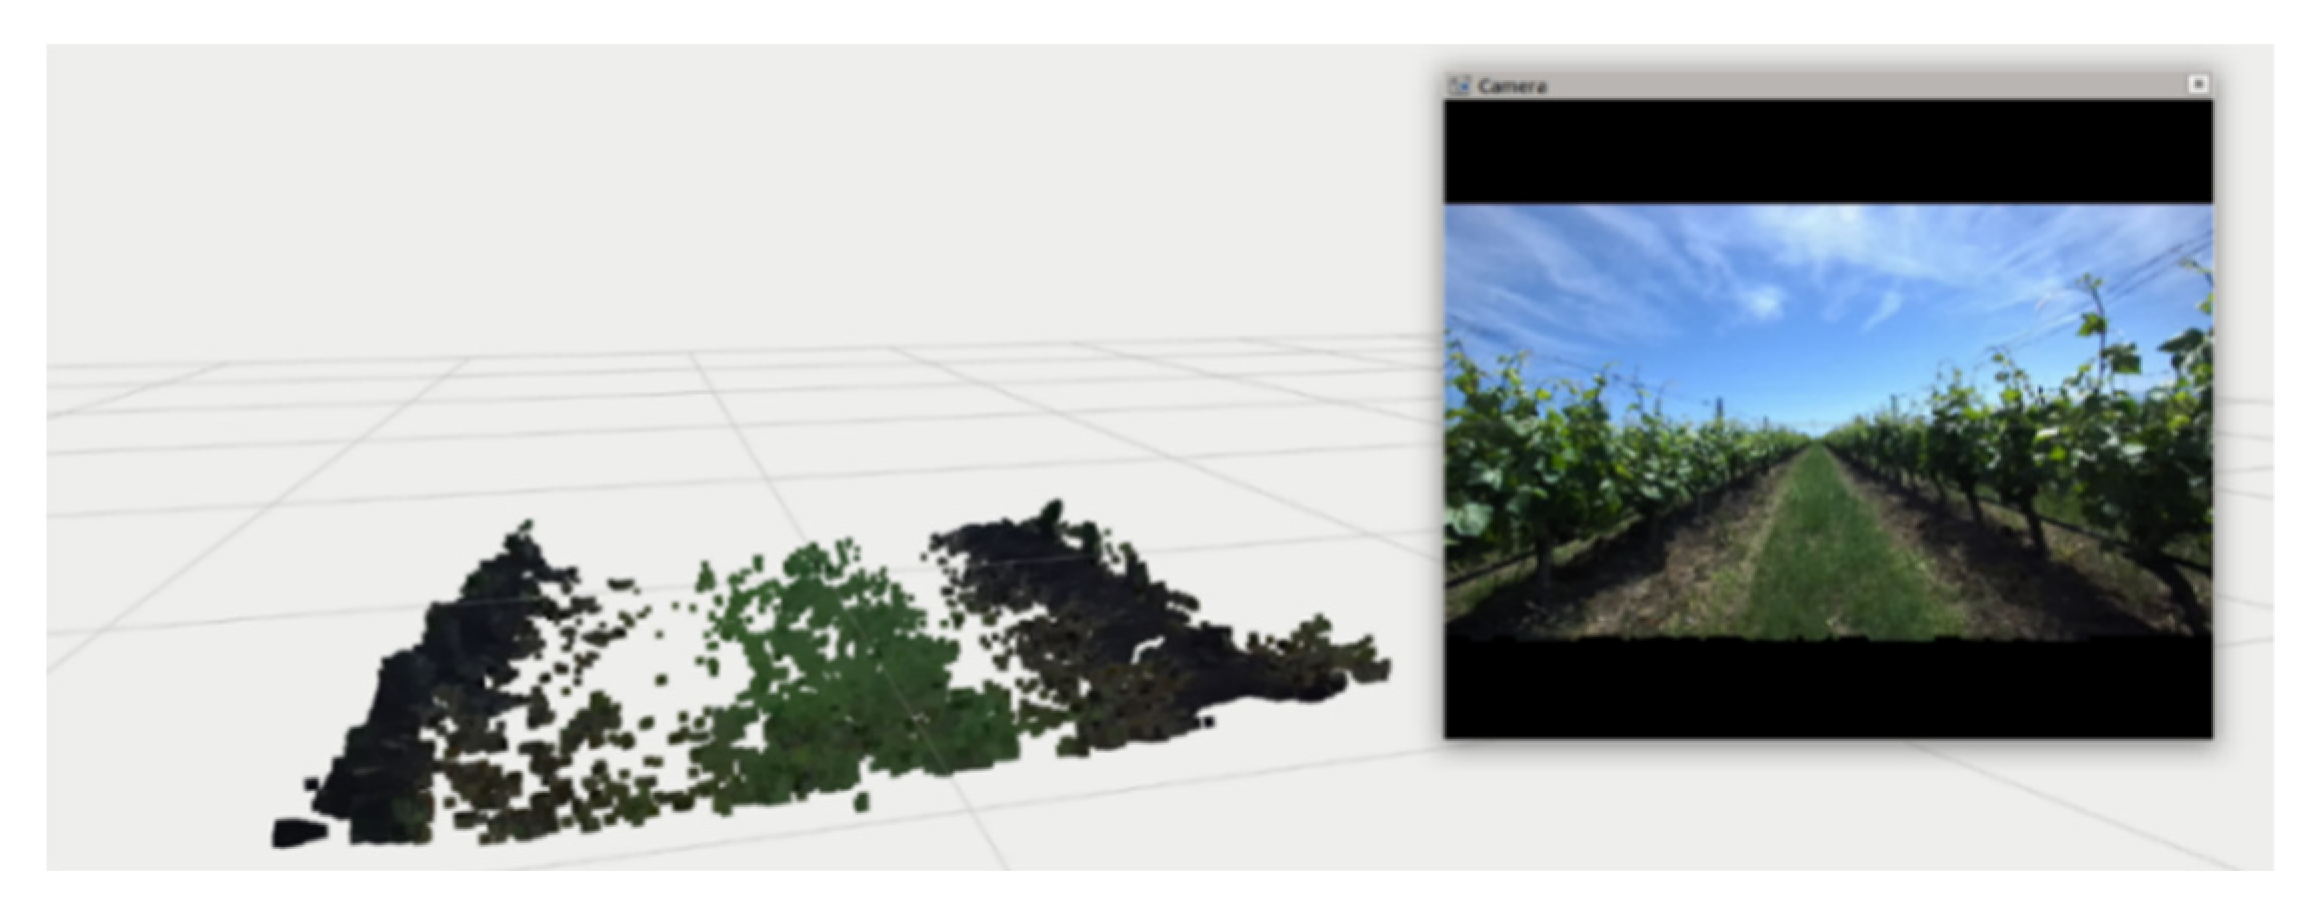
In the second phase, the filtered point cloud was also filtered in terms of its dimensions. All the areas that were not at the inter-row path were removed from the point cloud. The results of the application of the second filter are presented in
Figure 5. It is obvious that the vineyard rows were removed and the only information remaining in the point cloud is from the inter-row path.
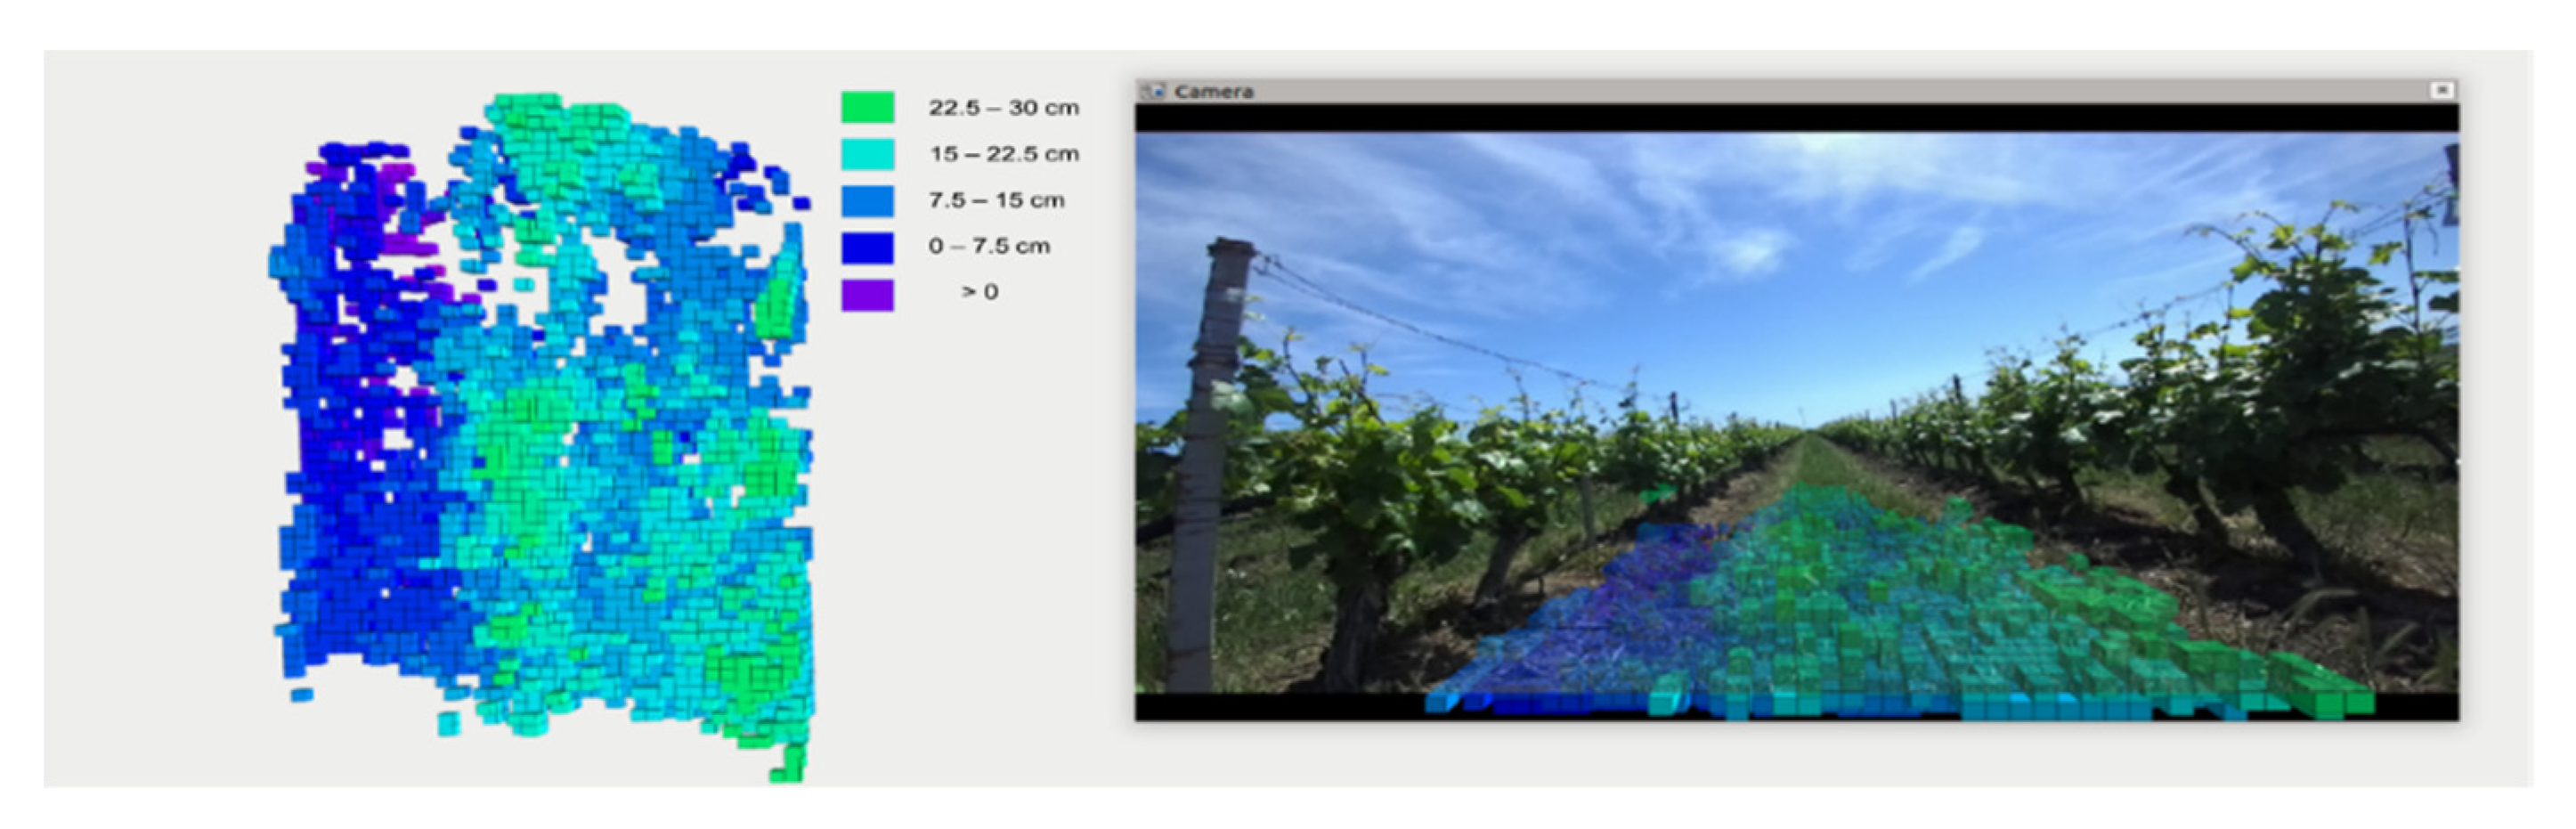
After the filtering process of the point cloud, the remaining information concerns the weeds in the inter-row path of the vineyard. Initially, all points of the point cloud were taken at distances concerning the coordinate system of the frame ZED_LINK coordinates. The ROS tf_tranform library was used for the process of transforming the point cloud from the ZED_LINK frame to the world frame. After the end of this transformation process, the point cloud points obtained with the camera were converted to point cloud utm coordinates. This point cloud could then geotag and was ready to present the height distribution map of the inter-row path weeds in the vineyard (
Figure 6).
3. Conclusions
To conclude, this work was based on an image-based technique using an RGB-D camera with the aim to show the dispersion of the weeds at the inter-row path of a vineyard. While pre-processing, the RGB-D camera’s real-time data were transformed into different color spaces for noise reduction. The above algorithms and techniques were tested in data from real vineyards, on a UGV platform with promising results, where weeds are not at the same development phase.
Author Contributions
Conceptualization, D.K. (Dimitrios Kateris); methodology, D.K. (Dimitrios Kateris), D.K. (Damianos Kalaitzidis); software, D.K. (Damianos Kalaitzidis); validation, D.K. (Damianos Kalaitzidis) and V.M.; formal analysis, D.K. (Dimitrios Kateris) and D.K. (Damianos Kalaitzidis); investigation, V.M.; resources, D.K. (Dimitrios Kateris); data curation, D.K. (Damianos Kalaitzidis); writing—original draft preparation, D.K. (Dimitrios Kateris); writing—review and editing, A.C.T. and D.B.; visualization, D.K. (Damianos Kalaitzidis); supervision, D.B.; project administration, D.K. (Dimitrios Kateris); funding acquisition, D.B. All authors have read and agreed to the published version of the manuscript.
Acknowledgments
This work was supported by the HORIZON 2020 Project “BACCHUS: Mobile Robotic Platforms for Active Inspection and Harvesting in Agricultural Areas” (project code: 871704) financed by the European Union, under the call H2020-ICT-2018-2020.
Conflicts of Interest
The authors declare no conflict of interest.
References
- Jiménez-Brenes, F.M.; López-Granados, F.; Torres-Sánchez, J.; Peña, J.M.; Ramírez, P.; Castillejo-González, I.L.; de Castro, A.I. Automatic UAV-based detection of Cynodon dactylon for site-specific vineyard management. PLoS ONE 2019, 14, e0218132. [Google Scholar] [CrossRef] [PubMed]
- Wu, Z.; Chen, Y.; Zhao, B.; Kang, X.; Ding, Y. Review of weed detection methods based on computer vision. Sensors 2021, 21, 3647. [Google Scholar] [CrossRef] [PubMed]
- Benos, L.; Tagarakis, A.C.; Dolias, G.; Berruto, R.; Kateris, D.; Bochtis, D. Machine Learning in Agriculture: A Comprehensive Updated Review. Sensors 2021, 21, 3758. [Google Scholar] [CrossRef] [PubMed]
- Anagnostis, A.; Tagarakis, A.C.; Asiminari, G.; Papageorgiou, E.; Kateris, D.; Moshou, D.; Bochtis, D. A deep learning approach for anthracnose infected trees classification in walnut orchards. Comput. Electron. Agric. 2021, 182, 105998. [Google Scholar] [CrossRef]
- Moreno, H.; Rueda-Ayala, V.; Ribeiro, A.; Bengochea-Guevara, J.; Lopez, J.; Peteinatos, G.; Valero, C.; Andújar, D. Evaluation of vineyard cropping systems using on-board rgb-depth perception. Sensors 2020, 20, 6912. [Google Scholar] [CrossRef] [PubMed]
| Publisher’s Note: MDPI stays neutral with regard to jurisdictional claims in published maps and institutional affiliations. |
© 2021 by the authors. Licensee MDPI, Basel, Switzerland. This article is an open access article distributed under the terms and conditions of the Creative Commons Attribution (CC BY) license (https://creativecommons.org/licenses/by/4.0/).


 ,
, 

