Proceeding Paper

A Quantitative Model of Supply Chain Disruption Propagation Dynamics †

Institute for Infocomm Research (I2R), A*STAR, 1 Fusionopolis Way, Singapore 138632, Singapore
*
Author to whom correspondence should be addressed.
Presented at the 2024 IEEE 7th International Conference on Knowledge Innovation and Invention, Nagoya, Japan, 16–18 August 2024.
Eng. Proc. 2025, 89(1), 1; https://doi.org/10.3390/engproc2025089001
Published: 21 February 2025

Abstract

:
Supply chain disruptions caused by natural disasters and human-made incidents have inflicted substantial losses on numerous companies. The management of supply chain risks, including disruption risk, has garnered significant attention from both academia and industries over the past few decades. Companies must develop effective solutions for disruption risk management. To seek an effective solution with disruption event monitoring and mitigation plans, we investigated the mechanisms and dynamics of disruption propagation along the supply chain. Specifically, we developed a quantitative mathematical model for the entire supply chain using system dynamics to understand the characteristics of disruption propagation, such as time spent for the disruption from the event location to a focal company and its impact. The model provides important management information on the development of a disruption monitoring system to enhance the resilience and robustness of supply chains, develop mitigation strategies, and minimize the adverse effects of disruptions.

1. Introduction

Supply chains are extraordinarily complex, with various companies collaborating closely to improve efficiency and reduce costs. While the close relationship among companies brings significant benefits in developing innovative products and cost reduction, the interdependence among companies increases the potential risk for supply chain disruption. Supply chain disruptions stemming from natural disasters and human-made incidents cause substantial losses. For instance, the devastation caused by Hurricane Harvey in 2017 resulted in an estimated loss exceeding USD 125 billion [1]. Other examples include a fire at the Philips microchip plant in Albuquerque, New Mexico, in 2000; Hurricane Katrina in 2006; the tsunami in Japan and the flood in Thailand in 2011; a fire at the Meridian Magnesium Products of America factory in Eaton Rapids, Michigan, in 2018; and Hurricane Ian in USA in 2022.
Over the past two decades, the management of supply chain risks, including disruption risk, has garnered significant attention. Researchers have explored risk classification and analysis, disruption propagation, disruption recovery, supply chain resilience, supply chain design, and so on. Despite the availability of numerous models and frameworks for supply chain risk management [2,3,4], the disruption propagation process remains a challenge, needing more quantitative models [5] that provide a deeper understanding of its dynamics.
In this study, we developed a model to capture the essential dynamics of disruption propagation and understand important factors and their interrelationships. It is a core part of developing an effective solution for disruption monitoring, analysis and assessment, and early warning and mitigation plans. To establish the model, we delved into the mechanism and dynamics of disruption propagation. The developed mathematical model was used to analyze the time to propagate disruption from the event location to the focal company and assess the severity of its impact. The model provides important information to develop disruption monitoring systems and enhance the resilience and robustness of supply chains. It also helps to develop mitigation strategies to minimize the adverse effects of disruptions.
The rest of this paper is organized as follows. Section 2 presents the literature review. In Section 3, we describe the problem formulation. Section 4 models the supply chain as a continuous flow system using system dynamics principles. Section 5 describes the characteristics of disruption propagation. A numerical example for calculating the disruption propagation is shown in Section 6. Finally, conclusions and discussions are given in Section 7.

2. Literature Review

Supply chain risk management has attracted intense interest from academics and industries. Various aspects have been researched, including disruption types, disruption propagation and ripple effects, disruption recovery, supply chain resilience, and supply chain design. In this study, we specifically focus on disruption propagation [2,4,5,6,7,8].
Different methods have been used to analyze disruption propagation. Bayesian networks are used to obtain the risks/probabilities of some disruptions [3,4,9]. However, these models often model the disruptions as static events while neglecting the disruption duration and not explicitly considering the inventory levels of companies. Wilson [10] used system dynamics simulation to investigate the effect of a transportation disruption on supply chain performance. Schmitt and Singh [11] developed a discrete-event simulation model for a supply chain to analyze the inventory placement and backup methodologies and assess their impact on reducing supply chain risk. Tan et al. [12] used discrete-event simulation to study the effect of disruption on downstream companies’ performance. In these simulations, the disruption duration and inventory levels are incorporated. While simulation results provide valuable information, the results are dependent on the simulation scenarios, parameter settings, and the simulation model details. Therefore, these findings cannot be applied to other situations.
Researchers have also used Petri Nets to model and analyze supply chain disruptions [13,14,15]. Petri Nets model concurrent events in systems, and they are often combined with discrete-event simulation to analyze disruption. These analyses share similar characteristics with discrete event simulation.
Disruption duration and inventory levels are overlooked in models or considered only in specific scenarios. In this study, we developed a model for disruption propagation using system dynamics principles and considering details in production, inventory, and transportation.

3. Problem Formulation

Company A obtains raw materials/components from its tier 1 supplier. The supplier has its own suppliers (tier 2 supplier of Company A). In this way, a complex, multi-tiered supply chain is formed (Figure 1). Due to the process characteristics of Company A, the limited shelf life of raw materials/components, and the competitive pressure, the reliable and on-time supply of raw materials and components is critical to the company. The company wants to have a good understanding about how the disruption events in the supply chain affect its material supply, more specifically, if a disruption event occurs in an upstream supplier, when will the disruption propagate to the focal company and what is the severity?
In this analysis, we assume a single disruption event at a specific company for simplicity. This assumption aligns with many cases in the literature. Another assumption is that when a disruption event happens, all companies in the supply chain still continue their normal operational practices without adopting measures to obtain competitive advantages during the supply shortage. For example, if a company offers higher prices to secure more material supply from its supplier, other customers of the same supplier may face more serious shortages. We do not consider these scenarios. In other words, when the disruption event happens, we assume the material flow (among different companies) in the supply chain is still like the normal case until the materials are exhausted. This assumption reflects the current practices, especially in the absence of a disruption monitoring system and active response strategies. It also allows for the fundamental characteristics of disruption propagation.

4. Modeling Process and Material Flow

In supply chains, the purchase orders and material flow are, in general, discrete and intermittent, making many problems difficult to analyze, if not intractable. Continuous models for supply chain management are an important approach to address these challenging problems. Notable examples exist, such as the famous EOQ model and other models in related areas [2,16,17]. These continuous models grasp the essential characteristics of the processes, and they can provide good approximations to discrete cases or serve as a base for developing more complicated or accurate models. Here, we develop a continuous model for the material flow to grasp important factors and obtain essential characteristics of disruption propagation in the supply chain by using system dynamics principles and analogizing material flow to fluid flow in a pipe system.
Unlike flow in a pipe system, the materials in the supply chain are processed and transformed at each stage. In each factory, the raw material/component is processed, converted into a new final product, and then sent to its customers. Different materials have different measurement units, and factories have different consumption/conversion rates. For example, several raw material/component units are needed to produce one unit of the final product [12]. This makes the model more complex.
A model of continuous material flow is shown in Figure 1. The meanings of the symbols are listed in Table 1. The model consists of tiers (factories) and links between tiers. In each factory, the raw materials/components are converted into final products. The final product of tier i serves as the raw material/component for tier i − 1. Each tier has three major parts: raw material warehouse (RW), process (machines producing final product), and final product warehouse (FW). When the production is in the Make-To-Order (MTO) mode, there is no inventory of the final product. In order to have a unified model for both the MTO and MTS (Make-To-Stock) mode, we assume there is a final product warehouse (FW) for MTO, but its inventory level is always 0. In the process (production line), there is a Work-In-Progress (WIP) inventory.
Consider tier i. The raw material and final product warehouse are modeled as two stocks in the system dynamics with unlimited storage capacity. The “process” (converting raw material into the final product) is modeled as a long pipe. The transportation of materials between warehouses and processes are modeled as short pipes, whose length is ignored for simplicity. One critical issue in the material flow is that materials before and after the process are different, and they have different measurement units. To address this, we use the following method to measure the amount of different materials.
We use the normal material flow rate for each material as the benchmark and measurement unit. For example, the final product inventory (in any unit, e.g., kg) is divided by the normal demand per day (e.g., kg/day) to obtain the inventory level in days. Similarly, for both raw material inventory and WIP inventory, we convert the inventory in physical units into inventory in days. In this way, we standardize the unit of measurement across different materials into the same time unit (e.g., days). Moreover, one day’s worth of raw material is converted into one day’s worth of final product. This simplifies the analysis of disruption propagation to treat the material flow in the supply chain as the flow of a single type of material (e.g., water). In normal situations, the material flow rate is 1 as the inventory is converted into a time unit (e.g., days), and material flow is normalized by the normal situations.

5. Characteristics of Disruption Propagation

5.1. Disruption Signal Generation and Profile

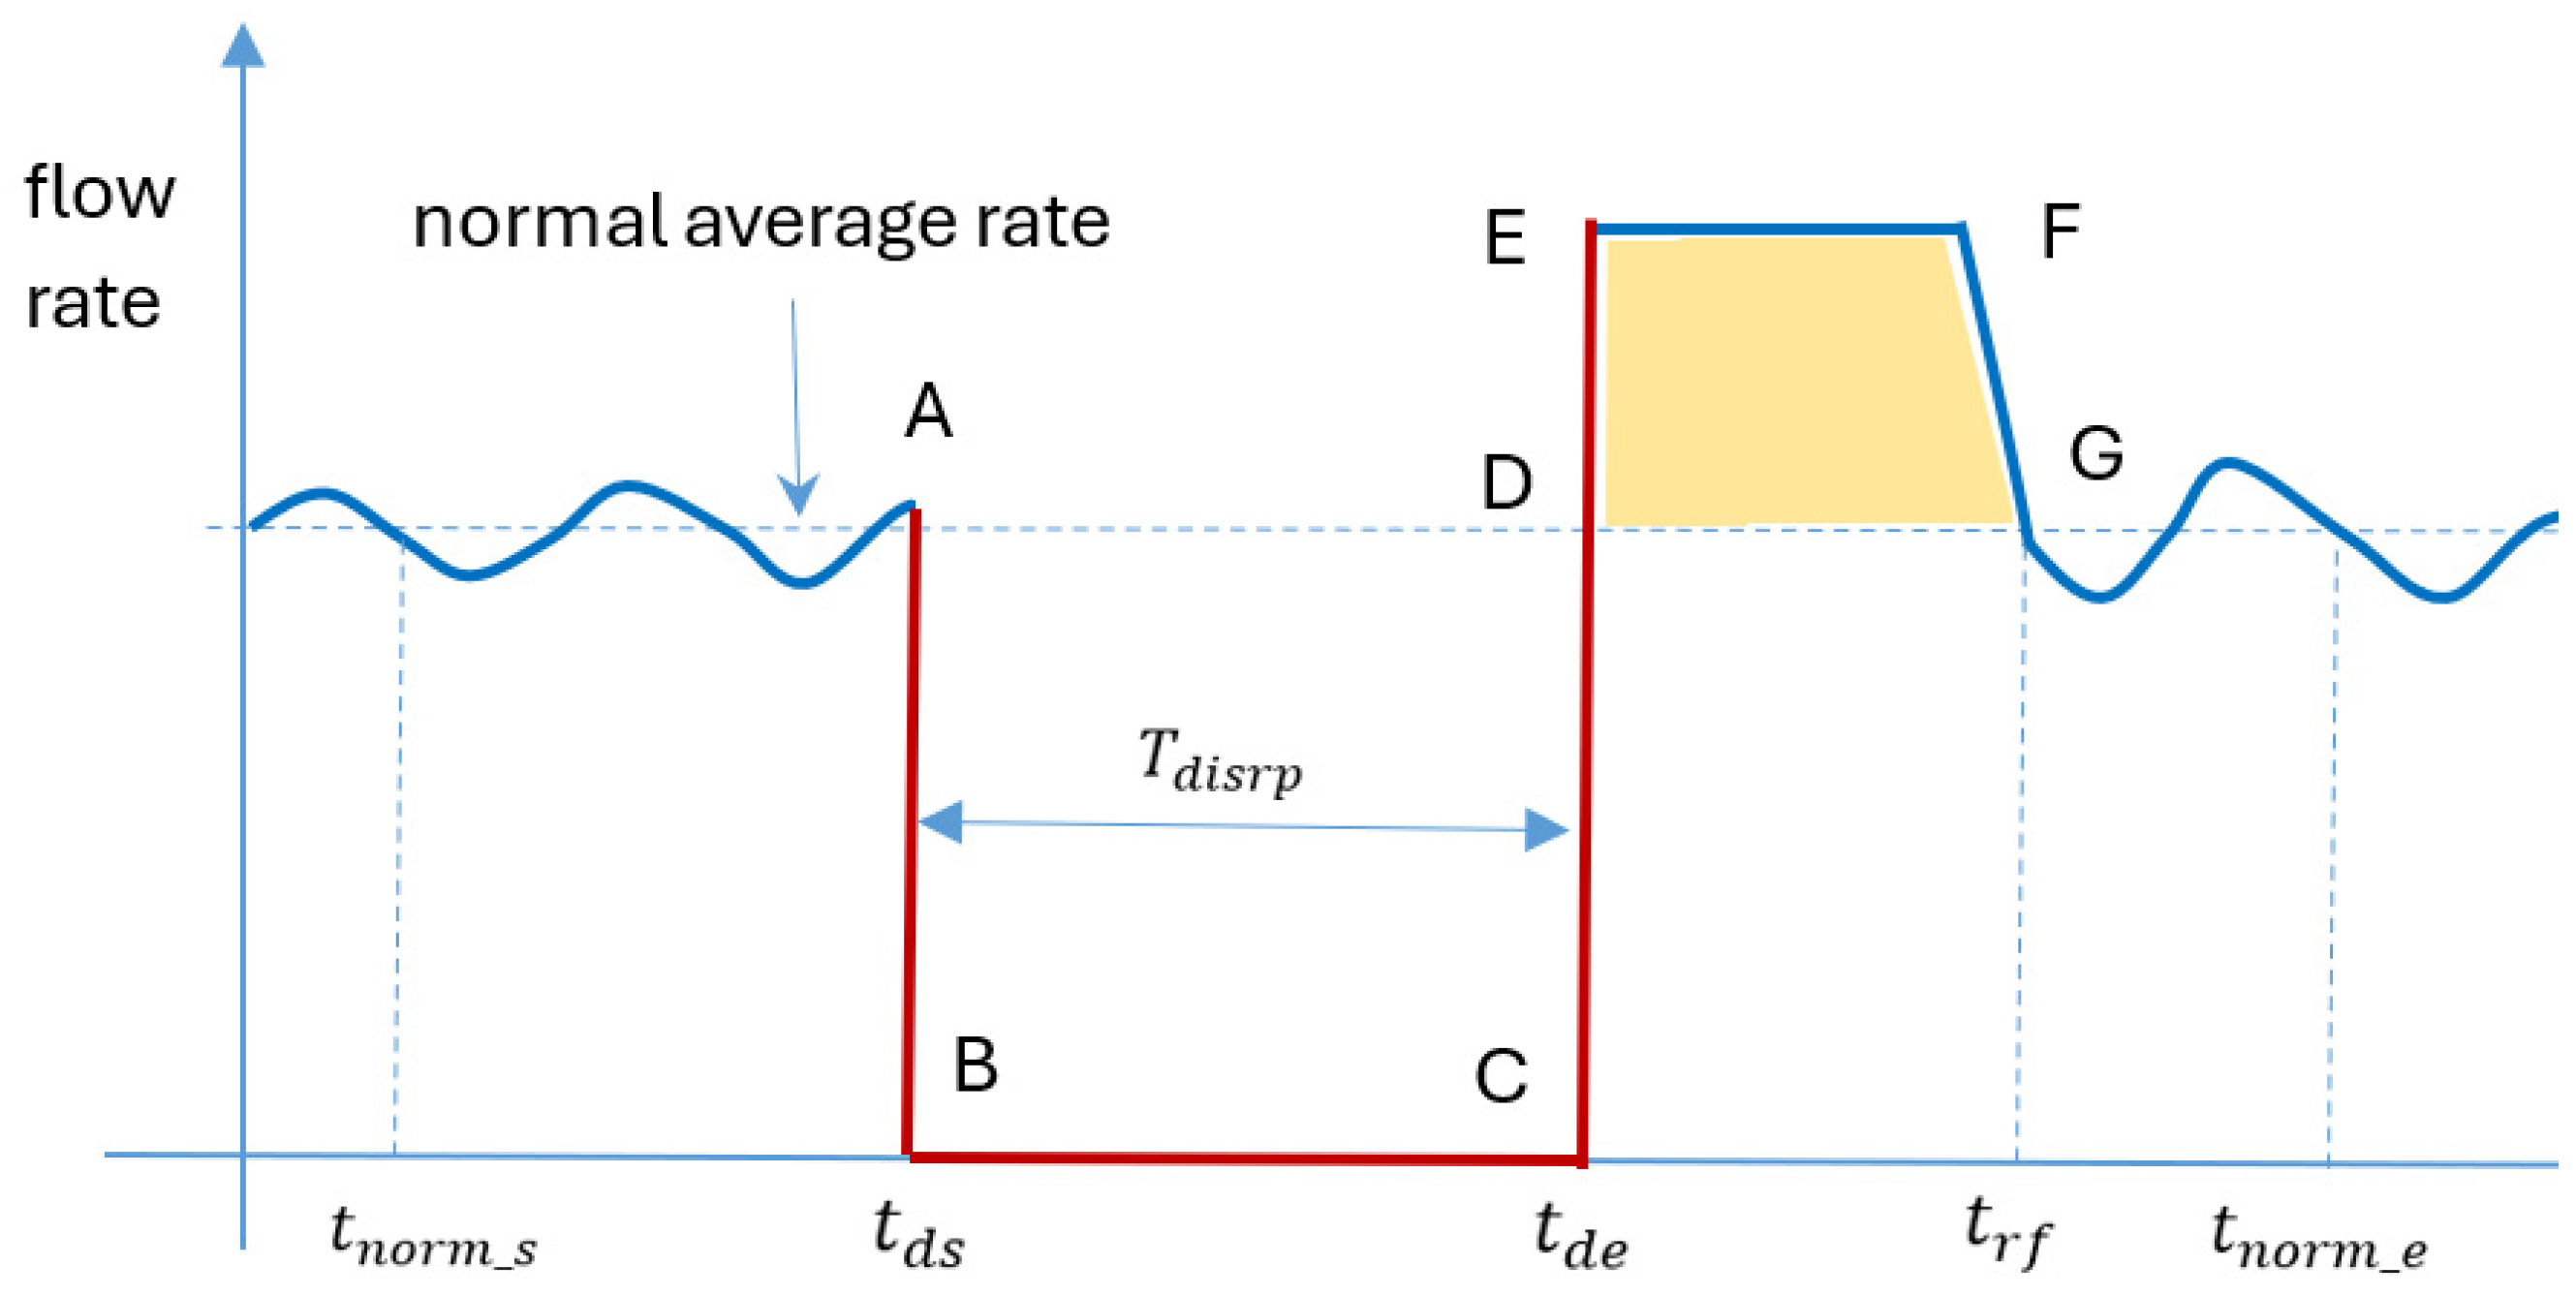
Disruption events (such as earthquakes or floods) cause material flow disruptions, which are classified into production disruption, supply disruption, and transportation disruption. Figure 2 shows an example of the disruption signal for production disruption. In the figure, the material flow disruption start time t d s and end time t d e are shown. After production is recovered, there is a period in which the production level is higher than the normal level to refill inventory or satisfy backorders. This extra production capacity is obtained through overwork or other approaches (e.g., purchasing more/new machines or previous surplus capacity). Following this recovery period, production drops back to a normal level from t r f . The above disruption signal represents many typical cases where most companies do not operate at full capacity for maintenance or demand fluctuations (or demand is less than their existing full production capacity).
The signals for supply disruption and transportation disruption are similar to the one depicted in Figure 2. For brevity, these signals are not plotted.

5.2. Disruption Propagation Across One Tier

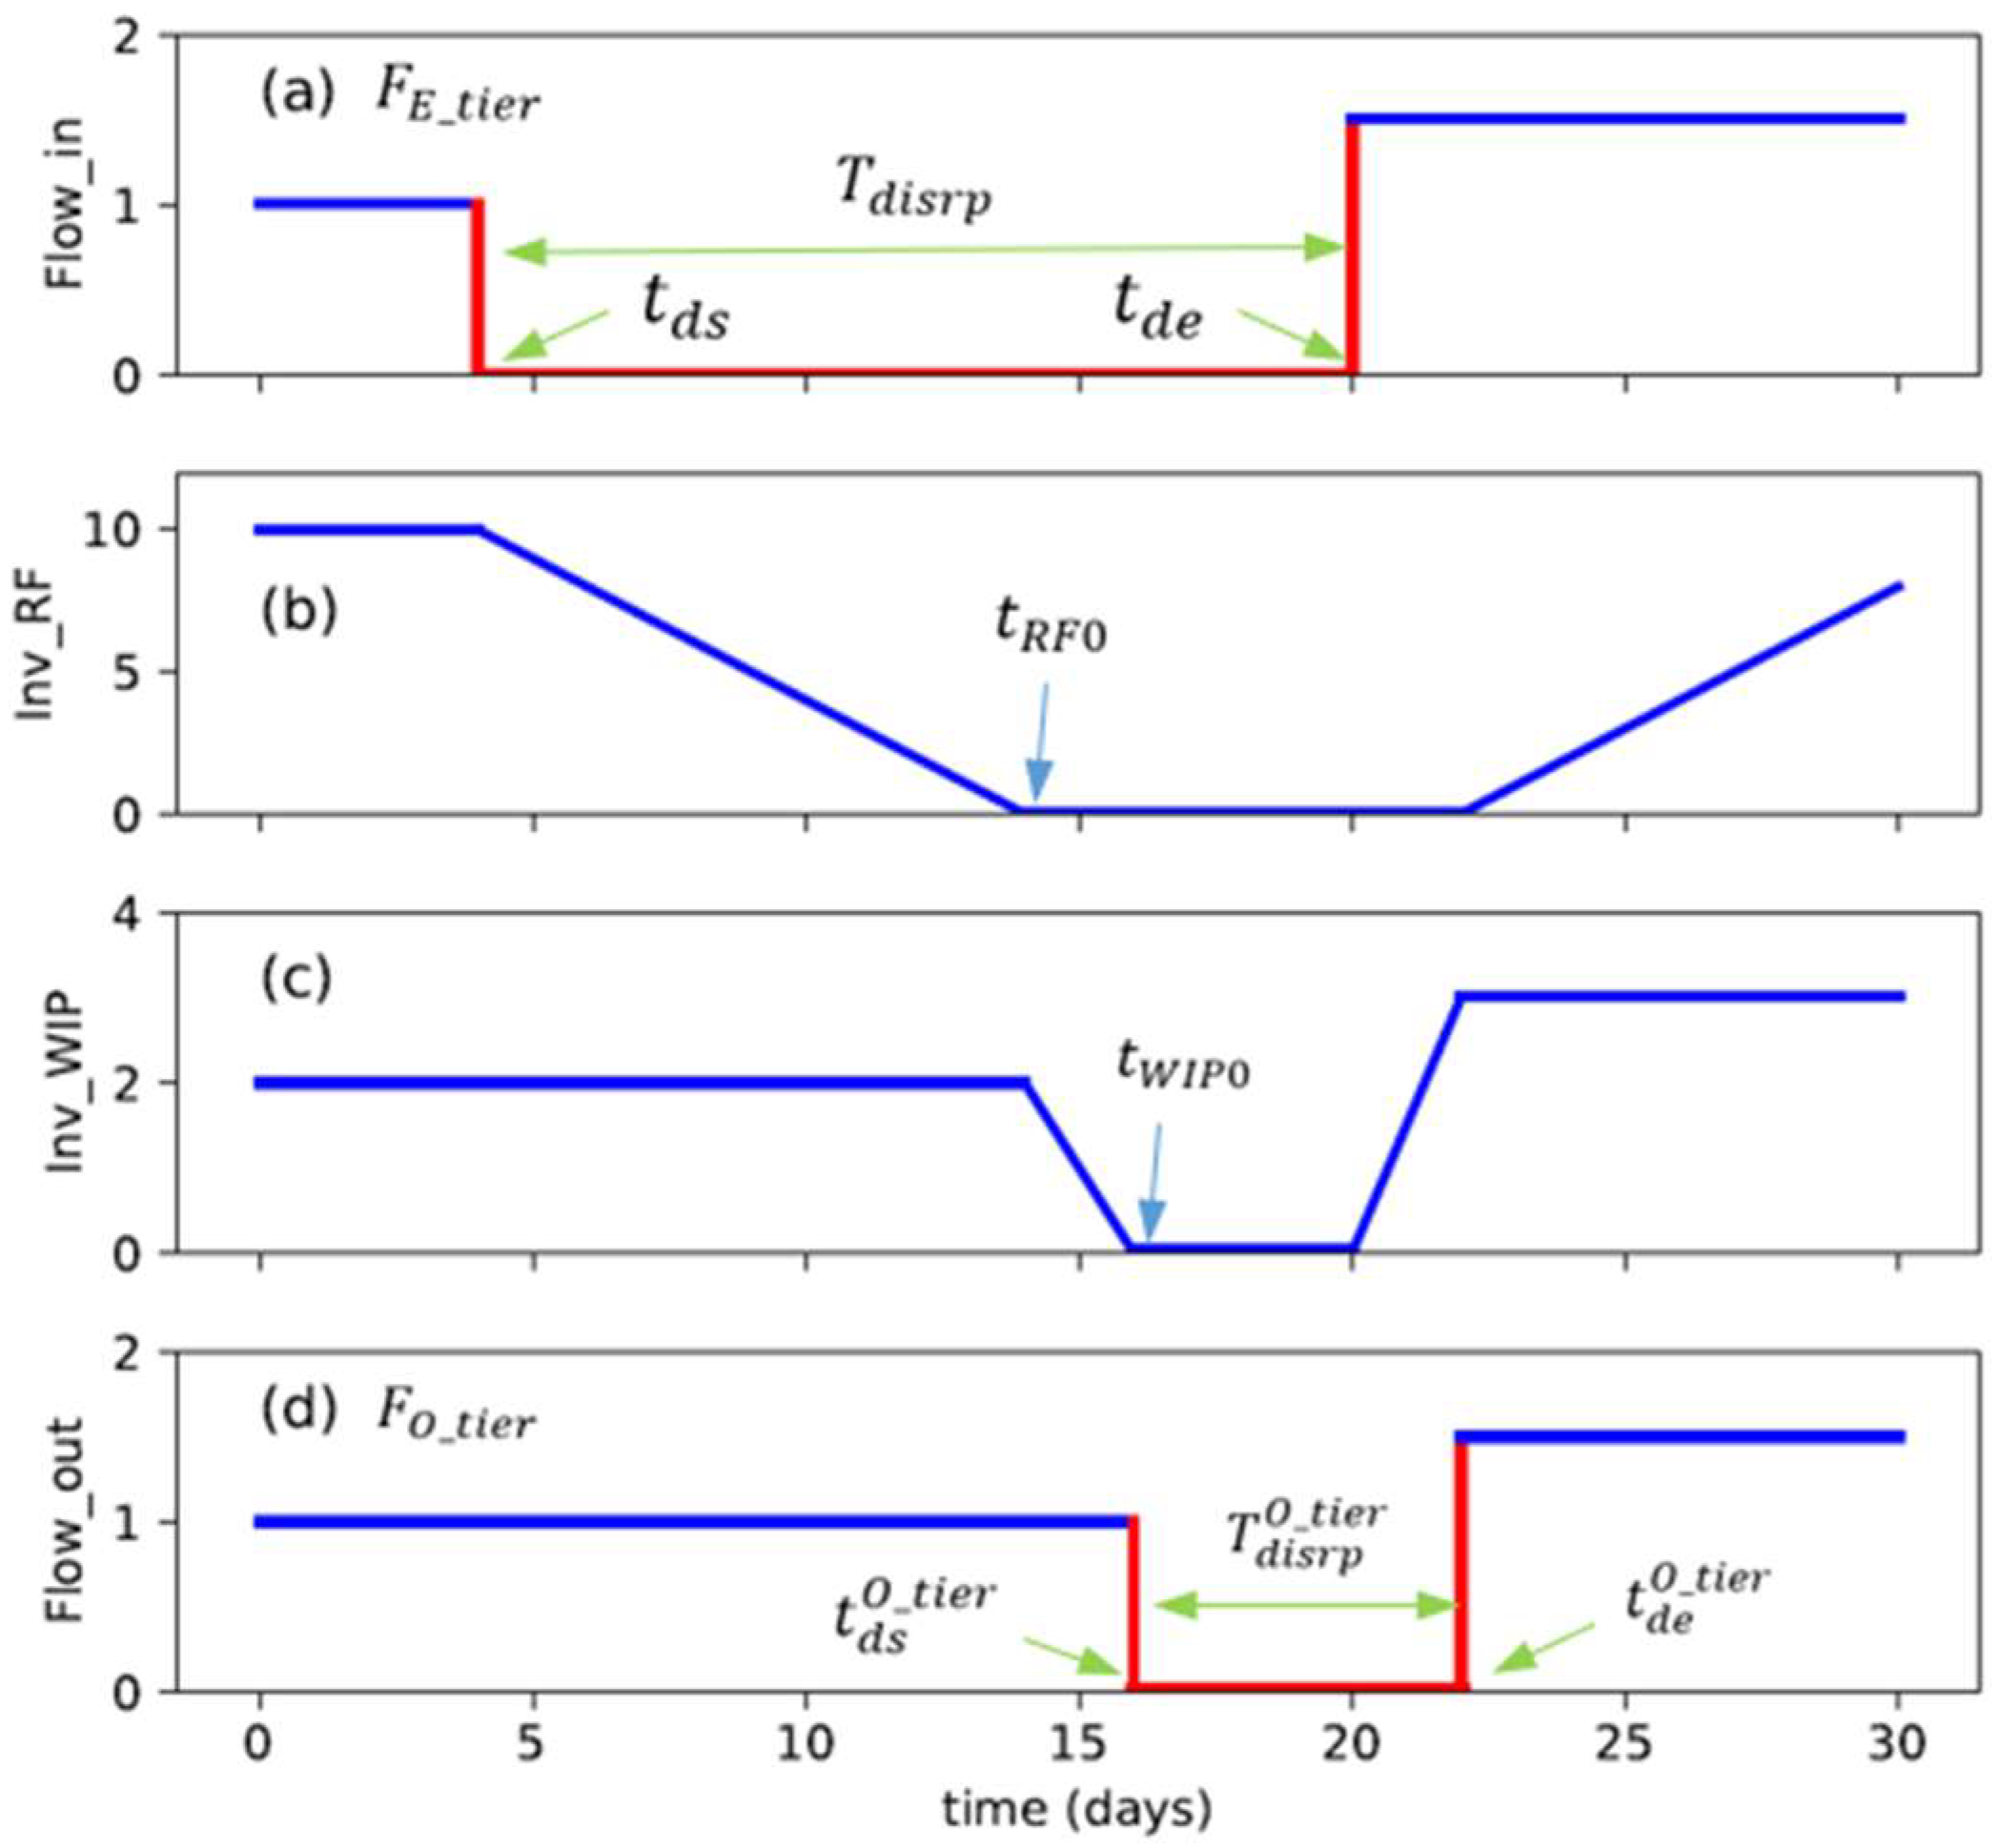
Once we know how disruption propagates across one tier, it is not difficult to extend it to multiple tiers. Now consider tier i, which has a supply disruption (shown in Figure 2); we analyze its response signal, i.e., the output material flow. Figure 3 shows an example of internal inventory variation and how the output material flow signal of the tier is generated. The figure illustrates a case where the supply disruption is long enough to cause an output flow disruption. Figure 3a shows the input material flow at the entry point of the tier, with the duration of disruption denoted as T d i s r p . Since our focus is on the disruption propagation rather than the disruption recovery period, in part (a), we do not show the time (after t d e ) when the input material flow is dropped back to the normal flow rate. Figure 3b illustrates the inventory variation (a sum of raw material RW and final product FW) with time. Figure 3c depicts the WIP inventory on a production line variation. Finally, Figure 3d shows the output material flow at the tier’s exit point.
Before the supply disruption at time t d s , the input material flow into the tier is at the normal level, i.e., the flow rate is 1 by normalization. The inventory levels of the raw material and final product are planned by the inventory management, set as 10 in the example. The WIP inventory is at a normal level, depending on the production process, set as 2 in the example. The output flow from the tier is the same as the input flow, also at the normal level (flow rate 1). Since the disruption occurs at time t d s , the input flow ceases, but the output flow is still ongoing, so the total inventory of raw material and final production decreases with time. We assume the system prioritizes the existing final product inventory to satisfy the demands downstream rather than using newly produced products converted from WIP. At time t R F 0 , the RF inventory I R F drops to 0.
After t R F 0 , the final product inventories and raw material inventories are depleted, and the production line converts the remaining WIP into final products. Hence, the inventory of WIP has decreased over time since t R F 0 . After the T P r o c time unit, all WIP is converted into the final product, and the WIP inventory is reduced to 0. The time is denoted as t W I P 0 . Therefore, t W I P 0 t R F 0 = T P r o c . During the period [ t R F 0 ,   t W I P 0 ], the tier still can provide products to the downstream company, maintaining a normal output flow. Since t W I P 0 , the production has stopped, and there is no output material flow. Hence, the disruption of output flow happens at the exit point of the tier. This time is equal to t W I P 0 .
When the raw material supply is recovered at time t d e , the final product flow cannot resume immediately. It takes T P r o c to convert raw materials into final products. Hence, the output flow disruption end time is t d e + T P r o c . Since time t d e , the raw material supply has been larger than the normal level, and the production level has also become larger than the normal level as a response to the disruption. Therefore, the output flow of the final product has exceeded the normal level since the end time of output flow disruption, as shown in Figure 3d, for the final product flow pattern. The pattern is the same as the raw material flow’s pattern in Figure 3a, differing mainly in disruption start time and duration.
The output flow disruption’s start time, end time, and duration are as follows:
t d s O _ t i e r = t d s + I R F + T P r o c ,
t d e O _ t i e r = t d e + T P r o c ,
T d i s r p O _ t i e r = T d i s r p I R F .
If the supply disruption duration T d i s r p is shorter than I R F , there is no output flow disruption. If there is output flow disruption, its duration is the supply disruption duration reduced by I R F (Equation (3)). This highlights the importance of inventory management.

5.3. Disruption Propagation Along Multiple Tiers

The output flow signal of tier i is fed to its next tier as the input, but there is a time delay due to the transportation time T r i . As the output disruption signal is similar to the input disruption signal (with differing disruption durations), we repeat the above procedure to calculate its output flow signal until we obtain the signal at the focal company.
When there is a raw material supply disruption at the entry point of tier K, how many tiers the supply disruption can propagate downstream, the time when the disruption arrives at the entry point of each tier, and the severity of disruption (duration) are determined.
Let I m = { K ,   K     1 ,   ,   K     m + 1 } be the set of indices of tiers starting from tier K. In I m , there are m tiers, including tier K. Let C I R F m be the Cumulative Inventory (raw material and final product) for the tiers in I m . Thus, the number of tiers that the disruption can propagate (including tier K) is
N p r o p = min m C I R F m T d i s r p K .
For tier i { K 1 , , K N p r o p + 1 } , the input flow disruption start time, end time, and duration are:
t d s i = t d s i + 1 + I R F i + 1 + T P r o c i + 1 + T r i + 1 ,
t d e i = t d e i + 1 + T P r o c i + 1 + T r i + 1 ,
T d i s r p i = T d i s r p i + 1 I R F i + 1 .
For tiers after ( K N p r o p + 1 ) , there is no input/supply disruption.
From the above analysis, we obtain the following insights:
  • Inventory is critical in preventing disruption propagation, and it can work as a buffer to reduce the effect of input flow disruption. It is the inventory of raw materials and final products that plays a critical role. When a disruption propagates through a tier, the duration of disruption is reduced by their combined inventory level (in terms of the time unit). The WIP can delay the start time of disruption for the next tiers, but it does not affect the duration of disruption.
  • The number of tiers that a material flow disruption propagates depends on the sum of inventories of raw material and final product at different tiers from the source of the disruption. As the disruption propagates, it becomes weaker and eventually ceases at the entry point of a certain tier. Therefore, from a focal company’s perspective, it is often unnecessary to look into many tiers upstream.
  • For the MTO supplier of a focal company, its disruptions are more likely to propagate to the focal company than those from MTS suppliers. This is because the MTO supplier has no final product inventory and, thus, typically has less total inventory than MTS suppliers. Therefore, when we develop a monitoring system for disruption, if many upstream tiers are of MTO tiers, we may need to monitor more upstream tiers compared to the case in which many upstream tiers are of MTS tiers.
  • From the mechanism of disruption propagation, we can estimate the scale of disruption that should be monitored at each tier and establish appropriate thresholds. Based on the formula of propagation, we can derive which scale (threshold) of disruption at each tier will be able to propagate to the focal company. Therefore, if the disruption happening at a given tier is less than its corresponding threshold, the focal company does not need to monitor this disruption. The larger the tier number of suppliers, the larger the threshold. This is useful for developing an effective disruption monitoring system. Nevertheless, in setting such thresholds, other factors, such as the uncertainties, must be considered in upstream parameter estimations and the risk level that the focal company can afford.
  • The time is estimated when a disruption at a certain upstream tier is propagated to the focal company. From this time, the focal company knows how much time it has to adopt mitigation plans or implement response measures.

5.4. Stochastic Parameters

Using Equations (1)–(7), we can calculate the time when the initial disruption reaches a focal company and its severity with the values of all parameters at each tier. However, the upper tiers’ parameters, such as inventory, are not available to the focal company, and the focal company can only infer the range based on domain knowledge and common practice in the industry. Therefore, the above analysis is applied to the cases where the parameters are modeled as random variables to incorporate the uncertainties.
It is required to estimate the following parameters for each tier: inventory levels for raw material and final product, processing time, and transportation time to the next tier. The transportation time is stable and easier to estimate, and thus, it is set as a constant. The processing time depends on the process characteristics, which may be similar for different companies having the same process. Hence, we may set it as a constant, too.
The inventory level varies significantly. It depends on the inventory management policy and the time when the initial disruption happens. Consider tier i. Let p R F i ( x ) be the probability density function of the inventory level (raw material and final product), and the inventory level is in the range [ 0 ,   U I _ R F i ]. We set the lower threshold of the inventory level as 0 to be generic. If the inventory level of the company is unlikely to be lower than a certain threshold L, the inventory probability could be set close to 0 for inventory levels within the range [0, L].
In the initial disruption signal, the start time of the disruption is a fixed known value, and its duration is estimated as a random variable. When the disruption propagates downstream to a certain tier, both the start time and duration of the supply disruption are uncertain. The supply disruption of tier i is defined by the start time t d s i and the disruption duration T d i s r p i . The disruption duration at all tiers is in the range of [ 0 ,   U d i s r p ], and t d s i is in the range [ L d s i , U d s i ]. Let p d s i ( t ) be the probability density distribution for the start time t d s i of the supply disruption, p d i s r p i ( t ) be the probability density distribution of its duration T d i s r p i , and F d i s r p i t = P ( T d i s r p i t t ) be the accumulative. The supply disruption at the entry of tier i + 1 does not pass through the tier when the inventory (including raw material and final product) I R F i + 1 of tier i + 1 is more than the disruption period T d i s r p i + 1 , i.e.,
p d i s r p i T d i s r p i = 0 = 0 U d i s r p p R F i + 1 t · F d i s r p i + 1 t d t .
The probability that T d i s r p i = x   ( x > 0 ) is the probability that the disruption period is x longer than the inventory level, i.e.,
p d i s r p i T d i s r p i = x = 0 U d i s r p p R F i + 1 t x p d i s r p i + 1 t d t .
From Equations (8) and (9), we obtain the probability function of disruption duration for the supply disruption signal at tier i.
Now consider the disruption start time at the entry point of tier i. When there is no disruption, we do not need to consider the start time. When there is a disruption, from Equation (5) and the bounds of t d s i + 1 , the disruption start time t d s i is in the range: R i = [ L d s i + 1 + T P r o c i + 1 + T r i + 1 , U d s i + 1 + T P r o c i + 1 + T r i + 1 + U I _ R F i + 1 ] . So, when x R i , the probability of the disruption start time t d s i is
p d s i t d s i = x = L d s i + 1 x T P r o c i + 1 T r i + 1 p d s i + 1 t p R F i + 1 x t d t ,   x R i
otherwise, the probability is 0.
From Equations (8)–(10), the probability distributions for the disruption start time and duration are obtained when the supply disruption propagates through one tier. Continuing the above process, all distributions at all tiers are obtained. Moreover, from these distributions, it is straightforward to calculate the mean value and standard deviation of these distributions and assess the risks at each tier.

6. Numerical Example

We use an example to illustrate the calculation of disruption propagation. In this example, the materials are produced on an MTO basis. The production period at each tier ranges from 3 to 6 days. All the parameters of each tier, the initial disruption signal, and the propagation details are shown in Table 2. The values italicized are the calculated ones.
The columns t d s and t d e are for the disruption start time and end time at the entry point of each tier. The initial supply disruption of tier K starts at time 0 and ends at time 30. The initial disruption of tier K propagates to the entry point of tier K − 1 at time 24 and ends at time 39. The disruption duration at tier K − 1 is reduced from the initial 30 units (days) to 15 units. The supply disruption at tier K − 1 does not propagate further. Therefore, at the entry point of tier K − 2, there is no supply disruption.

7. Conclusions

We study the disruption propagation mechanism in multiple-tier supply chains. A continuous material flow model with production and inventory details based on system dynamics principles is developed for a supply chain. The characteristics of disruption propagation are obtained and discussed using the model. Closed-form expressions are derived to calculate the time when the disruption propagates to the next tier, the disruption duration, and the condition under which the disruption is not propagated further. The total inventory of raw materials and final products is critical to prevent supply disruption from propagating to the subsequent tiers. We also extend the model to the cases with stochastic parameters to incorporate the uncertainty. This study provides valuable managemental insights for monitoring disruption events upstream and managing the disruption effects. The results are also useful in designing a resilient and robust supply chain.
The material flow model serves as a foundation for future research. First, although the continuous model captures the essential properties of material flow, the calculation of disruption propagation time and severity may not accurately reflect the discrete nature of material flow between companies. Therefore, it may be necessary to develop correction mechanisms based on the continuous model to account for practical considerations. Second, it is necessary to develop models for disruption recovery based on similar principles and methods. Finally, the scenarios where the companies actively adopt measures in response to disruption events must be constructed.

Author Contributions

Conceptualization, S.L., S.X. and L.W.; methodology and mathematical model, S.L.; validation and analysis, S.X. and L.W.; writing—original draft preparation, S.L.; writing—review and editing, S.X. and L.W.; funding acquisition, S.X. and S.L. All authors have read and agreed to the published version of the manuscript.

Funding

This research was supported by The Agency for Science, Technology and Research (A*STAR) Singapore under A*STAR—MiRXES Agile Diagnostics Manufacturing Joint Lab (Grant No.: I2301E0017).

Institutional Review Board Statement

Not applicable.

Informed Consent Statement

Not applicable.

Data Availability Statement

Example data are provided in this paper.

Acknowledgments

We extend our sincere thanks to Timothy KWANG and D. Puvaneswari Dhanaraj from MiRXES for their invaluable domain expertise and insightful feedback, which helped to shape our research focus. We also express deep appreciation to Ning Liu, Wenda Chen, and Junjie Cai from Advanced Remanufacturing and Technology Centre (ARTC), A*STAR, for their valuable discussions, collaboration, and strong support of this project. Finally, we would like to thank the anonymous reviewers and the editor for their thoughtful efforts in improving this manuscript.

Conflicts of Interest

The authors declare no conflict of interest. The funders had no role in the design of this study; in the collection, analyses, or interpretation of data; in the writing of this manuscript; or in the decision to publish the results.

References

  1. Qin, R.; Khakzad, N.; Zhu, J. An overview of the impact of hurricane harvey on chemical and process facilities in Texas. Int. J. Disaster Risk Reduct. 2020, 45, 101453. [Google Scholar] [CrossRef]
  2. Sokolov, B.; Ivanov, D.; Dolgui, A. The ripple effect in supply chains: Trade of efficiency-flexibility-resilience in disruption management. Int. J. Prod. Res. 2014, 52, 2154–2172. [Google Scholar]
  3. Hosseini, S.; Ivanov, D. Bayesian networks for supply chain risk, resilience and ripple effect analysis: A literature review. Expert Syst. Appl. 2020, 161, 113649. [Google Scholar] [CrossRef] [PubMed]
  4. Hosseini, S.; Ivanov, D.; Dolgui, A. Ripple effect modelling of supplier disruption: Integrated Markov chain and dynamic Bayesian network approach. Int. J. Prod. Res. 2020, 58, 3284–3303. [Google Scholar] [CrossRef]
  5. Ivanov, D.A.; Dolgui, A.; Sokolov, B.V.; Ivanov, M. Literature review on disruption recovery in the supply chain. Int. J. Prod. Res. 2017, 55, 6158–6174. [Google Scholar] [CrossRef]
  6. Rinaldi, M.; Murino, T.; Gebennini, E.; Morea, D.; Bottani, E. A literature review on quantitative models for supply chain risk management: Can they be applied to pandemic disruptions? Comput. Ind. Eng. 2022, 170, 108329. [Google Scholar] [CrossRef] [PubMed]
  7. Katsaliaki, K.; Galetsi, P.; Kumar, S. Supply chain disruptions and resilience: A major review and future research agenda. Ann. Oper. Res. 2022, 319, 965–1002. [Google Scholar] [CrossRef] [PubMed]
  8. Yu, H.; Zeng, A.Z.; Zhao, L. Single or dual sourcing: Decision-making in the presence of supply chain disruption risks. Omega 2009, 37, 788–800. [Google Scholar] [CrossRef]
  9. Xu, H.-Y.; Fu, X.; Ponnambalam, L.; Namatame, A.; Yin, X.F.; Goh, R.S.M. A model to evaluate risk propagation considering effect of dynamic risk information sharing and multi-sourcing in supply chain networks. In Proceedings of the 2015 IEEE International Conference on Industrial Engineering and Engineering Management (IEEM), Singapore, 6–9 December 2015; pp. 1593–1597. [Google Scholar]
  10. Wilson, M.C. The impact of transportation disruptions on supply chain performance. Transp. Res. Part E Logist. Transp. Rev. 2007, 43, 295–320. [Google Scholar] [CrossRef]
  11. Schmitt, A.J.; Singh, M. A quantitative analysis of disruption risk in a multi-echelon supply chain. Int. J. Prod. Econ. 2012, 139, 22–32. [Google Scholar] [CrossRef]
  12. Tan, P.S.; Lee, S.G.; Tan, C.S. Modeling disruption propagation in a complex supply chain. In Proceedings of the 2016 IEEE International Conference on Industrial Engineering and Engineering Management (IEEM), Bali, Indonesia, 4–7 December 2016; pp. 154–158. [Google Scholar]
  13. Liu, R.; Kumar, A.; van der Aalst, W. A formal modeling approach for supply chain event management. Decis. Support Syst. 2007, 43, 761–778. [Google Scholar] [CrossRef]
  14. Blackhurst, J.; Wu, T.; Ogrady, P. Methodology for supply chain disruption analysis. Int. J. Prod. Res. 2007, 45, 1665–1682. [Google Scholar]
  15. Zegordi, S.H.; Davarzani, H. Developing a supply chain disruption analysis model: Application of colored petri-nets. Expert Syst. Appl. 2012, 39, 2102–2111. [Google Scholar] [CrossRef]
  16. Liu, S.; Song, M.; Tan, K.C.; Zhang, C. Multiclass dynamic inventory rationing with stochastic demands and backordering. Eur. J. Oper. Res. 2015, 244, 153–163. [Google Scholar] [CrossRef]
  17. Liu, S.; Zhang, C. An efficient inventory rationing strategy for systems with two demand classes and backordering. Int. J. Prod. Res. 2015, 53, 6136–6142. [Google Scholar] [CrossRef]
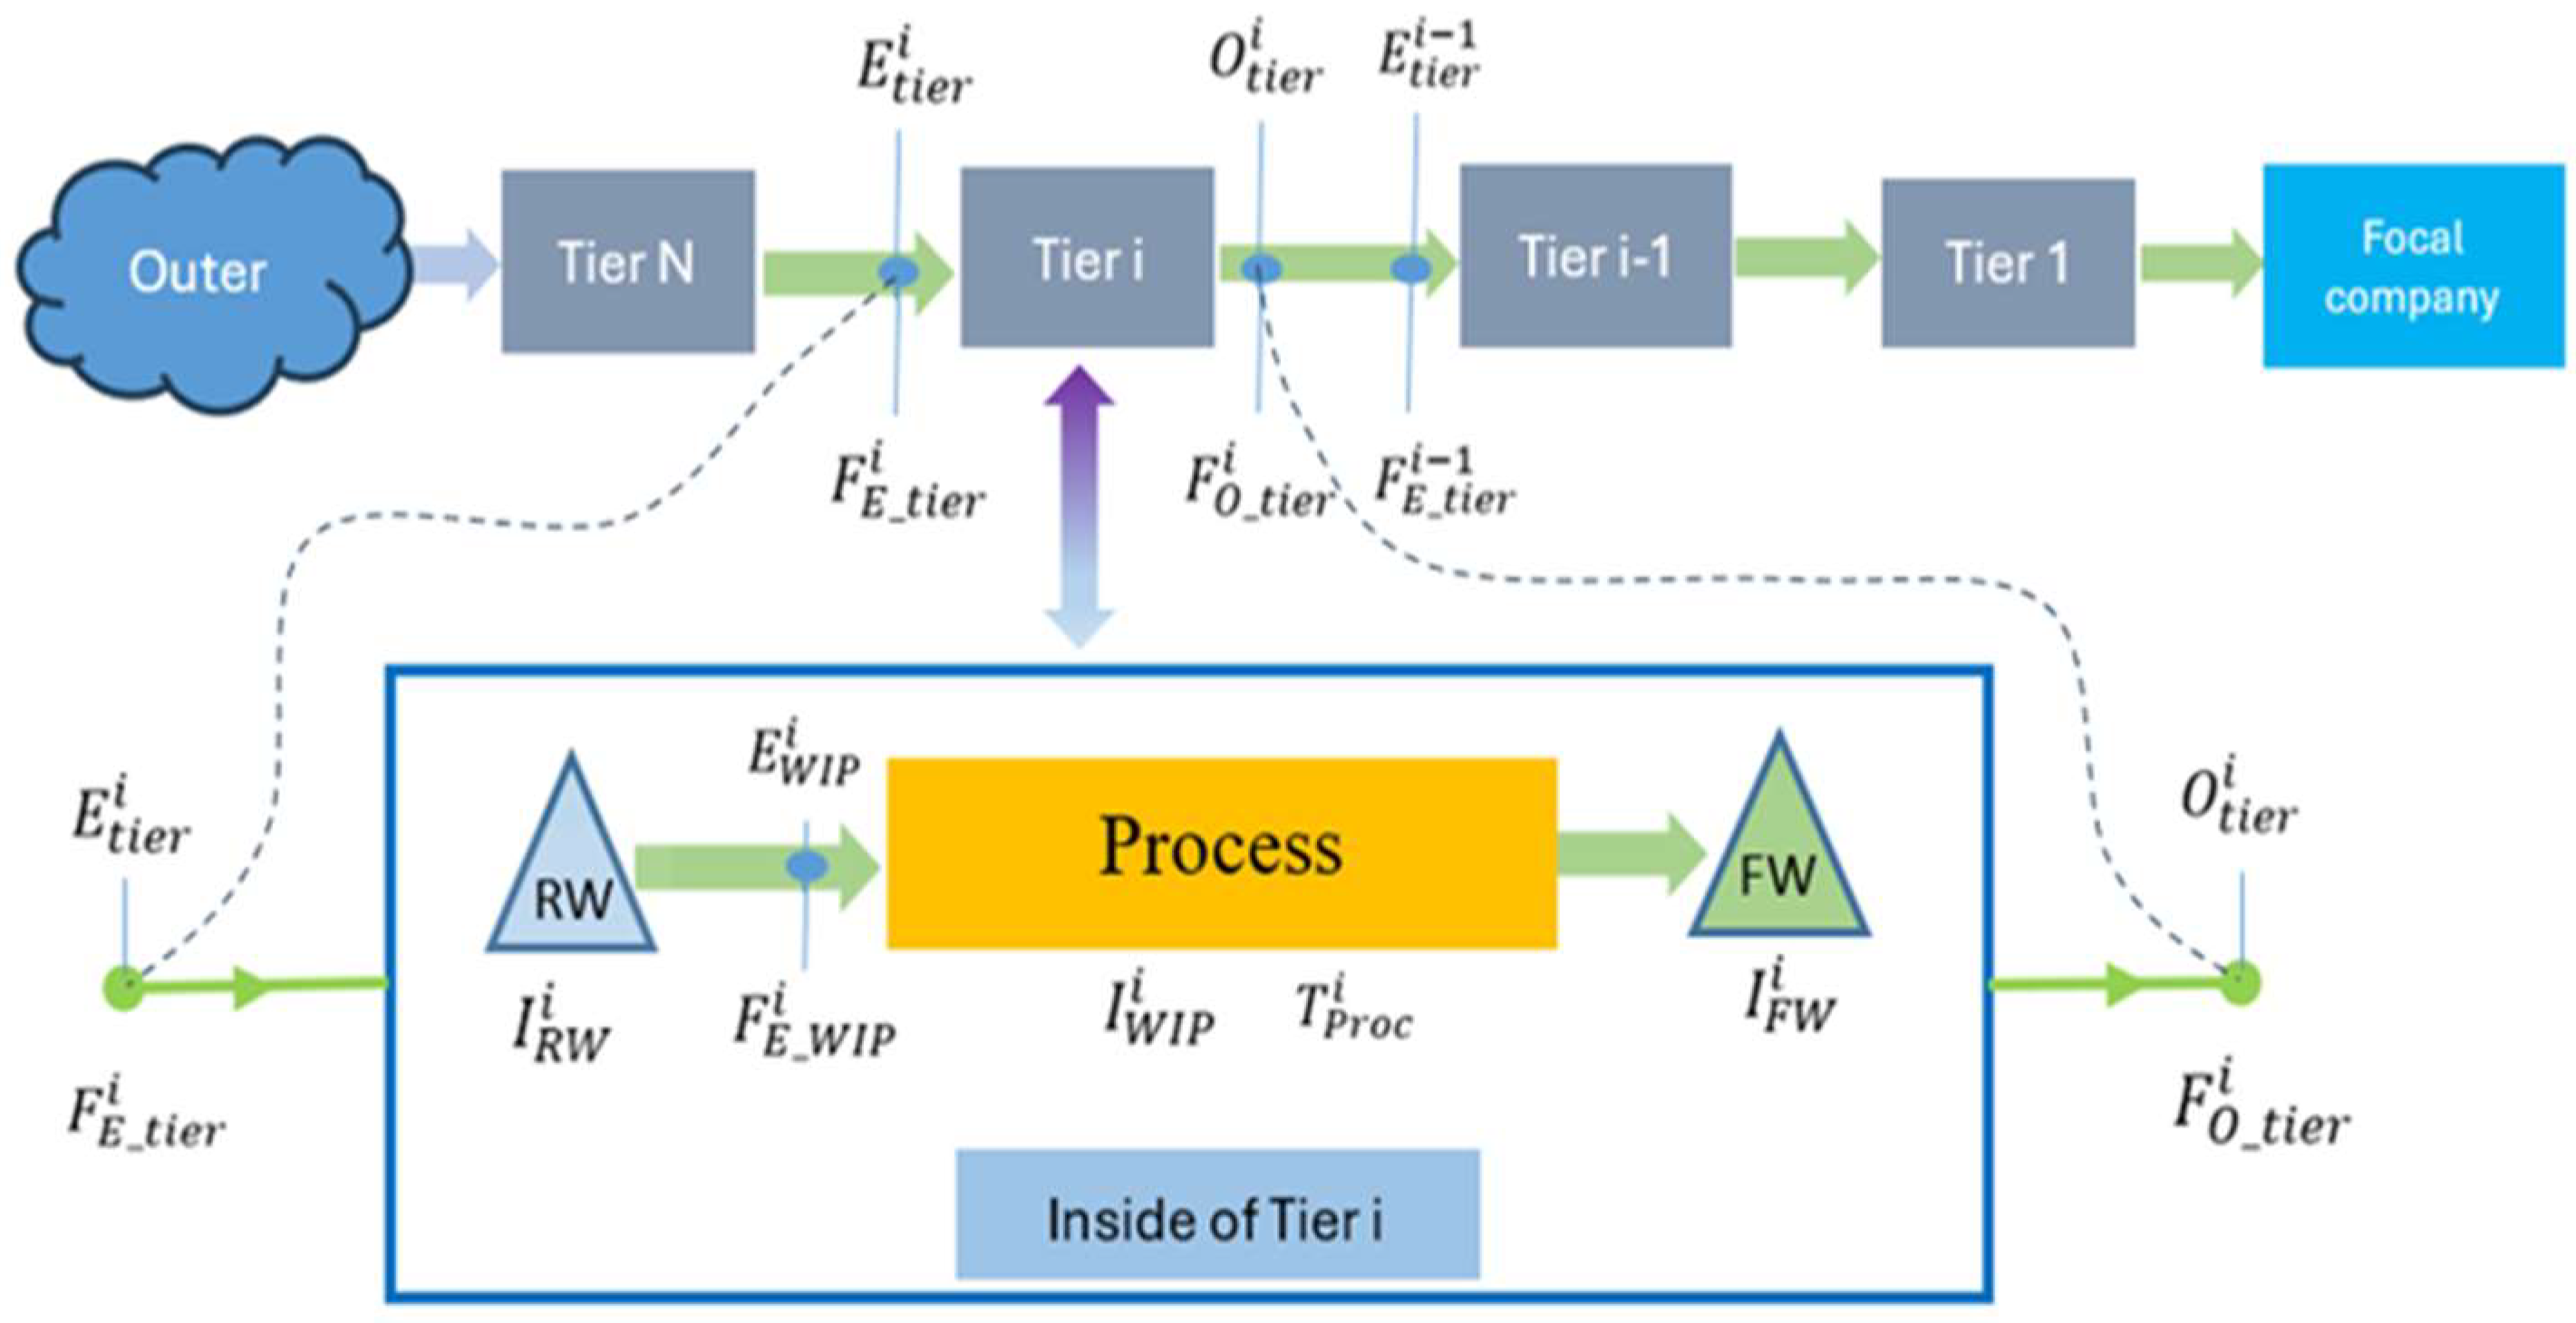
Figure 1. Material flow for one type of raw material of the focal company.
Engproc 89 00001 g001
Figure 2. An example of typical disruption signals.
Engproc 89 00001 g002
Figure 3. Disruption propagation across one tier.
Engproc 89 00001 g003
Table 1. Symbols in the model.
SymbolMeaning
E t i e r i ,   O t i e r i material flow entry point (location) and output point (location) of tier i, respectively
F E _ t i e r i ,   F O _ t i e r i material flow rate entering and leaving tier i, respectively
I R W i ,   I F W i ,   I W I P i inventory level for raw material, final product, and work in progress, respectively
T P r o c i process time converting raw material into products
I R F i total inventory of raw material and final product at tier i
T r i transportation time between tiers i and i − 1
T d i s r p duration of disruption
Table 2. An example of calculating disruption propagation.
Tier I R F T P r o c T r t d s t d e T d i s r p
K155403030
K − 11862243915
K − 21032------0
Disclaimer/Publisher’s Note: The statements, opinions and data contained in all publications are solely those of the individual author(s) and contributor(s) and not of MDPI and/or the editor(s). MDPI and/or the editor(s) disclaim responsibility for any injury to people or property resulting from any ideas, methods, instructions or products referred to in the content.