Proceeding Paper

Multipath Characterization of GNSS Ground Stations Using RINEX Observations and Machine Learning †

by
Gerardo Allende-Alba
*,
Stefano Caizzone
and
Ernest Ofosu Addo
Institute of Communications and Navigation, German Aerospace Center (DLR), 82234 Wessling, Germany
*
Author to whom correspondence should be addressed.
Presented at the European Navigation Conference 2024, Noordwijk, The Netherlands, 22–24 May 2024.
Eng. Proc. 2025, 88(1), 72; https://doi.org/10.3390/engproc2025088072
Published: 22 August 2025
(This article belongs to the Proceedings of European Navigation Conference 2024)

Abstract

Multipath is one of the most challenging factors to model and/or characterize in the GNSS observation error budget. In the case of ground stations, code phase static multipath is typically the largest contributor of local observation errors. Current approaches for multipath characterization include the analysis of code-minus-carrier (CMC) observables and the exploitation of multipath repeatability. This contribution presents an alternative strategy for multipath detection and characterization based on unsupervised and self-supervised machine learning methods. The proposed strategy makes use of observations in the Receiver Independent Exchange Format (RINEX), typically generated by GNSS receivers in ground stations, for model training and testing, without requiring the availability of labeled data. To assess the performance of the proposed strategy (data-based), a comparison with a model-based methodology for multipath error prediction using a digital twin model is carried out. Results from a test case using data from a monitoring station of the International GNSS Service (IGS) show a point of consistency between the two approaches. The proposed methodology is applicable for a similar characterization in any GNSS ground station.

1. Introduction

Applications like autonomous cars and unmanned air vehicles require GNSS services with high reliability and integrity [1,2]. In this context, monitoring tasks for modeling and detection of errors and threats in GNSS signals are of key importance [2,3]. Monitoring schemes can be, in principle, dedicated to the analysis of both local factors and system-level aspects, such as errors due to satellite malfunctions [4,5,6]. However, in certain scenarios, it is not possible to trivially split the contributions from local and system-based effects. This is particularly important for ground stations that integrate GNSS performance monitoring schemes [7]. For a proper characterization of errors stemming at the signal generation and transmission chain, local observation errors, such as multipath, need to be first identified and characterized [8].
Multipath is one of the most challenging factors to model and/or characterize in the GNSS observation error budget [9,10]. In this context, multipath refers to a situation in which the signal from a given satellite arrives at the receiver through multiple paths due to reflection and diffraction. The presence of these non-direct-path signals causes distortion of the received signal, leading to errors in the code and carrier phase measurements [10]. Currently, aside from mitigation strategies based on the use of special antennas and receiver processing techniques [10,11,12], there exist several approaches for the characterization and detection of (high) multipath errors for static cases. These include the analysis of code-minus-carrier (CMC) combinations and the exploitation of multipath repeatability (for GPS) [10].
This contribution presents an alternative strategy for multipath characterization based on unsupervised and self-supervised machine learning methods. In contrast to previous approaches that have employed receiver correlator outputs as input data [13] and utilized machine learning [14,15,16], the proposed strategy uses observations in the Receiver Independent Exchange Format (RINEX) [17], which are obtained from common GNSS receivers. Similarly, unlike the related approach for multipath modeling in the spatial domain recently developed by [18], the presented scheme does not require the availability or generation of labeled data or target vectors.
This paper starts with a description of the data processing strategy for feature computation in Section 2. Then, in Section 3, the approach for training data selection is presented, followed by a brief introduction to the employed machine learning methods and the results of the model training and validation steps. Section 4 provides a brief introduction to the method for multipath characterization using a digital twin model, which is used for the assessment and discussion of results in Section 5 using data from a station of the International GNSS Service (IGS).

2. Data Processing and Feature Computation

In the presented scheme, the considered features for model training and testing are based on CMC combinations and C/N0 observations. This section provides a description of the data pre-processing strategy, as well as the methodology for feature selection and computation.

2.1. Data Pre-Processing

For the computation of features, dual-frequency observations are pre-processed sequentially for each satellite under consideration in a pass-by-pass basis for the considered data set. In a first step, CMC combinations for frequency bands  A  and  B  are formed at each epoch  t  with the available pseudorange  P A s t  and carrier phase  Φ B s t  observations from satellite  s , as follows:
M A s t = P A s t Φ A s t 2 k Δ Φ A B ( t ) M B s t = P B s t Φ B s t 2 k Δ Φ A B ( t )
where  k = f B 2 f A 2 f B 2  and  Δ Φ A B  denotes the difference between the carrier phase observations of frequency bands  A  and  B . In this strategy, satellite passes are defined in terms of carrier phase cycle slips, detected using the Melbourne–Wübbena combination [9].
Similarly to the approaches of [19,20], C/N0 observations in frequency bands  A  or  B  at each epoch  t  are modeled as follows:
K A , B s t = κ A , B s t + μ A , B s t + b s t + ϵ A , B s ( t ) ,
where  κ A , B s t  represents nominal C/N0 values, and  μ A , B s t  denotes measurement errors due to multipath, whereas  b s t  and  ϵ A , B s ( t )  denote any bias caused by signal spreading (e.g., non-line of sight signal reception) and residual measurement errors (e.g., thermal noise), respectively. For scenarios of line-of-sight reception only, the term  b s t  can be ignored from Equation (2). On the other hand, nominal C/N0 values are defined based on the assumption that, in an ideal environment (i.e., multipath-free and symmetric gain patterns of transmit and receive antennas), they follow an elevation-dependent function  κ A , B s t = F A , B ( θ s )  [20]. Based on these assumptions, in a second pre-processing step, for each identified satellite pass, the set of C/N0 observations  K A s t  and  K B s t  for each frequency band is used to fit (in a least-squares sense) nominal functions  F A ( θ s )  and  F B ( θ s )  with a polynomial of third order, to obtain estimates of nominal C/N0 values  κ ^ A s t  and  κ ^ B s t .

2.2. Feature Computation

With a satellite pass-based data arrangement, the pre-processed observations are used to compute features to build up training and testing vectors. For each pass of satellite  s , debiased code multipath combinations  M ˇ A , B s t  in frequency bands  A  or  B  at each epoch  t  are computed as follows:
M ˇ A , B s t = M A , B s t M ¯ A , B s ,
where  M ¯ A , B s  denotes the mean values of code multipath combinations in each frequency band for the satellite pass under analysis. Likewise, detrended C/N0 observations  K ˇ A , B s t  are computed as follows:
K ˇ A , B s t = K A , B s t κ ^ A , B s
in frequency bands  A  or  B . In this way, data points are defined for all satellites and epochs under analysis in terms of the features given by Equations (3) and (4).

3. Machine Learning Methods and Model Training

This section provides a description of the criteria for the selection of training data and the employed machine learning methods.

3.1. Training Data Selection

Producing accurate labeled data to use in supervised learning methods for multipath detection in GNSS observations typically requires a dedicated strategy that increases the complexity of the overall methodology for both static and dynamic scenarios [16,18]. In this study, we evaluate the performance of unsupervised and self-supervised learning methods, which do not require labels and can train models directly from the available data. The key idea of the presented methodology is to train a model using data of one class (i.e., nominal or low-multipath) so that it can be used to detect data points belonging to another class (i.e., changing or severe multipath).
Thus, for the formation of training vectors  X = X 1 , , X I T  of features  X i = [ M ˇ A t , M ˇ B t , K ˇ A t , K ˇ B t ]  with  t T 0 , using the observations of satellite  s  with the elevation angle  θ s  from training period  T 0 , the following condition is evaluated:
D X i ( θ s ) = θ s Θ M ,
where  Θ M  is a predefined threshold. If  D X i ( θ s )  is true, the features  X i  are included in the training set. This condition assumes that observations above a certain elevation are less affected by severe multipath. The selection of  Θ M  is based on the scenario under analysis.
Figure 1 depicts the correlation plots for the selected features for an instance training set of 10 days using a dual-constellation (GPS + Galileo) configuration collected at the IGS station OBE4. For the selection of the training set, a threshold of  Θ M = 45 °  was used. The diagonal plots show one-dimensional histograms, whereas the off-diagonal plots depict the relations among features as scatter plots and two-dimensional histograms. As can be seen in the one-dimensional histograms, all variables have a distribution close to normal, with apparent slightly larger deviations for the cases of dC/N0_A and dC/N0_B. Similarly, all variables exhibit low correlations among them, with Pearson coefficients below 0.3, except for dC/N0_B, dC/N0_A and MP_B, for which values around 0.6 were obtained.

3.2. Machine Learning Methods

From the perspective of the problem description provided in Section 3.1, a selection of machine learning methods for training generative models is suitable. Given the dimensionality and structure of the problem and the data characteristics, three representative methods were selected: two classical machine learning methods for explicit density estimation using non-parametric (Kernel Density Estimation, KDE [21,22]) and parametric modeling (Bayesian Gaussian Mixture Model, BGMM [23,24,25]), as well as a deep learning method for explicit approximate density estimation (Variational Autoencoder, VAE [26,27]).

3.3. Model Training and Validation

To evaluate the performance of the methods described in Section 3.2 for model training for multipath characterization, this study employed GPS and Galileo observations from June and July 2022, collected at the IGS station OBE4 in Oberpfaffenhofen, Germany. A data set of 30 + 1 days was used for training and validation, as described in Section 3.1. Figure 2 depicts the validation analysis for the three methods under study, including the results for two representative features for the KDE- and BGMM-trained models. Figure 2a–d show the likelihood values as a function of the standardized features MP_A and dC/N0_A. For reference, quantile–quantile (Q-Q) plots of both features and a theoretical normal distribution are also shown in Figure 2b,d. For the MP_A feature, a skewness of -0.09 and an excessive kurtosis of 0.78 were obtained, indicating that the data distribution is close to normal, but with larger tails. This is also suggested by the deviations of the first and last quantiles shown in the Q-Q plot of Figure 2b. These characteristics are exhibited by the distributions obtained with both methods, shown in Figure 2a,b. The distribution from the BGMM-trained model is more peaked compared to the distribution from the KDE-trained model, which stems from the estimation process of the BGMM method as a result of fitting a distribution with large tails.
On the other hand, for the dC/N0_A feature, a skewness of −0.14 and an excessive kurtosis of 0.35 were obtained, which indicates that the data distribution is slightly left-skewed and has tails closer to normal. Likewise, this is suggested by the slightly concave curve in the Q-Q plot of Figure 2d. These characteristics can be seen in the obtained distributions from both methods, depicted in Figure 2c,d. Similarly to the results for the MP_A feature, the distribution from the BGMM-trained model shown in Figure 2d exhibits a larger peak.
Figure 2e depicts the relative frequency distribution of the root mean squared (RMS) errors of predicted values and observations using the VAE-trained model. As expected from to the training process, the resulting distribution of RMS errors is left-skewed, indicating that the model is capable of effectively reproducing the input data distribution.

4. Multipath Characterization Using a Digital Twin Model

For comparison of the results obtained with the machine learning data-based approach described in Section 3, the strategy for multipath characterization developed by [28] is considered in this study. In this scheme, anechoic chamber measurements of an antenna probe are used to extract near-field equivalent sources. These are then employed in simulation scenarios in a standalone case, as well as within a digital twin model (DTM) of the installation site, using the SIMULA CST Studio Suite® (Darmstadt, Germany) [29]. For this study, a multipath characterization based on group delay variation maps is employed for the analysis of the results, described in Section 5.

5. Results and Discussion

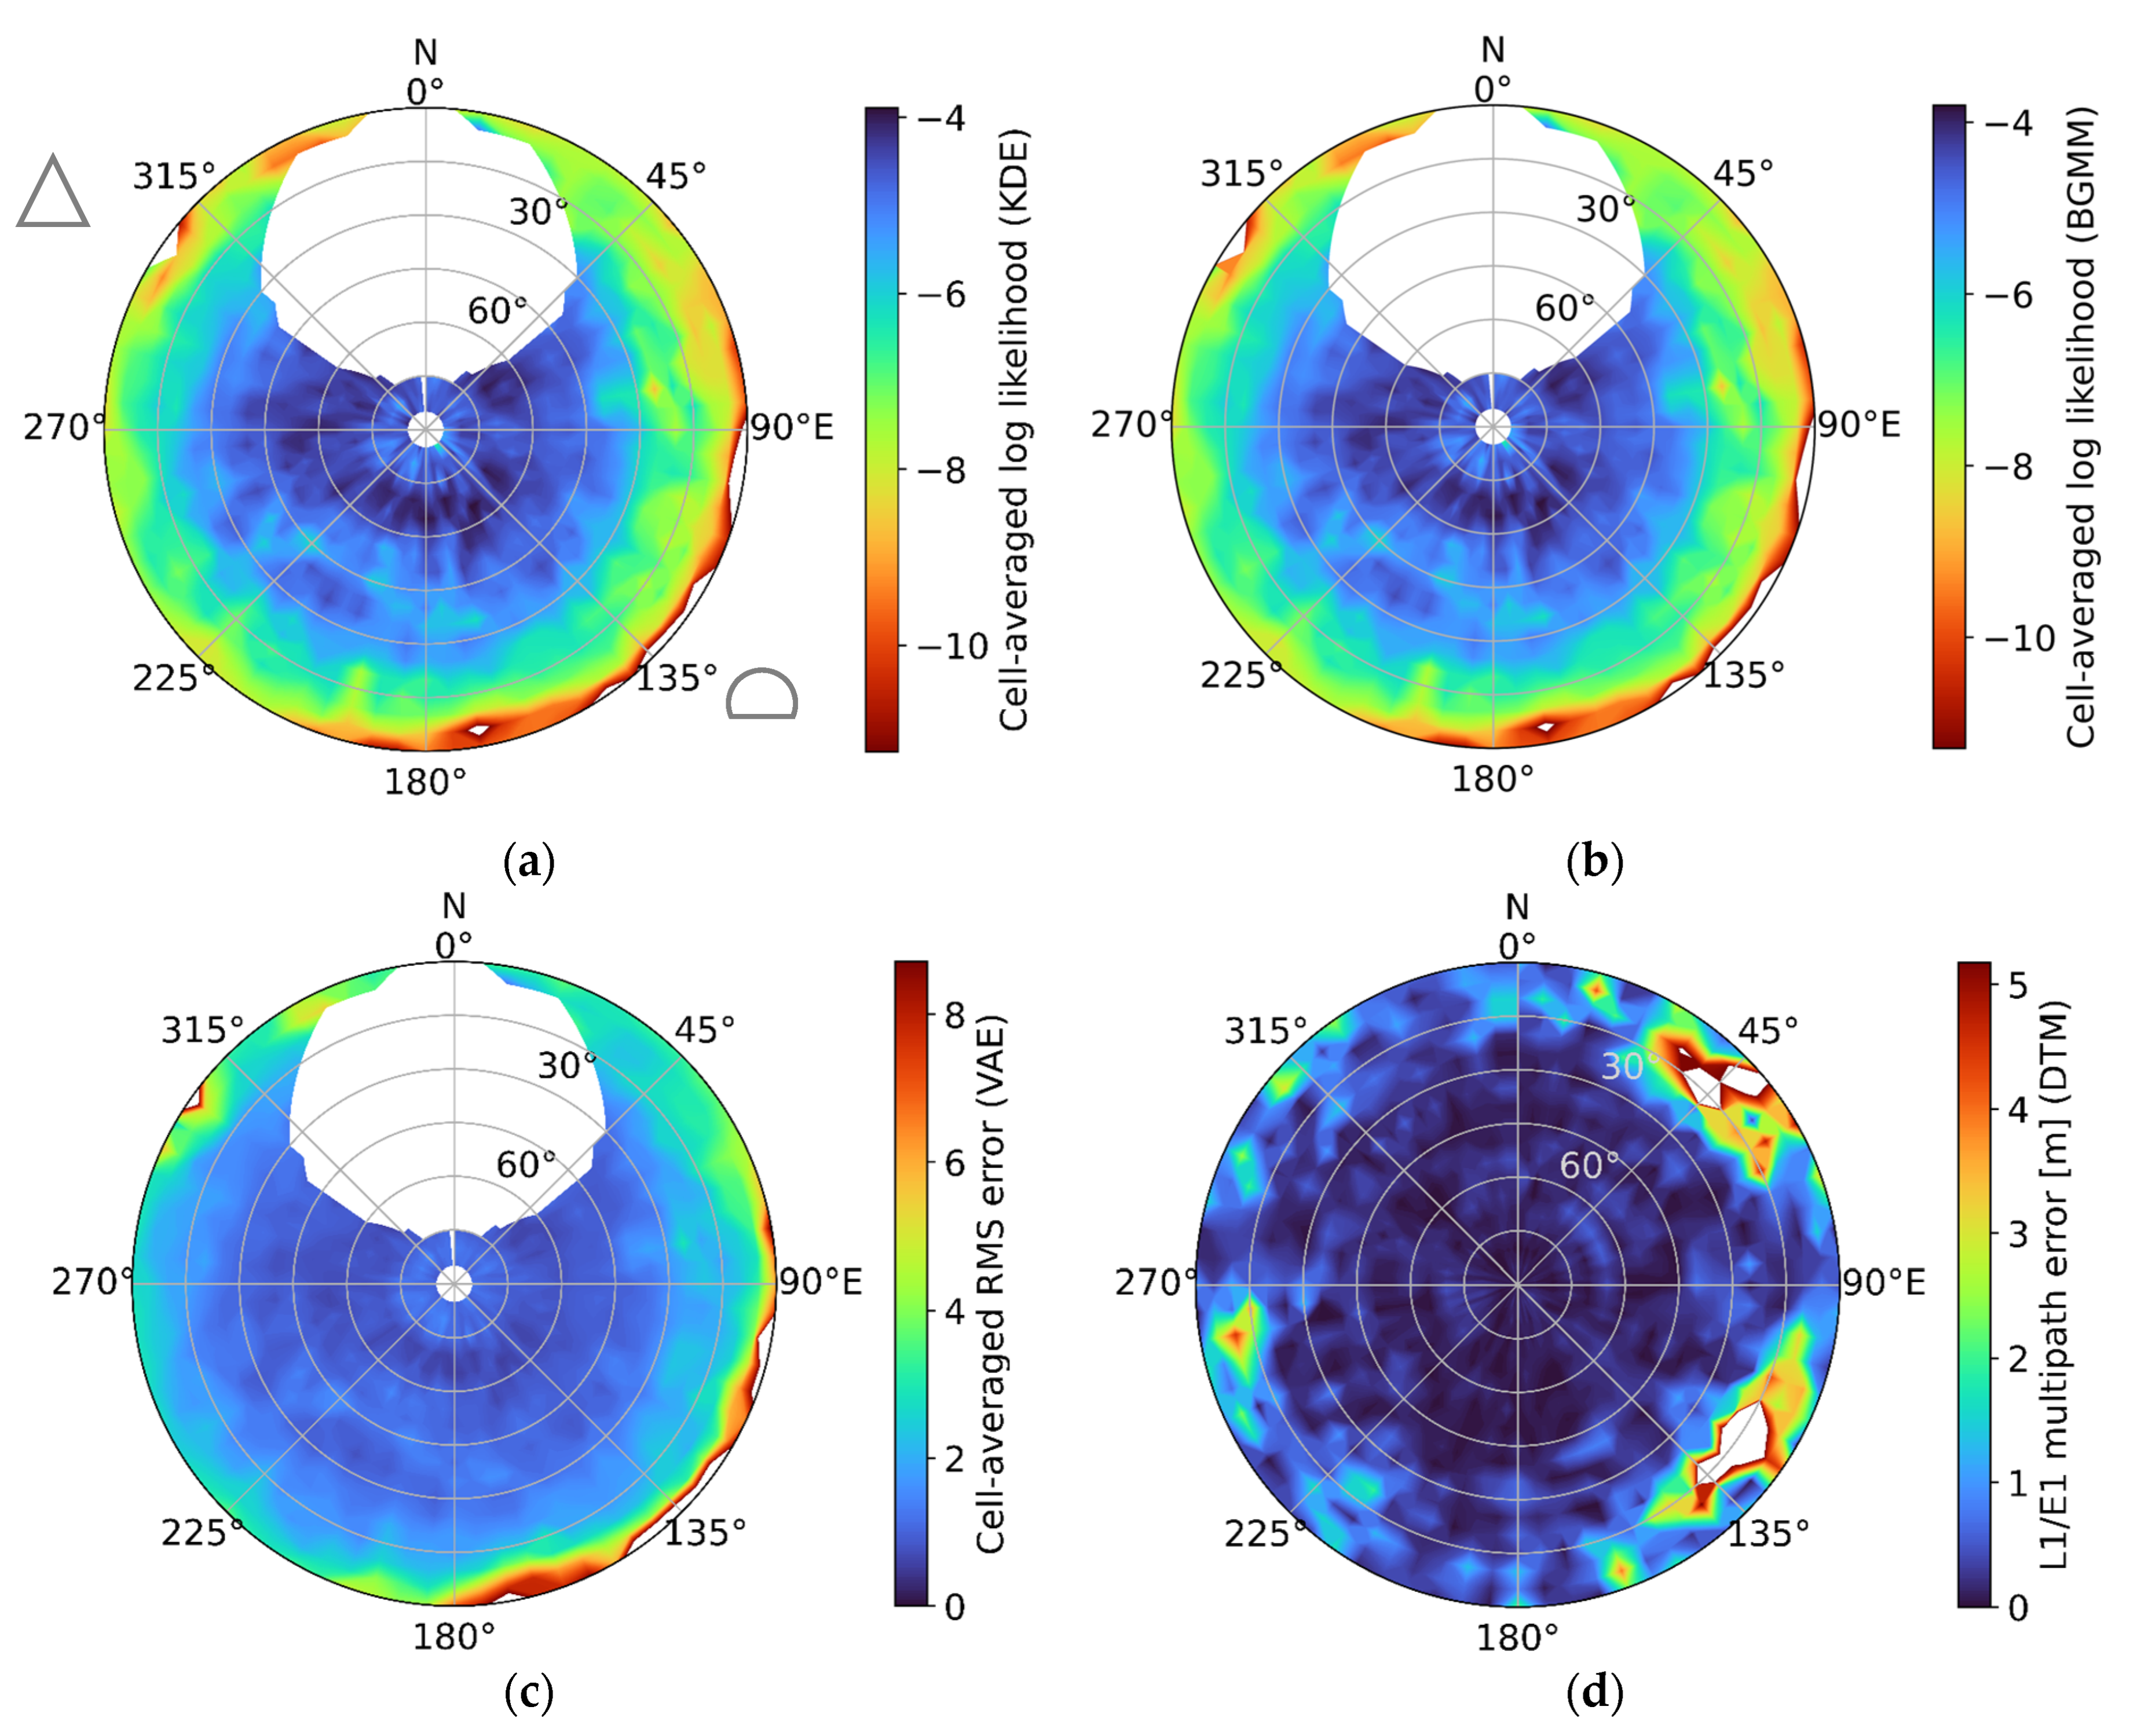
Similarly to the training and validation steps described in Section 3.3, the trained models were tested in a dual-constellation (GPS+Galileo) setup using a 10-day data set from July 2022 collected at the station OBE4 (see Figure 3). The evaluation metrics of each data point in the test data set, using the corresponding model and satellite positions, are mapped onto a 5° × 5° topocentric coordinate grid. Finally, for each model, a cell-averaged metric is obtained. For the results obtained with KDE and BGMM, the metric under evaluation is the log likelihood of observations under the corresponding trained model. For the results obtained using a VAE, the metric under evaluation is the RMS error of predicted values, obtained using the trained model and observations.
Figure 4 depicts skyplots of the multipath characterization using the models under evaluation, including the prediction in the L1/E1 band obtained with the strategy described in Section 4. In order to ease the comparison of results, the same color map is used in all plots (however, the depicted scales and metrics are different). Likewise, to achieve a consistent scale among plots, values below the 1st percentile (for Figure 4a,b) and above the 99th percentile (for Figure 4c,d) have been discarded. Finally, the color scales have been adapted to qualitatively depict consistent information, namely, the lower likelihood values in Figure 4a,b correspond to the higher errors in Figure 4c,d.
Overall, the three trained models are effectively capable of identifying regions with high-multipath sources (see Figure 3). Particularly, around 300° in azimuth and below 15° of elevation, the impact of the 5m dish antenna installation is visible in the three cases. Along the south-east region, below 15° elevation, it is also possible to see the impact of reflected signals from the dish antenna, as well as from the optical station dome. For higher elevations, the log likelihood values from the KDE- and BGMM-trained models decrease at a slightly slower rate than the rate of increase in RMS errors from the VAE-trained model. As such, the KDE- and BGMM-trained models identify a slightly higher multipath impact between 30° and 45° of elevation with respect to the VAE-trained model.
The results from the trained models exhibit both consistencies and differences with respect to the predictions using the DTM. In all cases, the impact of multipath due to the 5m dish antenna is visible. However, according to the results from the trained models, multipath errors in the region around the optical station dome seem to be more dispersed (from 90° to 180° in azimuth), whereas the results from the DTM show a more concentrated impact and extend to elevations between 15° and 25°. The results from the DTM also predict a moderate impact due to multipath around 300° in azimuth, as well as large errors in the north-east region. Such errors are apparently not present in the KDE- and BGMM-trained models, and are only slightly visible in the results from the VAE-trained model. Finally, high multipath errors in a small region around 260° in azimuth and at elevation angles below 15° are also predicted by the DTM-based scheme, but are not present in the results from the trained models.
In general, some of the differences that both of the approaches under comparison exhibit can be partially explained by the use of dual frequency observations in the case of the trained models. Given that the phase of a reflected signal with respect to the directly received signal depends on the wavelength, multipath may be constructive at one frequency, but destructive at a second one [19], which may explain why the trained models identify regions with multipath that the DTM-based scheme does not (e.g., around 170° in azimuth). Similarly, due to the employed features, the trained models are sensitive not only to medium-delay multipath (which mostly affects code phase observations), but also to short-delay multipath, particularly for the KDE- and BGMM-trained models, for which all features have an equal weight.

6. Conclusions

This contribution presented a strategy for static multipath characterization of GNSS ground stations using RINEX observations and machine learning algorithms. The obtained results were assessed using an independent methodology employing a digital twin model. Being based on generative models, the proposed strategy is suitable for transfer learning and synthetic training data generation for other GNSS ground stations where it is difficult to generate or gain access to data. Likewise, through the common characterization of both code and carrier phase multipath, the presented strategy may contribute to the improvement of data quality from ground stations for GNSS monitoring tasks and other applications requiring high-precision levels.

Author Contributions

Conceptualization, G.A.-A. and S.C.; methodology, G.A.-A., S.C. and E.O.A.; software, G.A.-A., S.C. and E.O.A.; validation, G.A.-A., S.C. and E.O.A.; formal analysis, G.A.-A., S.C. and E.O.A.; investigation, G.A.-A., S.C. and E.O.A.; resources, G.A.-A. and S.C.; data curation, G.A.-A. and E.O.A.; writing—original draft preparation, G.A.-A.; writing—review and editing, G.A.-A., S.C. and E.O.A.; visualization, G.A.-A. and E.O.A. All authors have read and agreed to the published version of the manuscript.

Funding

This research received no external funding.

Institutional Review Board Statement

Not applicable.

Informed Consent Statement

Not applicable.

Data Availability Statement

Data used for training and testing the models can be publicly accessed at igs.org.

Acknowledgments

This study makes use of broadcast ephemeris and observation data from the International GNSS Service. The support of all the involved institutions and analysis centers is gratefully acknowledged.

Conflicts of Interest

The authors declare no conflicts of interest.

References

  1. Bevly, D.; Martin, S. Navigation in advanced driver-assisted systems and automated driving. In Positioning, Navigation, and Timing Technologies in the 21st Century: Integrated Satellite Navigation, Sensor Systems, and Civil Applications; Jade Morton, Y.T., van Diggelen, F., Spilker, J.J., Jr., Parkinson, B.W., Lo, S., Gao, G., Eds.; The IEEE, Inc.: Piscataway, NJ, USA; John Wiley & Sons: Hoboken, NJ, USA, 2021; Volume 2, pp. 1769–1810. [Google Scholar]
  2. Pullen, S.; Joerger, M. GNSS integrity and receiver autonomous integrity monitoring (RAIM). In Positioning, Navigation, and Timing Technologies in the 21st Century: Integrated Satellite Navigation, Sensor Systems, and Civil Applications; Jade Morton, Y.T., van Diggelen, F., Spilker, J.J., Jr., Parkinson, B.W., Lo, S., Gao, G., Eds.; The IEEE, Inc.: Piscataway, NJ, USA; John Wiley & Sons: Hoboken, NJ, USA, 2021; Volume 1, pp. 591–617. [Google Scholar]
  3. Thoelert, S.; Circiu, M.-S.; Meurer, M. Impact of satellite biases on the position in differential MFMC applications. In Proceedings of the International Technical Meeting of the Institute of Navigation, San Diego, CA, USA, 21–24 January 2020; pp. 222–235. [Google Scholar] [CrossRef]
  4. Lee, J.; Jade Morton, Y.T.; Lee, J.; Moon, H.-S.; Seo, J. Monitoring and mitigation of ionospheric anomalies for GNSS-based safety critical systems: A review of up-to-date signal processing techniques. IEEE Sig. Proc. Mag. 2017, 34, 96–110. [Google Scholar] [CrossRef]
  5. Thombre, S.; Bhuiyan, M.Z.; Eliardsson, P.; Gabrielsson, B.; Pattinson, M.; Dumville, M.; Fryganiotis, D.; Hill, S.; Manikundalam, V.; Pölöskey, M.; et al. GNSS threat monitoring and reporting: Past, present, and a proposed future. J. Navig. 2018, 71, 513–529. [Google Scholar] [CrossRef]
  6. Wang, Y.; Shen, J. Real-time monitoring for a wide area precise positioning system. Sat. Nav. 2020, 1, 24. [Google Scholar] [CrossRef]
  7. van Graas, F.; Ugazio, S. GNSS signal quality monitoring. In Positioning, Navigation, and Timing Technologies in the 21st Century: Integrated Satellite Navigation, Sensor Systems, and Civil Applications; Jade Morton, Y.T., van Diggelen, F., Spilker, J.J., Jr., Parkinson, B.W., Lo, S., Gao, G., Eds.; The IEEE, Inc.: Piscataway, NJ, USA; John Wiley & Sons: Hoboken, NJ, USA, 2021; Volume 1, pp. 215–231. [Google Scholar]
  8. Walter, T. Satellite based augmentation systems. In Springer Handbook of Global Navigation Satellite System; Teunissen, P.J.G., Montenbruck, O., Eds.; Springer International: Berlin/Heidelberg, Germany, 2017; pp. 339–361. [Google Scholar]
  9. Hauschild, A. Combinations of observations. In Springer Handbook of Global Navigation Satellite System; Teunissen, P.J.G., Montenbruck, O., Eds.; Springer International: Berlin/Heidelberg, Germany, 2017; pp. 583–604. [Google Scholar]
  10. Braasch, M.S. Multipath. In Springer Handbook of Global Navigation Satellite System; Teunissen, P.J.G., Montenbruck, O., Eds.; Springer International: Berlin/Heidelberg, Germany, 2017; pp. 443–468. [Google Scholar]
  11. Maqsood, M.; Gao, S.; Montenbruck, O. Antennas. In Springer Handbook of Global Navigation Satellite System; Teunissen, P.J.G., Montenbruck, O., Eds.; Springer International: Berlin/Heidelberg, Germany, 2017; pp. 505–534. [Google Scholar]
  12. Caizzone, S.; Schöfeldt, M.; Elmarissi, W.; Circiu, M.S. Antennas as precise sensors for GNSS reference stations and high-performance PNT applications on Earth and in space. Sensors 2021, 21, 4192. [Google Scholar] [CrossRef] [PubMed]
  13. Azarbad, M.R.; Mosavi, M.R. A new method to mitigate multipath error in single-frequency GPS receiver with wavelet transform. GPS Sol. 2014, 18, 189–198. [Google Scholar] [CrossRef]
  14. Quan, Y.; Lau, L.; Roberts, G.W.; Meng, X.; Zhang, C. Convolutional neural network based multipath detection method for static and kinematic GPS high precision positioning. Remote Sens. 2018, 10, 2052. [Google Scholar] [CrossRef]
  15. Hsu, L. GNSS multipath detection using a machine learning approach. In Proceedings of the 2017 IEEE 20th International Conference on Intelligent Transportation Systems (ITSC), Yokohama, Japan, 16–19 October 2017; pp. 1–6. [Google Scholar] [CrossRef]
  16. Suzuki, T.; Amano, Y. NLOS multipath classification of GNSS signal correlation output using machine learning. Sensors 2021, 21, 2503. [Google Scholar] [CrossRef] [PubMed]
  17. Romero, I. (Ed.) The Receiver Independent Exchange Format (RINEX) v4; IGS/RTCM RINEX WG Chair; ESA/ESOC/Navigation Support Office: Darmstadt, Germany, 2021. [Google Scholar]
  18. Pan, Y.; Möller, G.; Soja, B. Machine learning-based multipath modeling in spatial domain applied to GNSS short baseline processing. GPS Sol. 2024, 28, 9. [Google Scholar] [CrossRef]
  19. Groves, P.D.; Jian, Z.; Rudi, M.; Strode, P. A portfolio approach to NLOS and multipath mitigation in dense urban areas. In Proceedings of the International Technical Meeting of the Satellite Division of The Institute of Navigation, Nashville, TN, USA, 16–20 September 2013; pp. 3231–3247. [Google Scholar]
  20. Zhang, Z.; Li, B.; Gao, Y.; Shen, Y. Real-time carrier phase multipath detection based on dual-frequency C/N0 data. GPS Sol. 2019, 23, 7. [Google Scholar] [CrossRef]
  21. Rosenblatt, M. Remarks on some nonparametric estimates of a density function. Ann. Math. Stat. 1956, 27, 832–837. [Google Scholar] [CrossRef]
  22. Parzen, E. On estimation of a probability density function and mode. Ann. Math. Stat. 1962, 33, 1065–1076. [Google Scholar] [CrossRef]
  23. Dempster, A.P.; Laird, N.M.; Rubin, D.B. Maximum likelihood from incomplete data via the EM algorithm. J. R. Stat. Soc. Ser. B 1977, 39, 1–38. [Google Scholar] [CrossRef]
  24. Attias, H. A variational Bayesian framework for graphical models. In Proceedings of the 12th International Conference on Neural Information Processing Systems, Cambridge, MA, USA, 29 November–4 December 1999; pp. 209–215. [Google Scholar]
  25. Blei, D.M.; Jordan, M.I. Variational inference for Dirichlet process mixtures. Bayes. Anal. 2006, 1, 121–143. [Google Scholar] [CrossRef]
  26. Rumelhart, D.E.; Hinton, G.E.; Williams, R.J. Learning internal representations by error propagation. In Parallel Distributed Processing: Explorations in the Microstructure of Cognition: Foundations; MIT Press: Cambridge, MA, USA, 1987; pp. 318–362. [Google Scholar]
  27. Klingma, D.P.; Welling, M. Auto-enconding variational Bayes. In Proceedings of the International Conference on Learning Representations, Scottsdale, AZ, USA, 2–4 May 2013. [Google Scholar]
  28. Addo, E.O.; Elmarissi, W.; Caizzone, S. Digital twin-enabled characterization of GNSS multipath in challenging reference stations using a dual-polarized probe. J. Inst. Navig. 2024, 71, navi.644. [Google Scholar] [CrossRef]
  29. Dassault-Systèmes. CST Studio Suite: Electromagnetic Field Simulation Software. Brochure. Available online: www.3ds.com/fileadmin/PRODUCTS-SERVICES/SIMULIA/PRODUCTS/CST/CST_Brochure_A4.pdf (accessed on 1 January 2022).
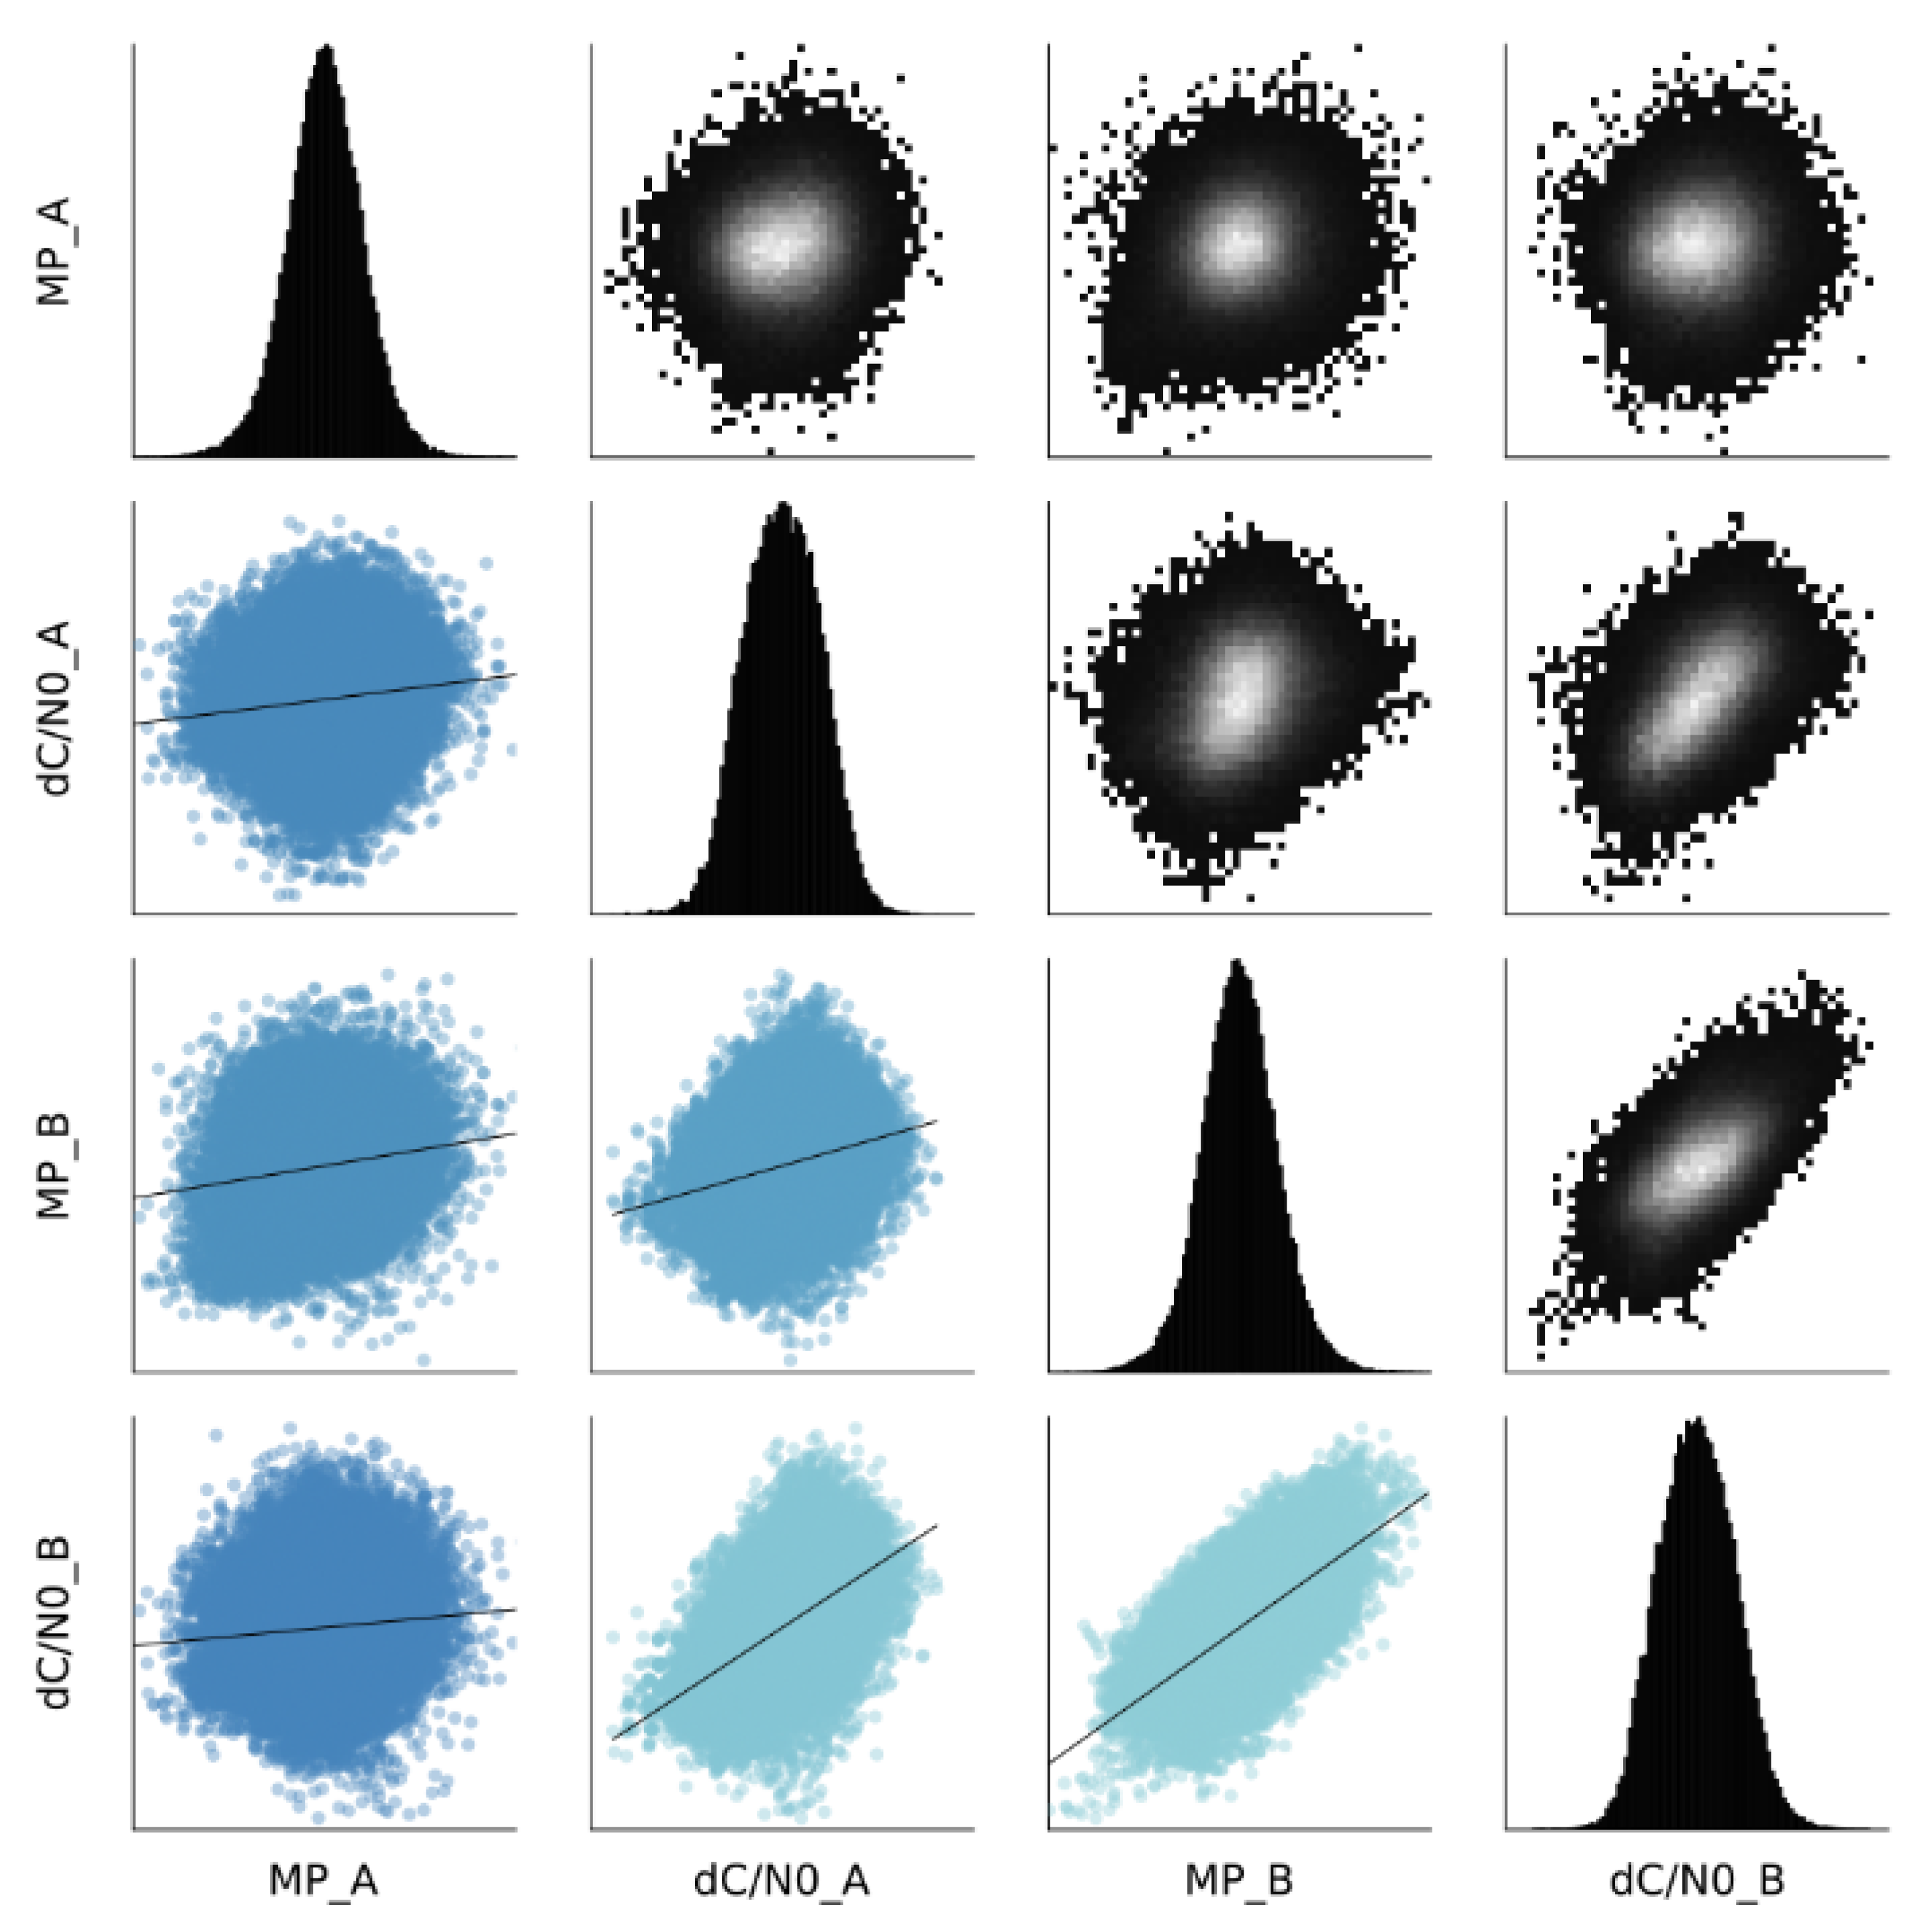
Figure 1. Feature correlation plots: scatter with best fit line (below diagonal), one-dimensional histograms (diagonal) and two-dimensional histograms (above diagonal). Color scale in scatter plots denotes correlation level among features (lighter shades indicate values close to 1).
Engproc 88 00072 g001
Figure 2. Model validation analysis: (a,b) likelihood values from KDE- and BGMM-trained models as a function of feature MP_A; (c,d) likelihood values from KDE- and BGMM-trained models as a function of feature dC/N0_A; (b-, d-upper right) Q-Q plots of features MP_A and dC/N0_A and a theoretical normal distribution; (e) root mean squared errors of observed and predicted values from the VAE-trained model.
Engproc 88 00072 g002
Figure 3. An aerial view of the surroundings and location of the GNSS antenna of the OBE4 station (credits: Google Maps).
Engproc 88 00072 g003
Figure 4. Skyplots of multipath characterization: (a) cell-averaged log likelihood values from the KDE-trained model; (b) cell-averaged log likelihood values from the BGMM-trained model; (c) cell-averaged root mean squared errors of observed and reconstructed values from the VAE-trained model; (d) multipath errors in the L1/E1 band predicted using a DTM. To ease the comparison of results, the same colormap is used, but the scales and metrics in each plot are different. For reference, the approximate locations in azimuth of the high-gain antenna and the optical station dome are indicated in (a) with a triangle and a half circle, respectively.
Engproc 88 00072 g004
Disclaimer/Publisher’s Note: The statements, opinions and data contained in all publications are solely those of the individual author(s) and contributor(s) and not of MDPI and/or the editor(s). MDPI and/or the editor(s) disclaim responsibility for any injury to people or property resulting from any ideas, methods, instructions or products referred to in the content.