Abstract
Traditional Global Navigation Satellite Systems (GNSSs) are subject to intentional or unintentional disturbances in the northern regions of Norway, leading to loss of critical infrastructure. The VHF Data Exchange System (VDES) has been suggested as an alternative source of positioning, navigation and timing (PNT), based on statistical estimates. However, an empirical investigation into the feasibility of such a contingency-system has only recently become possible after the launch of the NorSat-TD satellite with purpose-designed VDES ranging capabilities. This paper presents an analysis of the characteristics of empirical VDE-SAT range measurements and a system-level performance analysis of a single-satellite system. In total, 1121 VDE-SAT pseudorange observations obtained from 54 satellite passes, recorded from July to October 2023, are analyzed. Residual analysis shows that these observations have a large and constant mean error of about 416 km, with a standard deviation of 335.2 m. The previously neglected atmospheric propagation effects on a VDE-SAT range measurement are shown to be significant, and the largest effect is likely to be the time-delay due to the ionosphere. The system performance analysis shows that VDE-SAT as a PNT-source has potential to be a navigation backup system, with a target metric positioning accuracy of 1000 m. This project was funded by the ESA NAVISP program.
1. Introduction
Significant disturbance of the Global Navigation Satellite System (GNSS) is affecting critical infrastructure in the northern regions of Norway, and the problem has become more common in recent years [1,2,3]. Alternative navigation systems are needed to ensure continued operations under critical GNSS-down conditions, driving the development of purpose-designed ranging signals using alternative communication systems. The topic of this paper is the analysis of experimental pseudorange measurements over the novel VHF (very-high-frequency) Data Exchange System (VDES) acting as a source of position, navigation and timing (PNT) information in regions known for poor GNSS coverage.
VDES is an evolution of the well-established Automatic Identification System (AIS), which was first investigated as a source of alternative ranging signals in the project ACCSEAS [4]. Further research on the topic saw VDES in ranging mode (R-mode) outperforming that of AIS, shifting the focus to the digital exchange system [5]. The current state-of-the-art research has resulted in statistical lower bounds of the performance of the satellite component of VDES, namely VDE-SAT, based on simulation and feasibility studies, and experimental results only of the terrestrial VDES component, VDE-TER [6,7,8,9]. An important novelty of this research is, then, the analysis of the ranging performance of experimental VDE-SAT range measurements.
This work was made possible via the support of the European Space Agency (ESA) project ICING, funded by the Navigation, Innovation and Support Program (NAVISP) of ESA, lead by Space Norway out of Oslo, Norway, with subcontractor Kongsberg Discovery Seatex in Trondheim, Norway. Space Norway is the design authority and owner of a VDE-SAT payload on-board the NorSat-TD satellite, which was used as part of this project. The objective of this study is to achieve a better understanding of the characteristics of VDE-SAT ranging signals. This is achieved by means of a statistical parametric analysis, and a positioning analysis, of empirical pseudorange measurements.
The paper begins by describing the details of the gathered empirical data in Section 2. This section describes the testing infrastructure, the range measurements and required auxiliary data. Further, Section 3 describes the applied methodology, starting with the method used to describe the signal characteristics in Section 3.1. There, the basic statistical and parametric analyses are described, as well as the applied signal corrections. Section 3.2 details the methods used to evaluate the positioning performance. All results are shown in Section 4 and are further discussed and concluded in Section 5.
2. Data Description
The topic of analysis for this research paper is the first empirical VDE-SAT range measurements. This section will first present the surrounding infrastructure used for the testing campaign, where the information is largely based on internal project documents. Further, the section will present the information from the observation, navigation and telemetry data used for the analysis. Finally, the section concludes by presenting the measurements from the test campaign that will be used in the analysis of this paper.
2.1. Testing Infrastructure
All VDE-SAT data were gathered through the same link, which is a one-way link from the NorSat-TD satellite to a dedicated ground station located in Trondheim, Norway. NorSat-TD was launched on 15 April 2023 into a low-Earth orbit (LEO), at an approximately altitude. The satellite has a VST x50 VDES transceiver produced by Kongsberg Discovery Seatex in Trondheim, Norway, and owned by Space Norway, connected to a 3-element 8 dBi Yagi-Uda antenna in an Earth-limb pointing mode, transmitting signals at a 161.8625 frequency. A modified firmware of the VST x50 transceiver was required for the ranging capabilities needed for this project, but the transmitted signals are physical layer-compatible with the defined specification of SAT-MCS-0.150 VDES Link ID 29 [10]. The VDES transceiver receives its required pulse-per-second (PPS) input directly from a GNSS receiver on-board the satellite.
The VDE ground terminal is a modified Kongsberg Discovery Seatex VDES 300 ship-terminal, with a GNSS and VHF antenna. This terminal uses a GNSS timing module, and an external high precision Kongsberg 10 rubidium clock as a timing source. The VHF antenna is a dipole Comrod AV7M antenna, designed for maritime communication. The location of the antenna is given in Table 1, in geodetic coordinates and the WGS84 earth-centred, earth-fixed (ECEF) reference frame [11].

Table 1.
The position parameters of the ground station antenna.
2.2. Measurements and Auxiliary Data
The ranging measurements included in this work were recorded in the timespan from 11 July to 22 October 2023. Each range observation was distributed in three separate parts. First, the receiver observation measurement, O, seen in Equation (1), which includes the VDES slot number of the measured ranging burst, time offset , and a measure of the signal-to-noise ratio (SNR). Secondly, in the event of no packet loss, the transmitted navigational message N is also recorded at the receiver. This contains the proprietary navigational message as defined at the time of transmission, with satellite position and velocity in the WGS84 ECEF-frame and timestamp of transmission in Coordinated Universal Time (UTC), summarised in the set in Equation (2). The measurement sets O and N were transmitted from the satellite every ten seconds. The reported satellite position and velocity in the transmitted navigational message N could not be used in the analysis, as the satellite firmware did not have full functionality during the test campaign. As a result, satellite position information from auxiliary NorSat-TD telemetry data was used in the analysis, interpolated to the timestamp using a cubic spline interpolation with a “not-a-knot” boundary condition at either end. Included in the set T of telemetry data in Equation (3) are the alternative satellite position and velocity , given in the same ECEF-frame and evaluated at the time of transmission .
A pseudorange measurement is a simple range measurement based on the time-of-flight of a transmitted signal [12]. In this study, both the transmitter and receiver slot timing is synchronized to UTC time through a GNSS PPS signal. The time offset at the ground station between the start of the slot , also reported as the timestamp at which the ranging signal was transmitted, to the time at the receiver is measured using proprietary time estimation techniques, as a measure of the time-of-flight of the signal, meaning . Each measurement of the time offset can then readily be transformed into a pseudorange measurement at the time of reception as .
In total, 1129 pseudorange observations were measured with no packet loss. Measurements of a pass that deviate past three standard deviations away from the mean of that pass are assumed outliers [13]. Further, a few measurements were manually identified as outliers. In total, eight observations were identified as outliers. The resulting final set A is a combination of the elements of O, N and T, with the timestamp, time offset and signal quality metric, as well as the satellite position and velocity as sourced from the telemetry. There are then 1121 such sets A included in the analysis.
3. Methodology
The research is separated in two parts. First, the signal characteristics are evaluated by means of a statistical analysis of the residual of the empirical range measurements. The method used for this analysis is described in Section 3.1. Secondly, the single-satellite positioning methodology is presented in Section 3.2.
3.1. Signal Characteristics
Each pseudorange measurement is defined as in Equation (5), with a relation to the true geometric range , the speed of light c, equal to 299,792,458 , and relative time offset between transmitter and receiver clock , and finally an error term [12]. The term will include all error effects on the propagating electromagnetic wave. The most notable effects considered in GNSS are the individual receiver and transmitter clock errors, observation noise, ephemeris errors, multipath and atmospheric delays. Simple models of different error effects on VDES ranging signals have shown that it is the time-delay due to the ionosphere that is the most important effect [9]. In this regard, only the time-delay due to the ionosphere will be considered in the error term in this analysis.
3.1.1. Residual Pseudorange Analysis
Let the NorSat-TD telemetry position and velocity be simply denoted as and , respectively. The pseudorange residuals are defined as the difference between the measured VDES pseudoranges and the geometric range between the transmitting NorSat-TD position and the receiving ground station antenna position , as seen in Equation (6). The positions of the ground station and satellite are accurately known, and it is assumed that the error in the geometric range estimate .
Assuming each measurement can be considered independent, the same can be inferred for the pseudorange residuals evaluated using Equation (6). In this case, the residual measurement can be seen as an independent continuous random variable, and it is of interest to evaluate the statistical spread and bias, as well as the normality of the random variable. The Anderson–Darling (AD) test, which is shown in [14] to be a good test for normality, is used to evaluate the fit of a normal distribution [15].
3.1.2. Parametric Analysis
The parametric analysis considers four parameters that are hypothesised to be most influential. The first considered parameter is the SNR. For conventional GNSS signals, the SNR has been shown to be strongly correlated with the experienced multipath errors [16]. The other three parameters relate to the ionospheric time-delay, as this has been highlighted as a critical error source for the relatively low-frequency VDES ranging signals [9]. These parameters are the pseudorange measurement , computed elevation angle of the satellite and time-of-day of the timestamp . The first two are related to the geometric range through which the ionospheric delay accumulates. The time-of-day is included to display an expected variation in local ionosphere electron content, a quantity that is directly related to the ionospheric time-delay [17]. The time-of-day was not included in the linear regression analysis, as the expected correlation between the ionospheric time-delay and the time-of-day is a half-cosine, not linear [17]. Each parameter was normalized to a range .
3.1.3. Ionospheric Signal Corrections
The ionospheric correction model applied in this analysis is the single-frequency time-delay correction used in the European Galileo system, called NeQuick-G. The output of the model is the Slant Total Electron Count (STEC), which, when combined in Equation (7) with the frequency of the transmitted signal, equates to a measure of the ionospheric group delay , which was applied as a time-delay correction of the associated pseudorange measurement ([18], Equation (1)). Because this delay is a function of the frequency, this model was applied to the centre frequency of the transmitted VDES signals, at 161.8625 .
The correction model was applied to each VDE-SAT pseudorange measurement, and the total set of corrected residuals was re-analysed and compared using the methods of Section 3.1.1 and Section 3.1.2.
3.2. Positioning Performance Analysis Method
The analysis of the positioning performance of a VDE-SAT PNT-source acting in a navigation system is limited to the gathered VDE-SAT ranging signals acting autonomously, with no other sources. This, then, is an analysis of the single-satellite positioning performance of the current system. The analysis is limited by the assumptions of a GNSS-disciplined clock and satellite position.
One of the most fundamental methods of determining the receiver position is through the use of a linearised and iterated least-squares estimate. The least-squares problem is formulated as a function of the estimated state vector . This problem is solved using the Levenberg–Marquardt algorithm, a numerically robust method well suited for collinear problems [19].
The positioning accuracy of the current system was defined as a surface position error between the estimated and the true position of the ground terminal, computed as the great-circle distance over the WGS84 geoid. This was computed using the Haversine formula, a computationally efficient trigonometric relationship that is also numerically stable for small distances [20]. The performance of the system was evaluated using a rolling positioning accuracy measure, where N consecutive measurements of a total of n in a particular pass were used to calculate the position of the ground station antenna over time through that particular pass. As the satellite positions are reported in an ECEF-frame, a Sagnac delay correction due to the frame rotation was applied to the measured pseudoranges [21]. The analysis was conducted for all integers N where for all passes. The mean surface position error through each pass for a given N was calculated. The analysis was repeated with an additional surface constraint. This was included to emulate the performance of a more sophisticated geoid-constrained positioning solution, which is more applicable for ships in a maritime environment. The constraint was implemented as an additional pseudorange observation from the center of the Earth, with range equal to the norm of the true receiver position in an ECEF frame, with a variance.
4. Results
The results following the method in Section 3 are presented in two parts. First, the analysis of the characteristics of the VDE-SAT ranging signals is presented in Section 4.1. Secondly, the results of the performance of NorSat-TD acting as an autonomous positioning system are presented in Section 4.2.
4.1. Signal Characteristics
The first part of the analysis on the signal characteristics concerns the behaviour of the pseudorange residual through a pass. All observations through the whole test campaign share a large negative bias in the residual measurements, and appear to be approximately too short. A second result is the apparent random noise around an initially decreasing then increasing trend in the residual measurements through a pass. This corresponds inversely with the elevation angle of the satellite as observed by the receiver. All recorded passes show a similar apparent random noise contribution.
When combining all residual measurements, the histogram distribution of the uncorrected measurements is as seen in the upper half of Figure 1, with a mean of −416,037.0 , and a standard deviation. The residuals are bounded within a range. This distribution shows a significant skew, and the AD-test results in a statistic that correspond to a confidence in the normality of the distribution, which is below a typical threshold value of .
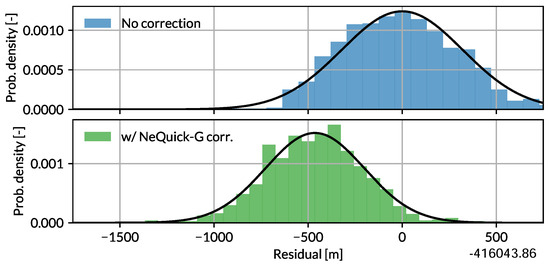
Figure 1.
Two histogram representations of the residual measurements, without or with the NeQuick-G ionospheric correction algorithm applied to the measurements. Normal distributions are fitted to each histogram to illustrate their difference in mean and variance.
The simple linear regression seen in Figure 2 gives a strong confidence in an increasing trend in the residual with an increasing pseudorange, and inversely a strong confidence in a decreasing trend with an increasing elevation angle. This fits the hypothesis of larger errors with an increased propagation path. The correlation with the elevation angle is somewhat stronger, which is apparent from a steeper trend as well as the result after a multiple linear regression, where the pseudorange trend is opposite, with weak confidence from the regression model. Observations were not made at all hours of the day, meaning the analysis of the time-of-day variation is limited. Still, a trend is apparent for observations made around mid-day, when ionosphere electron content is highest, apparently correlating with a higher variation in the residual measurements, as well as a higher mean and upper-bound of the residual. This also supports the hypothesis of ionospheric time-delay in the signal. The equated trend with increasing SNR is weak in both the simple and multiple linear regression, further establishing that multipath error is likely not a dominant source of error in the measurements. However, the variation in the residual measurements seems to decrease for higher SNR.
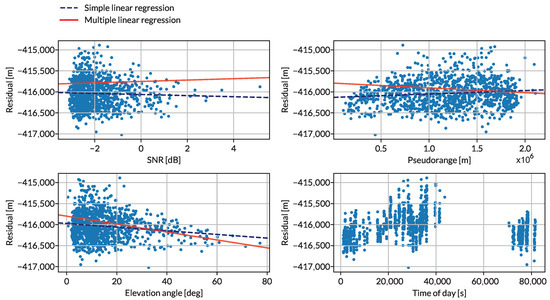
Figure 2.
All measured pseudorange residuals plotted as a function of the parameters SNR, pseudorange, elevation angle and time of day. The results of the simple and multiple linear regression are presented as trend lines.
After correcting each measurement using the NeQuick-G ionospheric correction algorithm, the resulting histogram distribution changed as seen in Figure 1. The variation in the residuals decreases to after applying the correction, removing the apparent skew in the distribution. The distribution now passes the AD-test with a higher than confidence in normality.
Applying the NeQuick-G ionospheric correction algorithm reduces the correlations originally revealed in the parametric analysis. The results of the parametric analysis of the dataset after applying the NeQuick-G correction technique are shown in Figure 3. When comparing the computed trend lines to that of the uncorrected residuals, it is clear that the NeQuick-G technique largely removes the correlation between the four parameters and the residual measurements. The NeQuick-G correction technique significantly reduces the coefficient values of all but one parameter, and shows high p-values for all computed parameter coefficients, meaning the influence of the parameter on the residuals can be assumed zero.
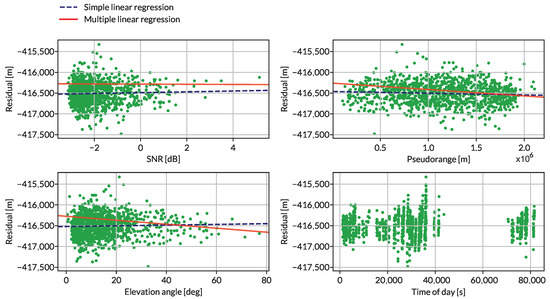
Figure 3.
All measured pseudorange residuals, corrected for ionospheric time-delay using the NeQuick-G algorithm, plotted as a function of the parameters SNR, pseudorange, elevation angle and time of day. The results of the simple and multiple linear regression are presented as trend lines.
4.2. Autonomous VDE-SAT Positioning Performance
The evaluation of the autonomous positioning performance of VDE-SAT considers the rolling performance assessment using the NorSat-TD VDE-SAT range observations. The result of this method for a varying number of consecutive observations N is shown in Figure 4, plotted on a log-scale. The performance is plotted both with and without the use of a ground constraint, for each of the recorded passes. Both the results with and without ground constraint show a downwards trend with increasing number of observations, and the surface position errors with ground constraint are consistently 10–100 times smaller than for the errors obtained with no ground constraint. The lowest computed surface position error with no ground constraint is about . For , positioning with a ground constraint results in surface position error around or below for all passes with at least as many observations, bar two passes with an error at about . The lowest recorded error is below . There is little improvement in the surface position error for with the ground constraint.
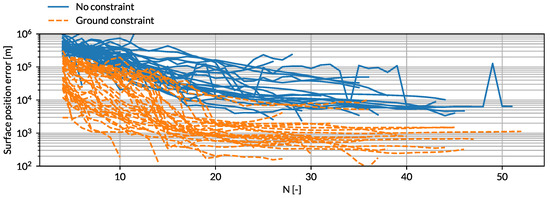
Figure 4.
All passes equated with a rolling performance metric, for a varying number of consecutive observations N.
5. Discussion and Conclusions
The focus of the study has been on the use of VDE-SAT pseudoranges as a source of PNT in the Arctic, primarily focusing on the signal characteristics. A secondary focus has been the investigation into the use of the NorSat-TD as an autonomous source of positioning at the user.
The current performance level of the signal has been presented, and evidence shows that the ionospheric time-delay has a significant influence on the range error. The range measurement residuals have a bias due to static delays, and a standard deviation, which reduces to a standard deviation after applying the NeQuick-G ionospheric correction model. The parametric study showed clear correlations with parameters associated with ionospheric time-delay, and the application of the NeQuick-G ionospheric correction model successfully eliminated these correlations and improved the signal ranging performance. The effects due to propagation have been neglected from earlier studies, but this study shows a need for further investigation into the topic of propagation effects on VDES ranging signals.
The equated performance of the contemporary single-satellite system does not consistently meet requirements for a navigation backup system [22]. Although this is expected from a single-satellite system, it highlights an important metric for evolutions of the system. It is possible that with only small improvements to the signal quality, or the constellation geometry, a contemporary system could prove able to perform at a sufficient level for providing backup navigation solutions at sea.
This study also has key assumptions that should be addressed in further work on the topic. A key limitation is the use of a GNSS-disciplined clock at both the receiver and transmitting satellites. No investigation was made into the holdover capacity of the current system in the event of no GNSS coverage. Additionally, while ionospheric time-delay was identified as a major source of error, other propagation errors were neglected in the study. Finally, a further study should include a broader set of receivers in varying environments and locations, and also in a dynamic setting at sea to better reflect the conditions applicable to maritime navigation.
Author Contributions
This document is part of an MSc thesis at TU Delft, carried out by Ø.B.P., under the supervision of J.v.d.I. and S.-I.R. The full-form thesis is available in the TU Delft repository (https://resolver.tudelft.nl/uuid:ca033952-25d0-43ef-952f-72ca2bbbeba8 (accessed on 18 May 2025)). All authors have read and agreed to the published version of the manuscript.
Funding
This research was part of the project ICING funded by the European Space Agency, NAVISP.
Institutional Review Board Statement
Not applicable.
Informed Consent Statement
Not applicable.
Data Availability Statement
The data presented in this study are available on request from the authors.
Acknowledgments
The authors acknowledge Kongsberg Discovery Seatex for their participation in the ICING project.
Conflicts of Interest
Sven-Ingve Rasmussen and Øyvind Bryhn Pettersen are employed by Space Norway. The authors declare no conflicts of interest.
References
- Kraftig øKning av GPS-Jamming over FINNMARK. Available online: https://www.nrk.no/tromsogfinnmark/kraftig-okning-av-gps-jamming-over-finnmark-1.16309499 (accessed on 3 October 2023).
- Mangedobling av GPS-Jamming Mot Norge. Available online: https://www.nrk.no/tromsogfinnmark/mangedobling-av-gps-jamming-mot-norge-1.16563000 (accessed on 3 October 2023).
- Ambulansefly Kunne Ikke Lande Etter GPS-Utfall. Available online: https://www.tv2.no/nyheter/innenriks/ambulansefly-kunne-ikke-lande-etter-gps-utfall/10397144/ (accessed on 3 October 2023).
- Johnson, G.; Swaszek, P. The Feasibility of R-Mode to Meet Resilient PNT Requirements for e-Navigation. In Proceedings of the 27th International Technical Meeting of the Satellite Division of the Institute of Navigation, ION GNSS 2014, Tampa, FL, USA, 8–12 September 2014. [Google Scholar]
- Šafář, J.; Grant, A.; Williams, P.; Ward, N. Performance Bounds for VDES R-mode. J. Navig. 2020, 73, 92–114. [Google Scholar] [CrossRef]
- Šafář, J.; Shaw, G.; Grant, A.; Haugli, H.C.; Løge, L.; Christiansen, S.E.; Alagha, N. GNSS Augmentation Using the VHF Data Exchange System (VDES). In Proceedings of the 31st International Technical Meeting of The Satellite Division of the Institute of Navigation (ION GNSS+ 2018), Miami, FL, USA, 24–28 September 2018; pp. 1788–1805. [Google Scholar]
- Šafář, J.; Grant, A.; Bransby, M. Performance Bounds for VDE-SAT R-Mode. Int. J. Satell. Commun. Netw. 2021, 41, 134–157. [Google Scholar] [CrossRef]
- Wirsing, M.; Dammann, A.; Raulefs, R. VDES R-Mode Performance Analysis and Experimental Results. Int. J. Satell. Commun. Netw. 2023, 41, 158–177. [Google Scholar] [CrossRef]
- Owens, A.J.; Richardson, T.; Critchley-Marrows, J. The Feasibility of a VDE-SAT Ranging Service as an Augmentation to GNSS for Maritime Applications. In Proceedings of the 34th International Technical Meeting of the Satellite Division of The Institute of Navigation (ION GNSS+ 2021), St. Louis, MO, USA, 20–24 September 2021; pp. 591–616. [Google Scholar]
- ITU-R. Recommendation ITU-R M.2092-1: Technical Characteristics for a VHF Data Exchange System in the VHF Maritime Mobile Band; Geneva, Switzerland, 2022. [Google Scholar]
- World Geodetic System 1984 (WGS 84). Available online: https://earth-info.nga.mil/?dir=wgs84&action=wgs84 (accessed on 6 October 2023).
- Milliken, R.J.; Zoller, C.J. Principle of Operation of NAVSTAR and System Characteristics. Navigation 1978, 25, 95–106. [Google Scholar] [CrossRef]
- Thompson, W.R. On a Criterion for the Rejection of Observations and the Distribution of the Ratio of Deviation to Sample Standard Deviation. Ann. Math. Stat. 1935, 6, 214–219. [Google Scholar] [CrossRef]
- Stephens, M.A. EDF Statistics for Goodness of Fit and Some Comparisons. J. Am. Stat. Assoc. 1974, 69, 730–737. [Google Scholar] [CrossRef]
- Anderson, T.W.; Darling, D.A. Asymptotic Theory of Certain “Goodness of Fit” Criteria Based on Stochastic Processes. Ann. Math. Stat. 1952, 23, 193–212. [Google Scholar] [CrossRef]
- Breivik, K.; Forssell, B.; Kee, C.; Enge, P.; Walter, T. Estimation of Multipath Error in GPS Pseudorange Measurements. Navigation 1997, 44, 43–52. [Google Scholar] [CrossRef]
- Klobuchar, J. Ionospheric Time-Delay Algorithm for Single-Frequency GPS Users. IEEE Trans. Aerosp. Electron. Syst. 1987, AES-23, 325–331. [Google Scholar] [CrossRef]
- European Commission. Ionospheric Correction Algorithm for GALILEO Single Frequency Users. 2016. Available online: https://www.gsc-europa.eu/sites/default/files/sites/all/files/Galileo_Ionospheric_Model.pdf (accessed on 18 May 2025).
- Moré, J.J. The Levenberg-Marquardt Algorithm: Implementation and Theory. In Numerical Analysis; Watson, G.A., Ed.; Springer: Berlin/Heidelberg, Germany, 1978; Volume 630, pp. 105–116. [Google Scholar] [CrossRef]
- Bullock, R. Great Circle Distances and Bearings between Two Locations. MDT. 2007. Available online: https://dtcenter.org/sites/default/files/community-code/met/docs/write-ups/gc_simple.pdf (accessed on 18 May 2025).
- Hu, W.; Farrell, J.A. Technical Note: Derivation of Earth-Rotation Correction (Sagnac) and Analysis of the Effect of Receiver Clock Bias; Technical Note; UC Riverside: Riverside, CA, USA, 2019. [Google Scholar]
- IALA. R0129 Gnss Vulnerability and Mitigation Measures, Edition 3.1. 2012. Available online: https://www.iala.int/product/r0129/ (accessed on 18 May 2025).
Disclaimer/Publisher’s Note: The statements, opinions and data contained in all publications are solely those of the individual author(s) and contributor(s) and not of MDPI and/or the editor(s). MDPI and/or the editor(s) disclaim responsibility for any injury to people or property resulting from any ideas, methods, instructions or products referred to in the content. |
© 2025 by the authors. Licensee MDPI, Basel, Switzerland. This article is an open access article distributed under the terms and conditions of the Creative Commons Attribution (CC BY) license (https://creativecommons.org/licenses/by/4.0/).