
WiFi–Round-Trip Timing (WiFi–RTT) Simultaneous Localisation and Mapping: Pedestrian Navigation in Unmapped Environments Using WiFi–RTT and Smartphone Inertial Sensors †

Abstract
1. Introduction and Background
2. Methodology
2.1. FastSLAM
- The mobile device position and heading are assumed to be known. The landmark coordinates are initialised based on a uniform distribution in the environment, where each landmark will have its own particle filter.
- The PDR model is applied during the prediction step. In this step, the mobile device particles are moved according to the PDR model, with noise distributed according to a Gaussian distribution. The PDR model is described in Section 2.2.
- For the access point update step, the particles of each access point are weighted against the distance between the particle and the estimated mean coordinates of the mobile device using Equation (1). The update step for computing weightings is the step for determining how strongly a particle state matches the state suggested from measurements.
- 4.
- The particles of the mobile device are weighted against their distance from each estimated landmark position; the estimate is based on the mean coordinates of each landmark particle filter.
- 5.
- 6.
- Finally, the position estimate of the mobile device and all landmarks is calculated using the weighted average of the particle positions.
2.2. Pedestrian Dead Reckoning
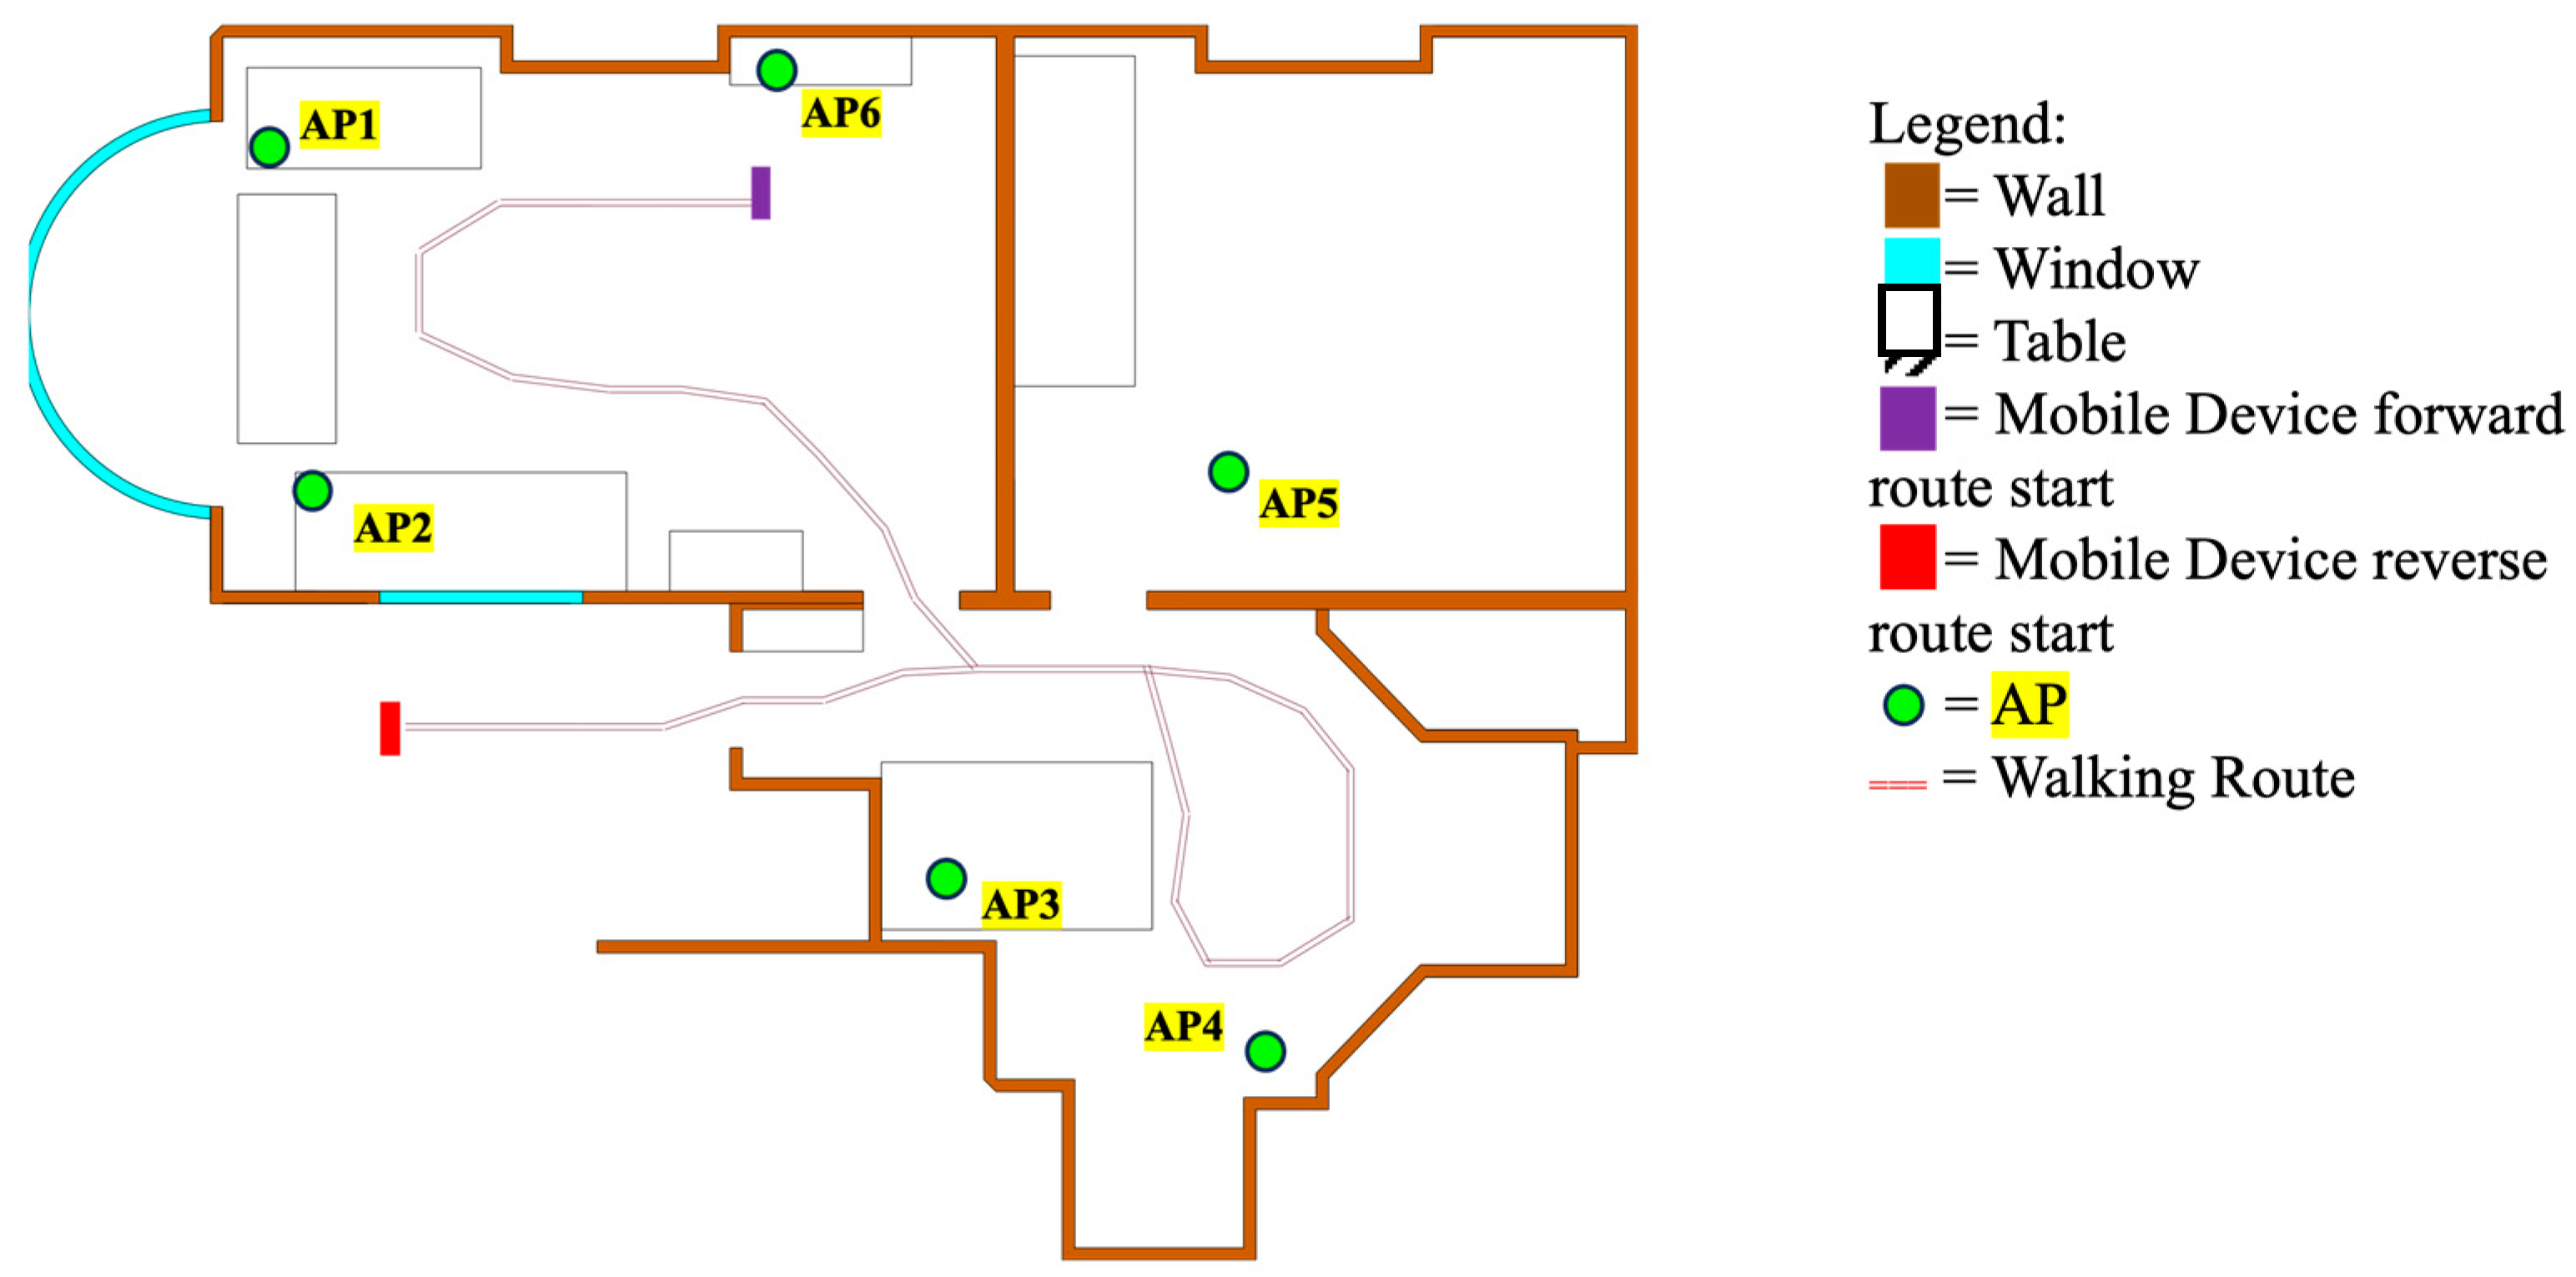
2.3. Experimental Setup
3. Results
4. Conclusions
Author Contributions
Funding
Institutional Review Board Statement
Informed Consent Statement
Data Availability Statement
Conflicts of Interest
References
- Google. Wi-Fi Location: Ranging with RTT. 2022. Available online: https://developer.android.com/guide/topics/connectivity/wifi-rtt (accessed on 2 February 2024).
- Van Diggelen, F.; Want, R.; Wang, W. How to Achieve 1-Meter Accuracy in Android. 2018. Available online: https://www.gpsworld.com/how-to-achieve-1-meter-accuracy-in-android/ (accessed on 2 February 2024).
- Raja, K.J.; Groves, P.D. WiFi-RTT Indoor Positioning Using Particle, Genetic and Grid Filters with RSSI-Based Outlier Detection. In Proceedings of the 36th International Technical Meeting of the Satellite Division of The Institute of Navigation (ION GNSS+ 2023), Denver, CO, USA, 11–15 September 2023; pp. 1644–1655. [Google Scholar]
- Gentner, C.; Ulmschneider, M.; Kuehner, I.; Dammann, A. WiFi-RTT Indoor Positioning. In Proceedings of the 2020 IEEE/ION Position, Location and Navigation Symposium (PLANS), Portland, OR, USA, 20–23 April 2020; pp. 1029–1035. [Google Scholar]
- Guo, G.; Chen, R.; Ye, F.; Peng, X.; Liu, Z.; Pan, Y. Indoor Smartphone Localization: A Hybrid WiFi RTT-RSS Ranging Approach. IEEE Access 2019, 7, 176767–176781. [Google Scholar] [CrossRef]
- Sun, M.; Wang, Y.; Xu, S.; Qi, H.; Hu, X. Indoor Positioning Tightly Coupled Wi-Fi FTM Ranging and PDR Based on the Extended Kalman Filter for Smartphones. IEEE Access 2020, 8, 49671–49684. [Google Scholar] [CrossRef]
- Gentner, C.; Avram, D. WiFi-RTT-SLAM: Simultaneously Estimating the Positions of Mobile Devices and WiFiRTT Access Points. In Proceedings of the 34th International Technical Meeting of the Satellite Division of The Institute of Navigation (ION GNSS+ 2021), St. Louis, MO, USA, 20–24 September 2021; pp. 3142–3148. [Google Scholar] [CrossRef]
- Montemerlo, M.; Thrun, S.; Roller, D.; Wegbreit, B. FastSLAM 2.0: An improved particle filtering algorithm for simultaneous localization and mapping that provably converges. In Proceedings of the 18th International Joint Conference on Artificial Intelligence (IJCAI’03), Acapulco, Mexico, 9–15 August 2003; Morgan Kaufmann Publishers Inc.: San Francisco, CA, USA, 2003; pp. 1151–1156. [Google Scholar]
- Arulampalam, M.S.; Maskell, S.; Gordon, N.; Clapp, T. A Tutorial on Particle Filters for Online Nonlinear/Non-Gaussian Bayesian Tracking. IEEE Trans Signal Process. 2002, 50, 174–188. [Google Scholar]
- Doucet, A. University of British Columbia (no date) Importance Sampling & Sequential Importance Sampling. pp. 1–40. Available online: https://people.eecs.berkeley.edu/~jordan/courses/260-spring10/readings/samsi_lec2.pdf (accessed on 2 February 2024).
- Mikov, A.; Moschevikin, A.; Fedorov, A.; Sikora, A. A localization system using inertial measurement units from wireless commercial hand-held devices. In Proceedings of the International Conference on Indoor Positioning and Indoor Navigation, Montbeliard, France, 28–31 October 2013; pp. 1–7. [Google Scholar] [CrossRef]


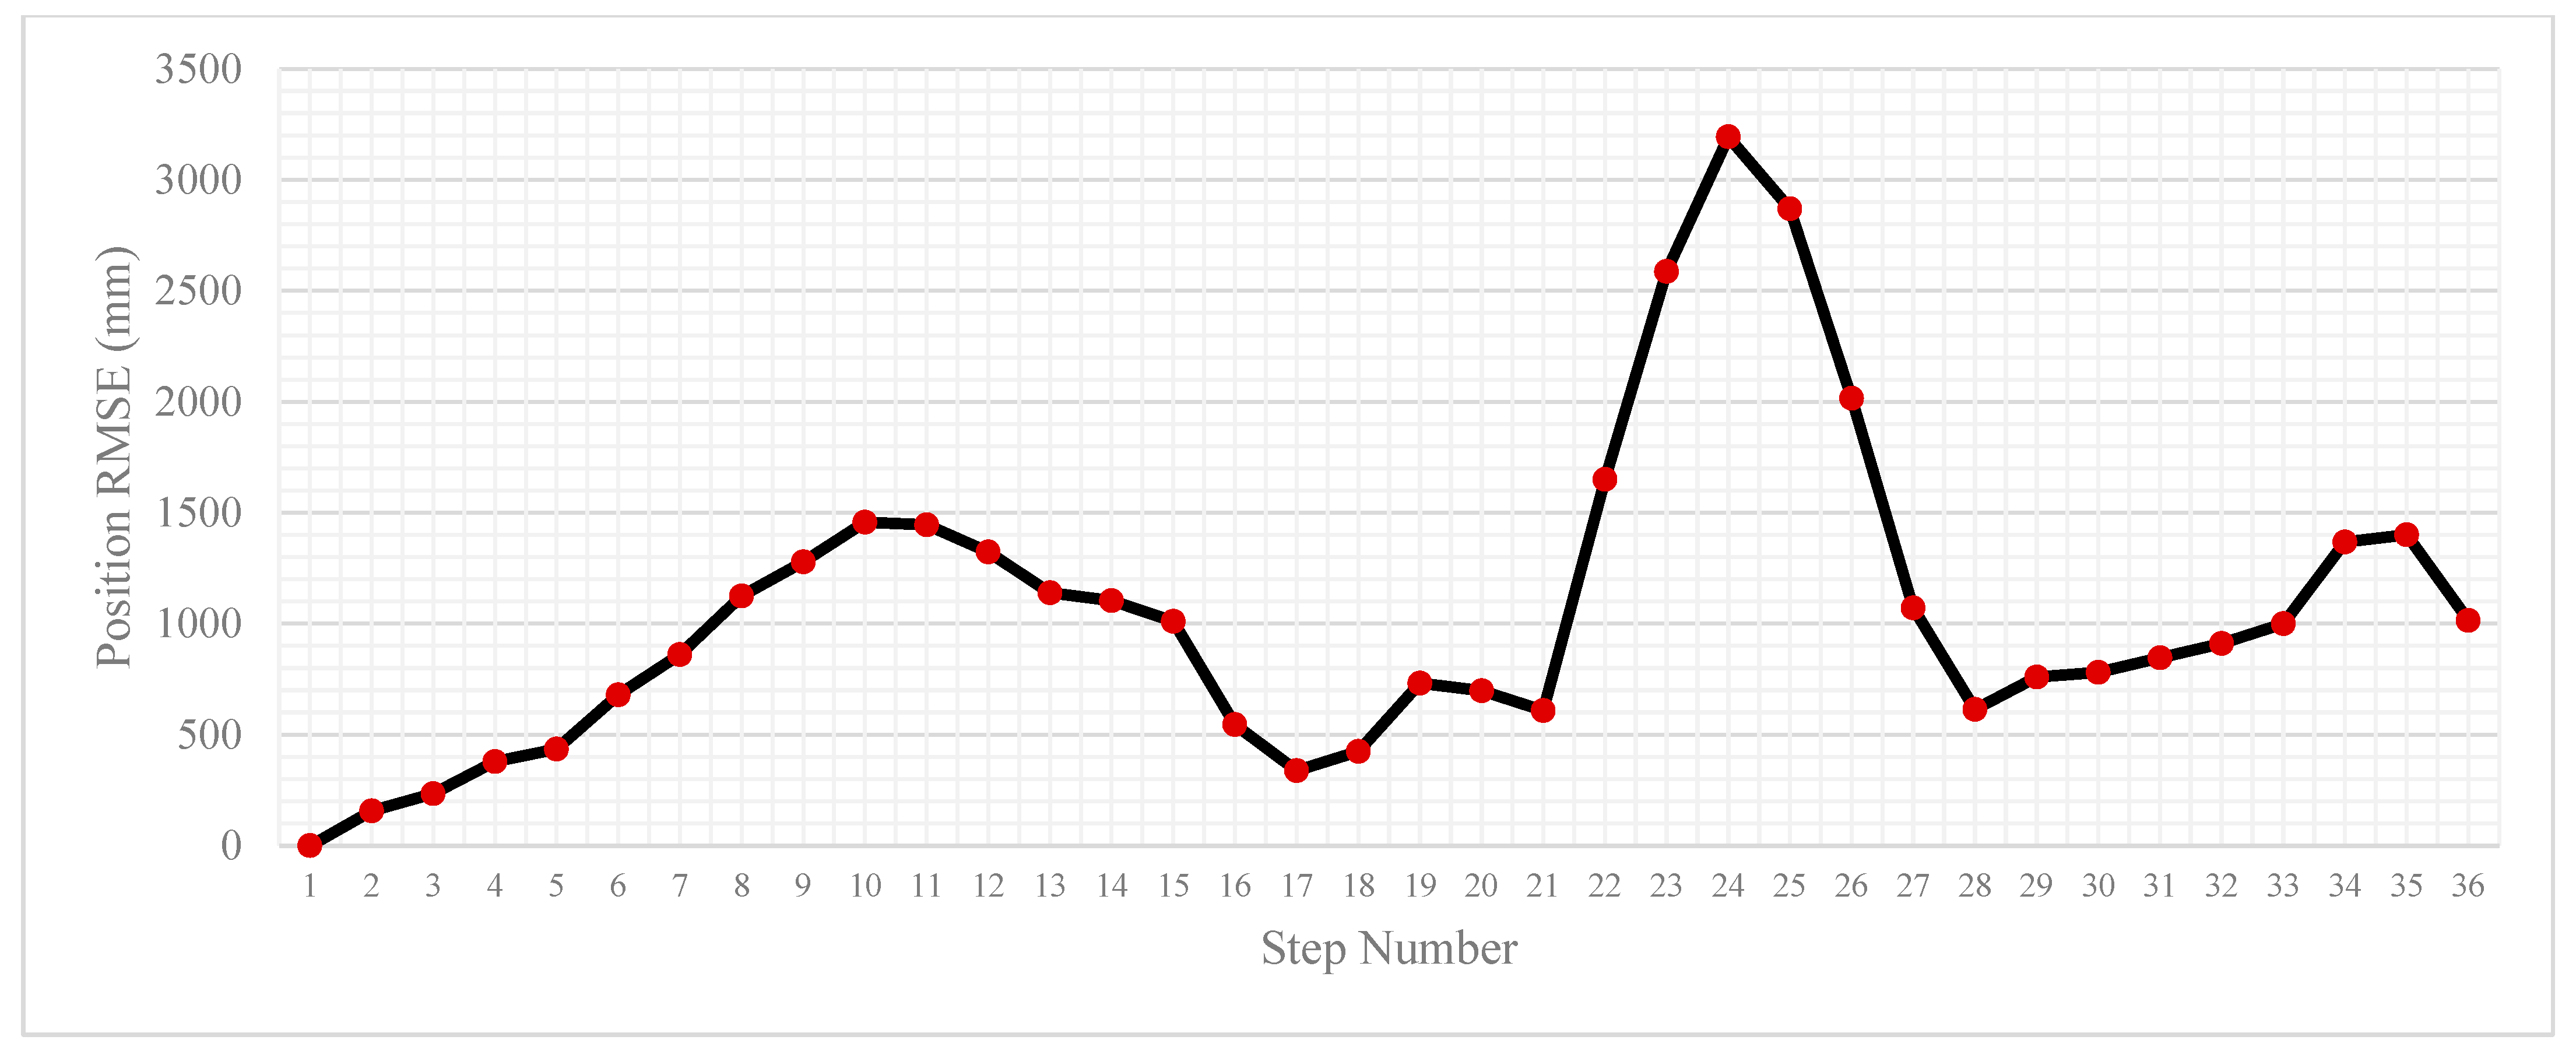
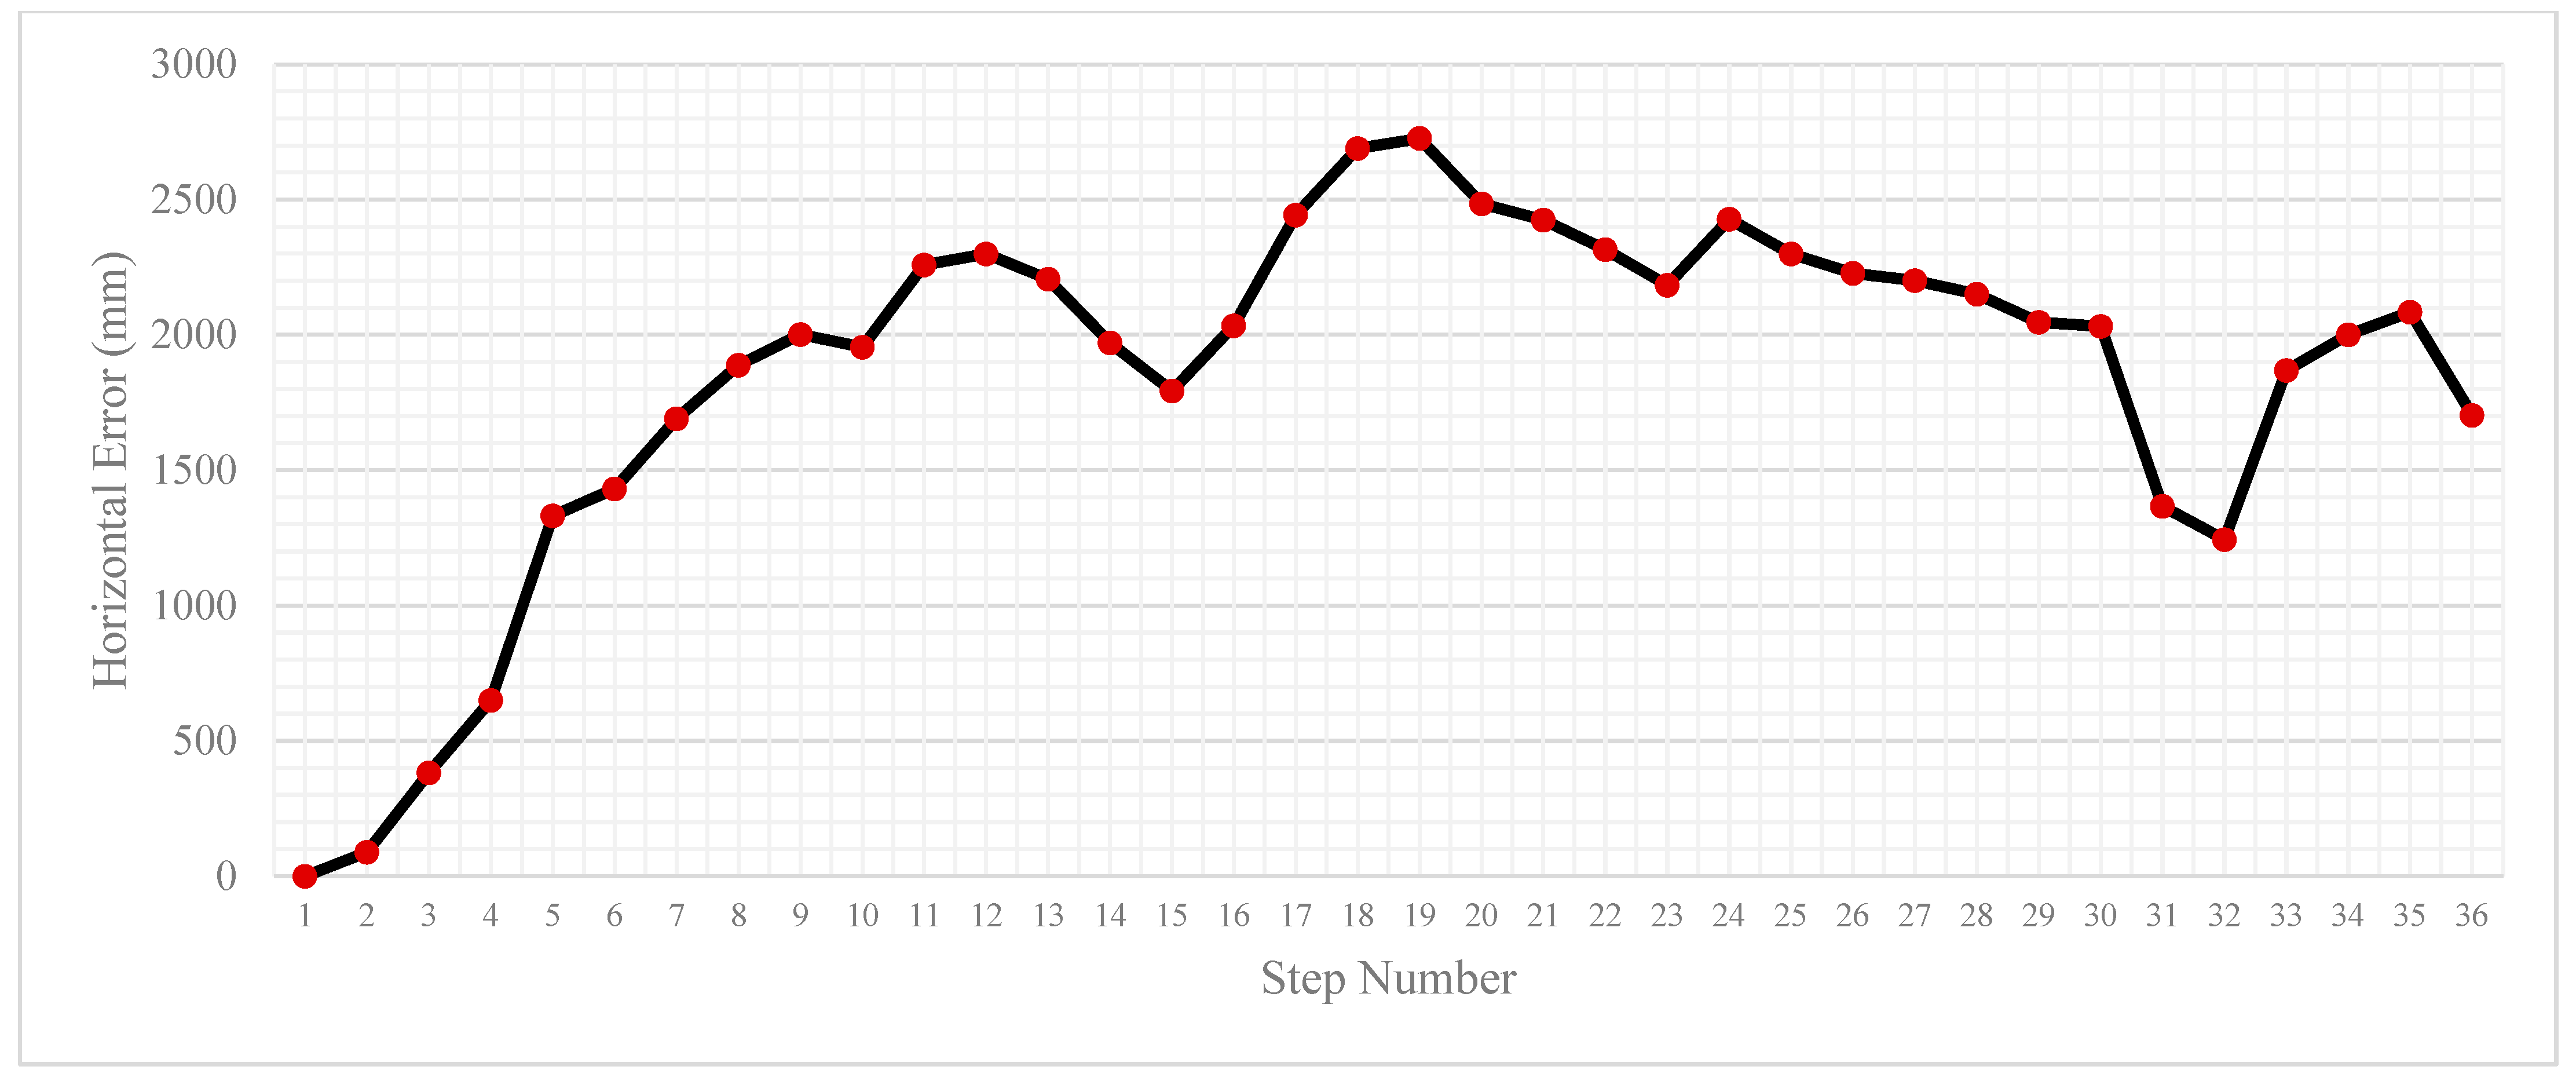
| Trial | Forward | Reverse |
|---|---|---|
| Maximum Horizontal Error (m) | 3.2 | 2.73 |
| Mean Horizontal Error (m) | 1.09 | 1.91 |
| Standard Deviation (m) | 0.69 | 0.59 |
| Median Horizontal Error (m) | 1.00 | 2.03 |
| Final Horizontal Error (m) | 1.01 | 1.7 |
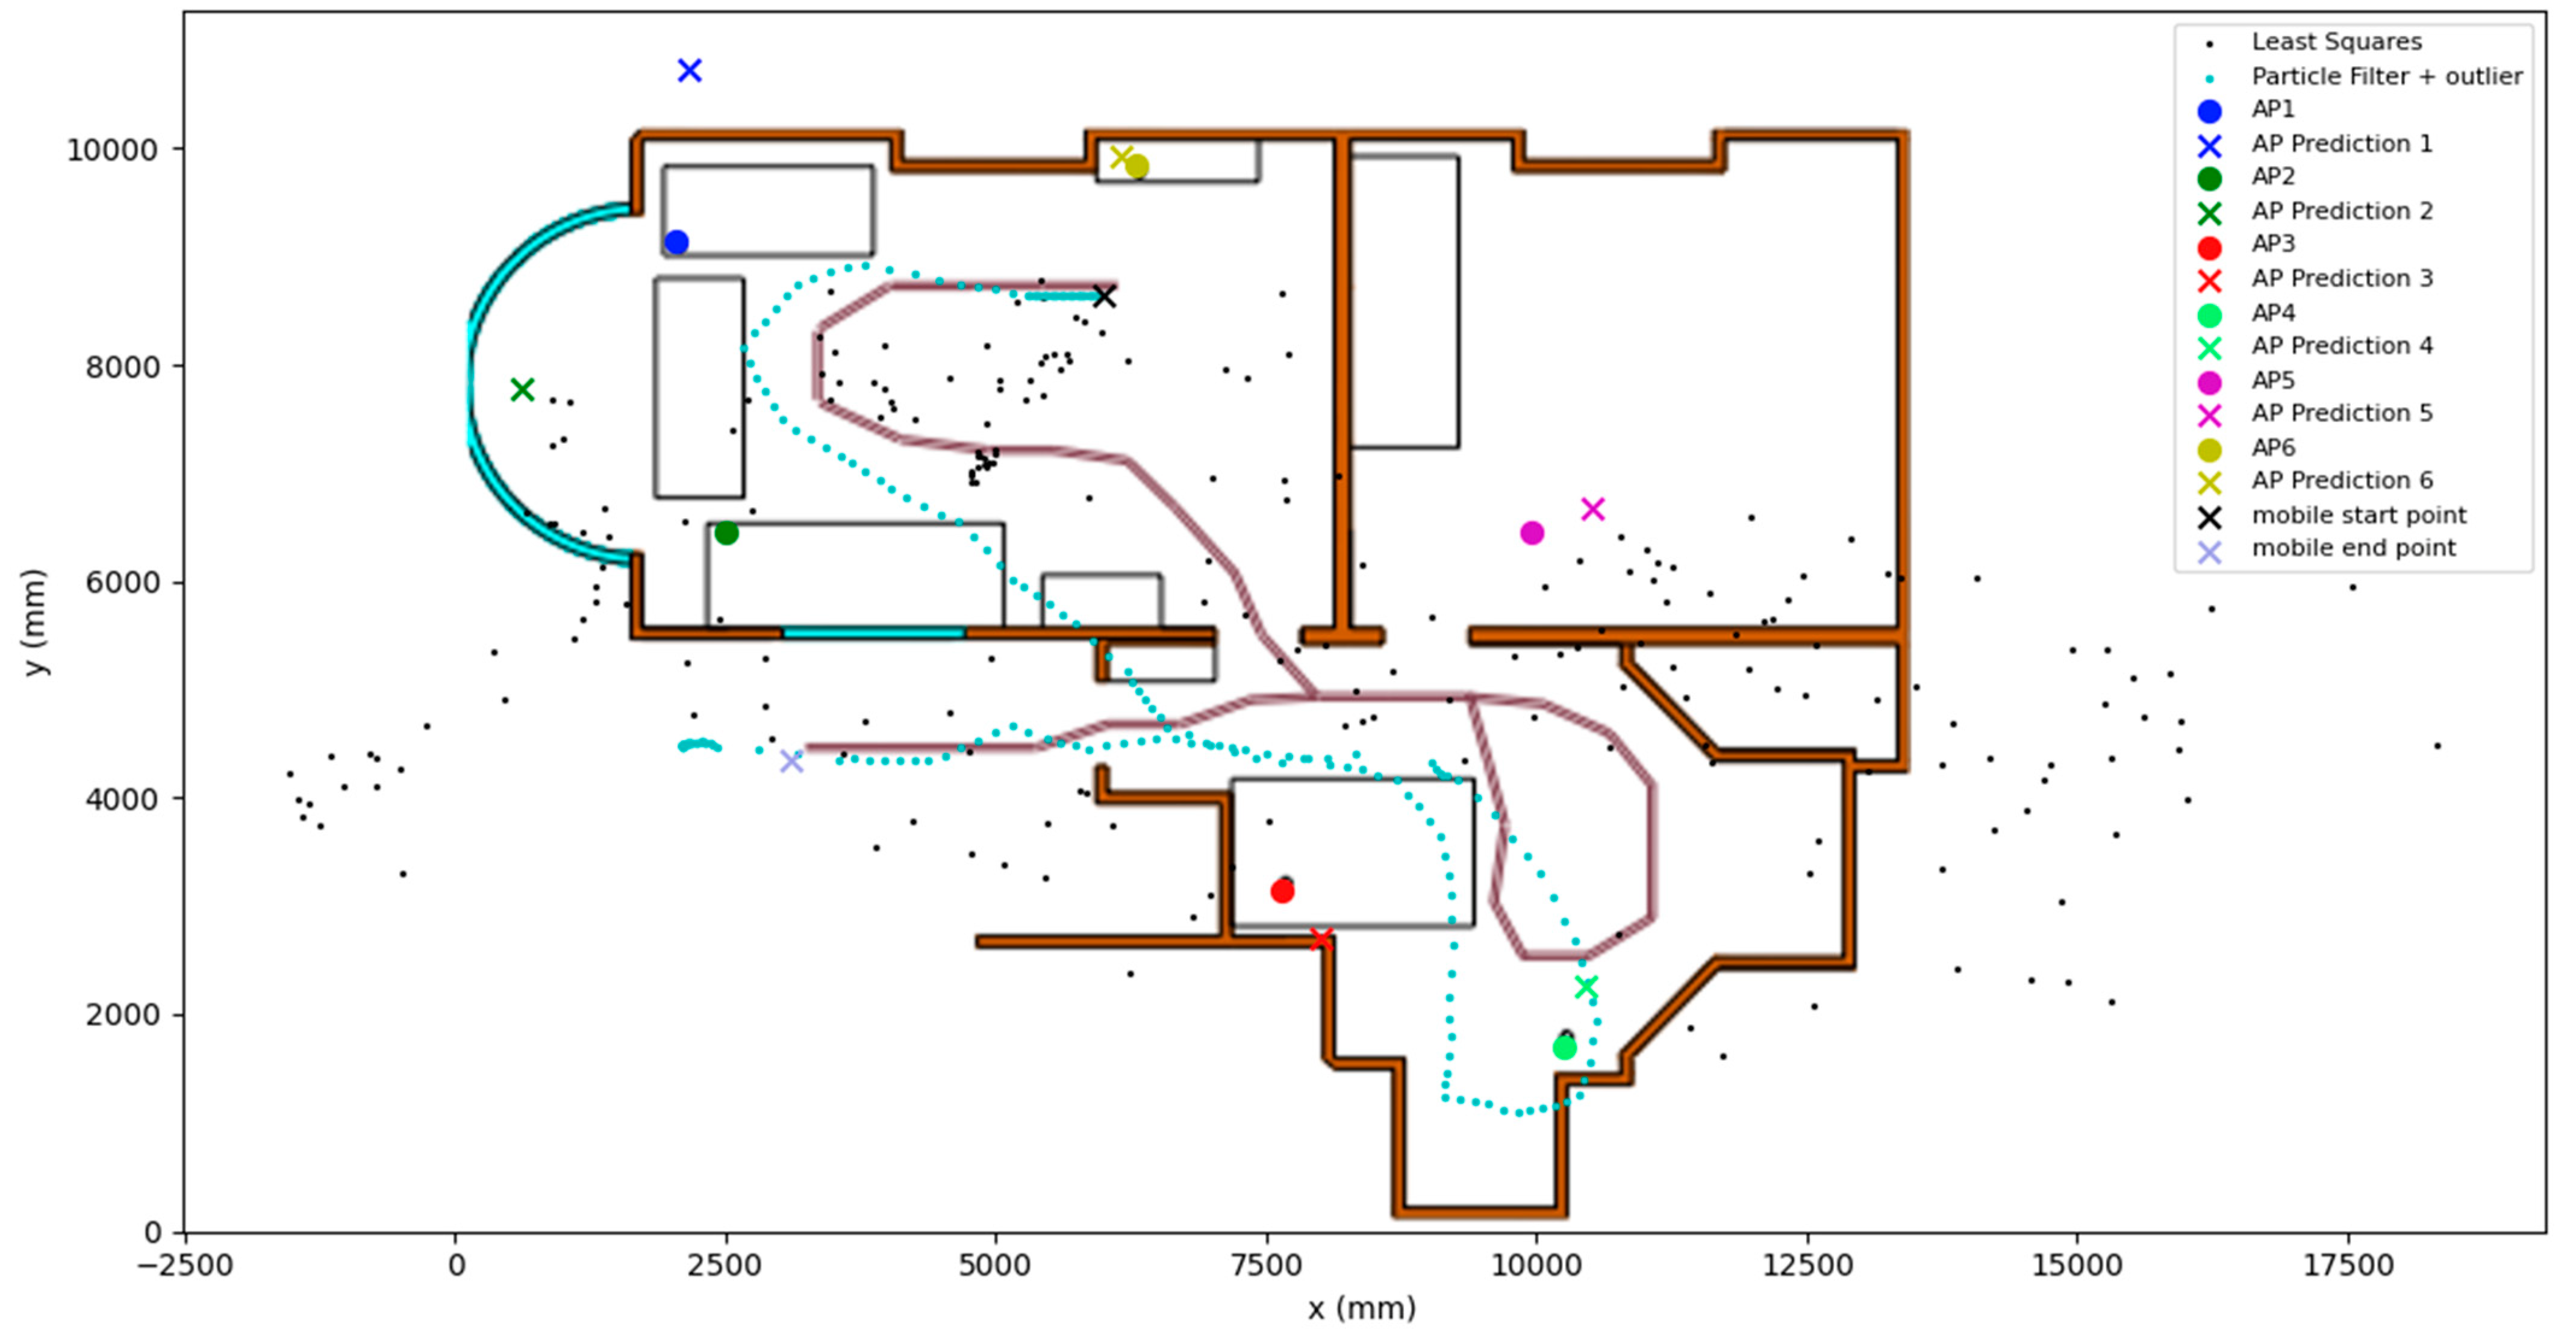
| Landmark | Forward | Reverse |
|---|---|---|
| AP1 Final Position Horizontal Error (m) | 1.59 | 0.78 |
| AP2 Final Position Horizontal Error (m) | 2.31 | 1.73 |
| AP3 Final Position Horizontal Error (m) | 0.58 | 2.4 |
| AP4 Final Position Horizontal Error (m) | 0.59 | 0.94 |
| AP5 Final Position Horizontal Error (m) | 0.61 | 1.21 |
| AP6 Final Position Horizontal Error (m) | 0.16 | 1.32 |
Disclaimer/Publisher’s Note: The statements, opinions and data contained in all publications are solely those of the individual author(s) and contributor(s) and not of MDPI and/or the editor(s). MDPI and/or the editor(s) disclaim responsibility for any injury to people or property resulting from any ideas, methods, instructions or products referred to in the content. |
© 2025 by the authors. Licensee MDPI, Basel, Switzerland. This article is an open access article distributed under the terms and conditions of the Creative Commons Attribution (CC BY) license (https://creativecommons.org/licenses/by/4.0/).
Share and Cite
Raja, K.J.; Groves, P.D. WiFi–Round-Trip Timing (WiFi–RTT) Simultaneous Localisation and Mapping: Pedestrian Navigation in Unmapped Environments Using WiFi–RTT and Smartphone Inertial Sensors. Eng. Proc. 2025, 88, 16. https://doi.org/10.3390/engproc2025088016
Raja KJ, Groves PD. WiFi–Round-Trip Timing (WiFi–RTT) Simultaneous Localisation and Mapping: Pedestrian Navigation in Unmapped Environments Using WiFi–RTT and Smartphone Inertial Sensors. Engineering Proceedings. 2025; 88(1):16. https://doi.org/10.3390/engproc2025088016
Chicago/Turabian StyleRaja, Khalil J., and Paul D. Groves. 2025. "WiFi–Round-Trip Timing (WiFi–RTT) Simultaneous Localisation and Mapping: Pedestrian Navigation in Unmapped Environments Using WiFi–RTT and Smartphone Inertial Sensors" Engineering Proceedings 88, no. 1: 16. https://doi.org/10.3390/engproc2025088016
APA StyleRaja, K. J., & Groves, P. D. (2025). WiFi–Round-Trip Timing (WiFi–RTT) Simultaneous Localisation and Mapping: Pedestrian Navigation in Unmapped Environments Using WiFi–RTT and Smartphone Inertial Sensors. Engineering Proceedings, 88(1), 16. https://doi.org/10.3390/engproc2025088016