Proceeding Paper

Correlation Between Nutrient Concentration and Leaf Optical Attenuation Coefficient of Brassica Rapa (Pechay) as Measured by Time-Domain Optical Coherence Tomography System †

1
Environment and Remote Sensing Research (EARTH) Laboratory, Department of Physics, College of Science, De La Salle University, 1004 Taft Avenue, Manila 0922, Philippines
2
Graduate School of Engineering, Chiba University, 1-33 Yayoi-cho, Inage-ku, Chiba 263-8522, Japan
3
Division of Physical Sciences and Mathematics, College of Arts and Sciences, Miagao Campus, University of the Philippines Visayas, Miagao 5023, Philippines
*
Authors to whom correspondence should be addressed.
Presented at the 5th International Electronic Conference on Applied Sciences, 4–6 December 2024; https://sciforum.net/event/ASEC2024.
Eng. Proc. 2025, 87(1), 62; https://doi.org/10.3390/engproc2025087062
Published: 9 May 2025

Abstract

:
This study explores the relationship between nutrient concentration (NC) and epidermal thickness (d) of the leaves of hydroponically grown Brassica rapa and its attenuation coefficients (m) using portable Time-Domain Optical Coherence Tomography (TD-OCT), which is a non-invasive imaging technique that uses low-coherence interferometry to generate axial scans of plants’ leaves by measuring the time delay and intensity of backscattered light. The portable TD-OCT system in this study has an axial and lateral resolution of 7 m and 3 m, respectively, a scanning depth of 12 mm, and a 1310 nm Super Luminescent Diode (SLD). Several studies suggest that the differences in d and m are related to nutritional, physiological, and anatomical status. The study used the Kratky method, a simple non-circulating hydroponic system, to cultivate Brassica rapa with varying NC (25%, 50%, 75%, 100% (control), and 125%). Each treatment group used two plants. The TD-OCT sample probe was placed on a fixed holder and was oriented vertically so that light was directed downward onto the leaf’s surface to obtain the depth profile (A-scan). The distance between the probe and the leaf was adjusted to obtain the optimum interference signal. Five averaged A-scans were obtained per leaf on the 7th, 18th, and 21st days post nutrient exposure. The logarithm of the averaged A-scan is linearly fitted to extract m. The results showed a positive correlation between NC and m, which suggests that plants produce more chlorophyll and develop denser cells and increase m. There was no correlation obtained between NC and d. The study demonstrates the potential of TD-OCT as a non-destructive tool for assessing plant health and monitoring growth dynamics in hydroponic systems and m as a sensitive indicator of plant health as compared to d. The continued exploration of TD-OCT applications in agriculture can contribute to improving crop management strategies and promoting sustainable food production practices.

1. Introduction

The world faces the challenge of food insecurity and a growing global population, leading to increased food demand. Conventional agriculture struggles with challenges such as limited land availability, declining soil quality, and the impact of natural disasters and climate change on soil conditions [1,2].
Hydroponics can result in higher yields, better product quality, and more efficient water usage than traditional soil-based cultivation [3]. Hydroponics also reduces the risk of soil-borne diseases and eliminates the need for weeding and spraying. Separate studies of bamboo (B. vulcasa) and calamansi (C. microcarpa) used optical coherence tomography (OCT) to assess health. They found that both their extinction coefficients (EC) show a decrease in unhealthy or stressed leaves, noting that the epidermal layer in both studies shows a greater change, suggesting it may be more sensitive to environmental stress [4,5]. An inexpensive portable time domain (TD)-OCT system that was custom built in the laboratory from research by [4] was used for this study, obtaining A-scan profiles of unhealthy and healthy leaves to determine the epidermal thickness and the attenuation coefficients that can be used in correlating it with the health of the leaf and the plant as well. This OCT system is equipped with a long optical-path scanning mechanism, which is effective for measuring thick objects like fruits and vegetables and examining changes in water content, decay, and vegetation condition [6].
This study aims to explore the relationship between nutrient concentration and leaf thickness in hydroponically grown Brassica rapa (pechay), using a TD-OCT system, and demonstrate the utility of the system as a non-destructive method for assessing plant health. The researchers used Brassica rapa (Pechay) as it is easy to grow and germinate and has a short life cycle. Similarly to cabbages, they are both grown hydroponically in sustainable farming, but pechay leaves have flat leaves which are suitable for OCT use. The experiment was conducted in a hydroponic system as a way to promote hydroponics as a low-cost alternative to agricultural production in urban areas and especially to the less fortunate communities. Additionally, since the hydroponics technique obtains nutrients directly from the solution, one is free to manipulate the nutrient concentration in the solution according to the plant’s needs.

2. Methodology

Brassica rapa seedlings were cultivated in sterilized coco peat until they were 10 days old and then transplanted into Styrofoam cups with holes for drainage. These cups were then placed in Styrofoam boxes, each containing 16 L of nutrient solution, for the hydroponic setup, shown in Figure 1. The researchers used the Kratky method, a passive hydroponic system that does not require air pumps due to its cost effectiveness in urban and semi-urban areas with limited farming space and growing food needs [7]. The nutrient solution level was maintained below the cups to create an air pocket for root oxygenation. Each box contained six plants, two designated for data collection and four additional plants to maximize the setup’s utilization.

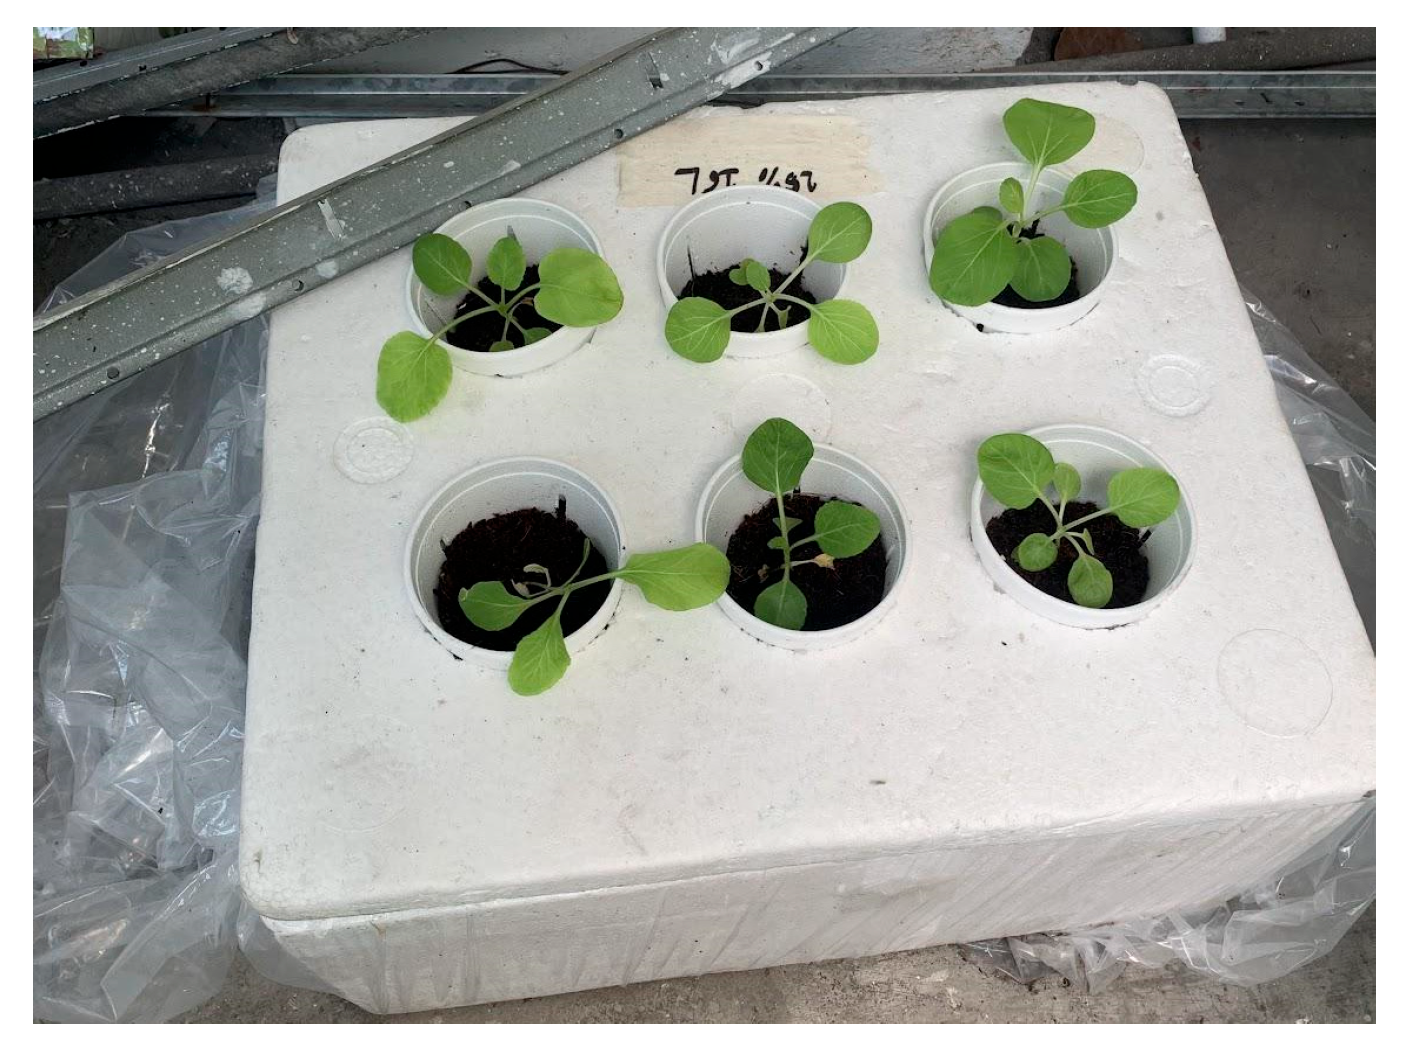
2.1. Nutrient Solution

Five different nutrient concentrations were prepared using commercially available SNAP (simple nutrient addition program) hydroponics solutions A and B: 25%, 50%, 75%, 100% (control), and 125%, and these are summarized in Table 1. Brassica rapa (pechay), just like any other plants, requires essential macronutrients and micronutrients which are found in this hydroponic solution and can thus be used directly without the need to add any elements. The SNAP solutions were mixed according to the manufacturer’s recommendations, with adjustments made for the 16 L volume of growing boxes. SNAP A was added to the water first, followed by SNAP B, to prevent the precipitation of insoluble compounds. To ensure chlorine removal, the water used for nutrient solutions was exposed to air for 24 h before mixing. The researchers also measured the total dissolved solids (TDS) of the solutions weekly to confirm differences in nutrient levels across the treatment groups.
Table 1 shows five different nutrient concentrations prepared using commercially available simple nutrient addition program (SNAP) hydroponics solutions A and B: 25%, 50%, 75%, 100% (control), and 125%. The SNAP solutions were mixed according to the manufacturer’s recommendations, with adjustments made for the 16 L volume of the growing boxes. The ideal concentration recommended by the manufacturer would be for 100% which is 25 mL of SNAP A and 25 mL of SNAP B added in 10 liters of water. Since the container’s capacity is 16 L, there was an additional concentration of SNAP A and SNAP B for every 1 L of water added. Hence, the column for total amount added shows the mixture of the concentration with 16 L of water. SNAP A was added to the water first, followed by SNAP B, to prevent the precipitation of insoluble compounds. To ensure chlorine removal, the water used for the nutrient solutions was left exposed to air for 24 h before mixing.

2.2. OCT and Data Acquisition

The study utilized a TD-OCT system to measure leaf characteristics. Table 2 shows the information on the age of the plant and the dates when data collection was administered. Data were collected on days 7, 18, and 21 after transplanting the seedlings into the hydroponic setups. The leaves were kept intact on the plants to minimize signal fluctuations during measurements. The region of interest (ROI) on each leaf was located midway between the leaf tip and base.
At least five A-scans (depth profiles) were taken from each ROI using the TD-OCT system. Background noise was measured by scanning a blank sample and then subtracted from the leaf A-scans. Deviating data points were removed, and the remaining A-scans were averaged. An example of the A-scan is in Figure 2a. The data collection intervals and the age of the Brassica rapa plants at the time of data collection did not follow repetitive time-space patterns due to class suspensions resulting from calamities. However, the specific dates of data gathering do not have a significant role that can affect the output of the research, because all samples were grown at the same time and transplanted to hydroponics on the same dates.

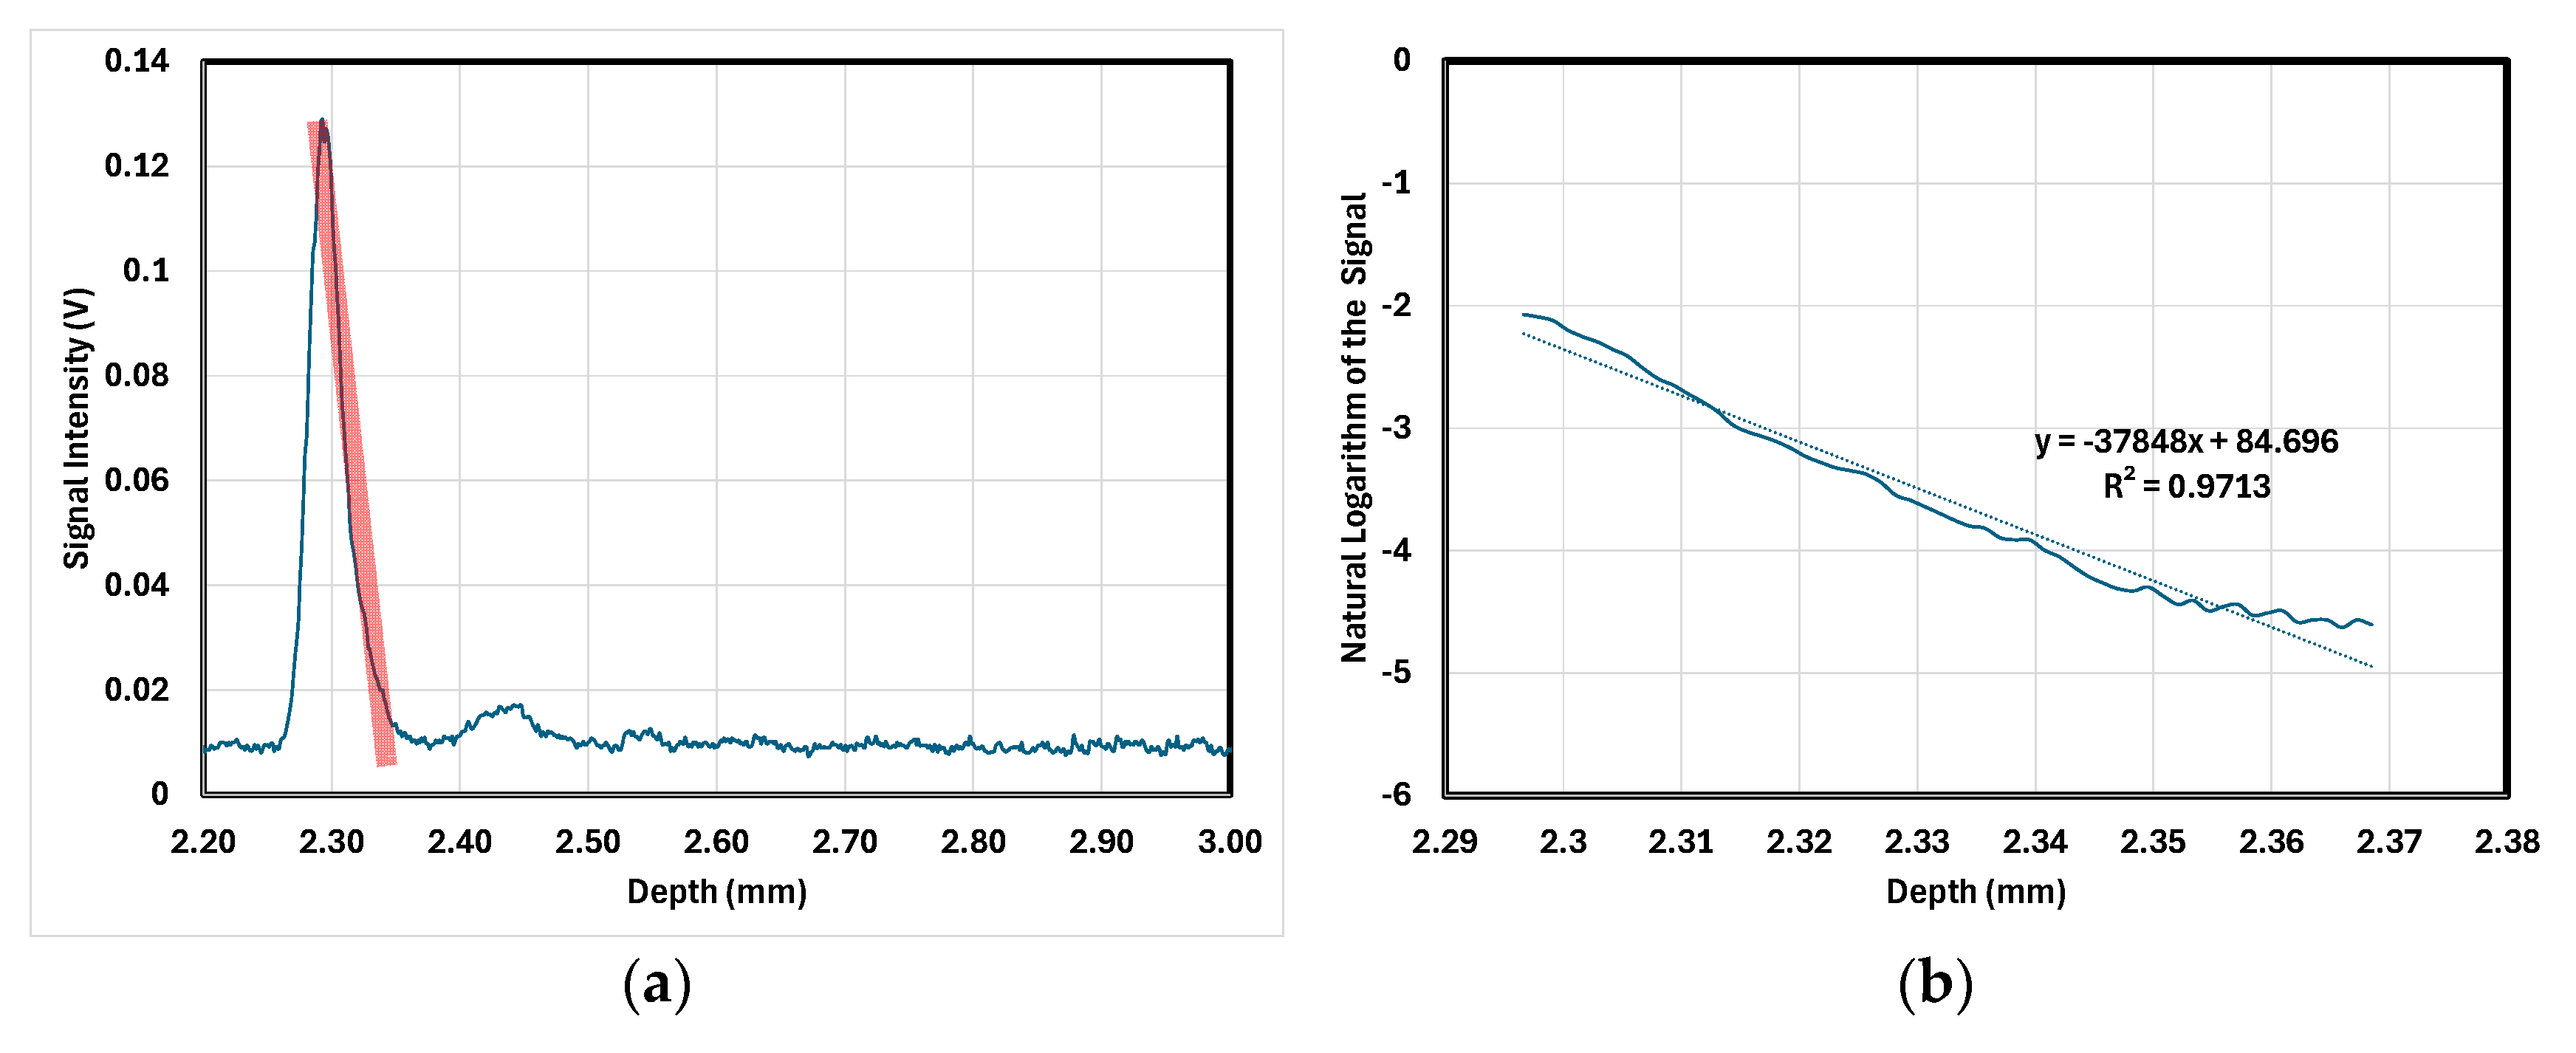
2.3. Attenuation Coefficient Determination

Figure 2b shows the selected region from Figure 2a needed for the computation, which is the peak of the curve (which is the surface) until its base. The line of the best fit was also taken and displayed in the graph. The absolute value of the slope was taken and converted to the appropriate unit of the attenuation coefficient (1/mm). This was taken from Beer–Lambert’s equation for OCT when the natural logarithm was taken for both sides:
ln I I 0 = 2 m z
where from the equation of the line, y would be ln (I/I0), and the slope would be 2m and m is the attenuation coefficient. Therefore, to obtain the attenuation coefficient, the slope is taken and divided by 2 before converting into (1/mm) by dividing it by 1000.
The correlation between epidermal thickness and the plant’s photosynthetic rate is measured through an increase in the layer’s thickness which causes a higher attenuation coefficient, thereby affecting photosynthetic activity [4]. The peak for the graphs is the upper epidermis, which is responsible for protecting the internal layers of the leaves, which would be the site for photosynthesis. The thickness can reveal how growth and photosynthetic rate can be improved [8].

2.4. RGB Histogram of the Leaves

Olympus BX51 Fluorescence Microscope was used with Nikon Nis-Elements Version 4.60.00 as the software. After taking the A-scans of the last batch of OCT, the same plants were visualized using the fluorescence microscope by cutting the region of interest and placing it on the glass slides. The RGB histogram and graph (frequency vs. intensity) were taken.

3. Results and Discussion

3.1. General Observation

Without any measuring tools/assessment, it can still be observed that the plants on different nutrient levels differ in terms of the size of the leaf, the size of the plant, and the colors of the leaves. Using Tycon Systems TP3000WC ProWeatherStation, the average outdoor temperature was 30 °C, ranging from 26.6 °C to 35.1 °C. The Brassica rapa plant thrives and grows even in this condition, but it is recommended that Brassica rapa be planted during cool seasons. The average humidity was recorded at 70%; the ideal range in growing hydroponics is 50–80% relative humidity [9].

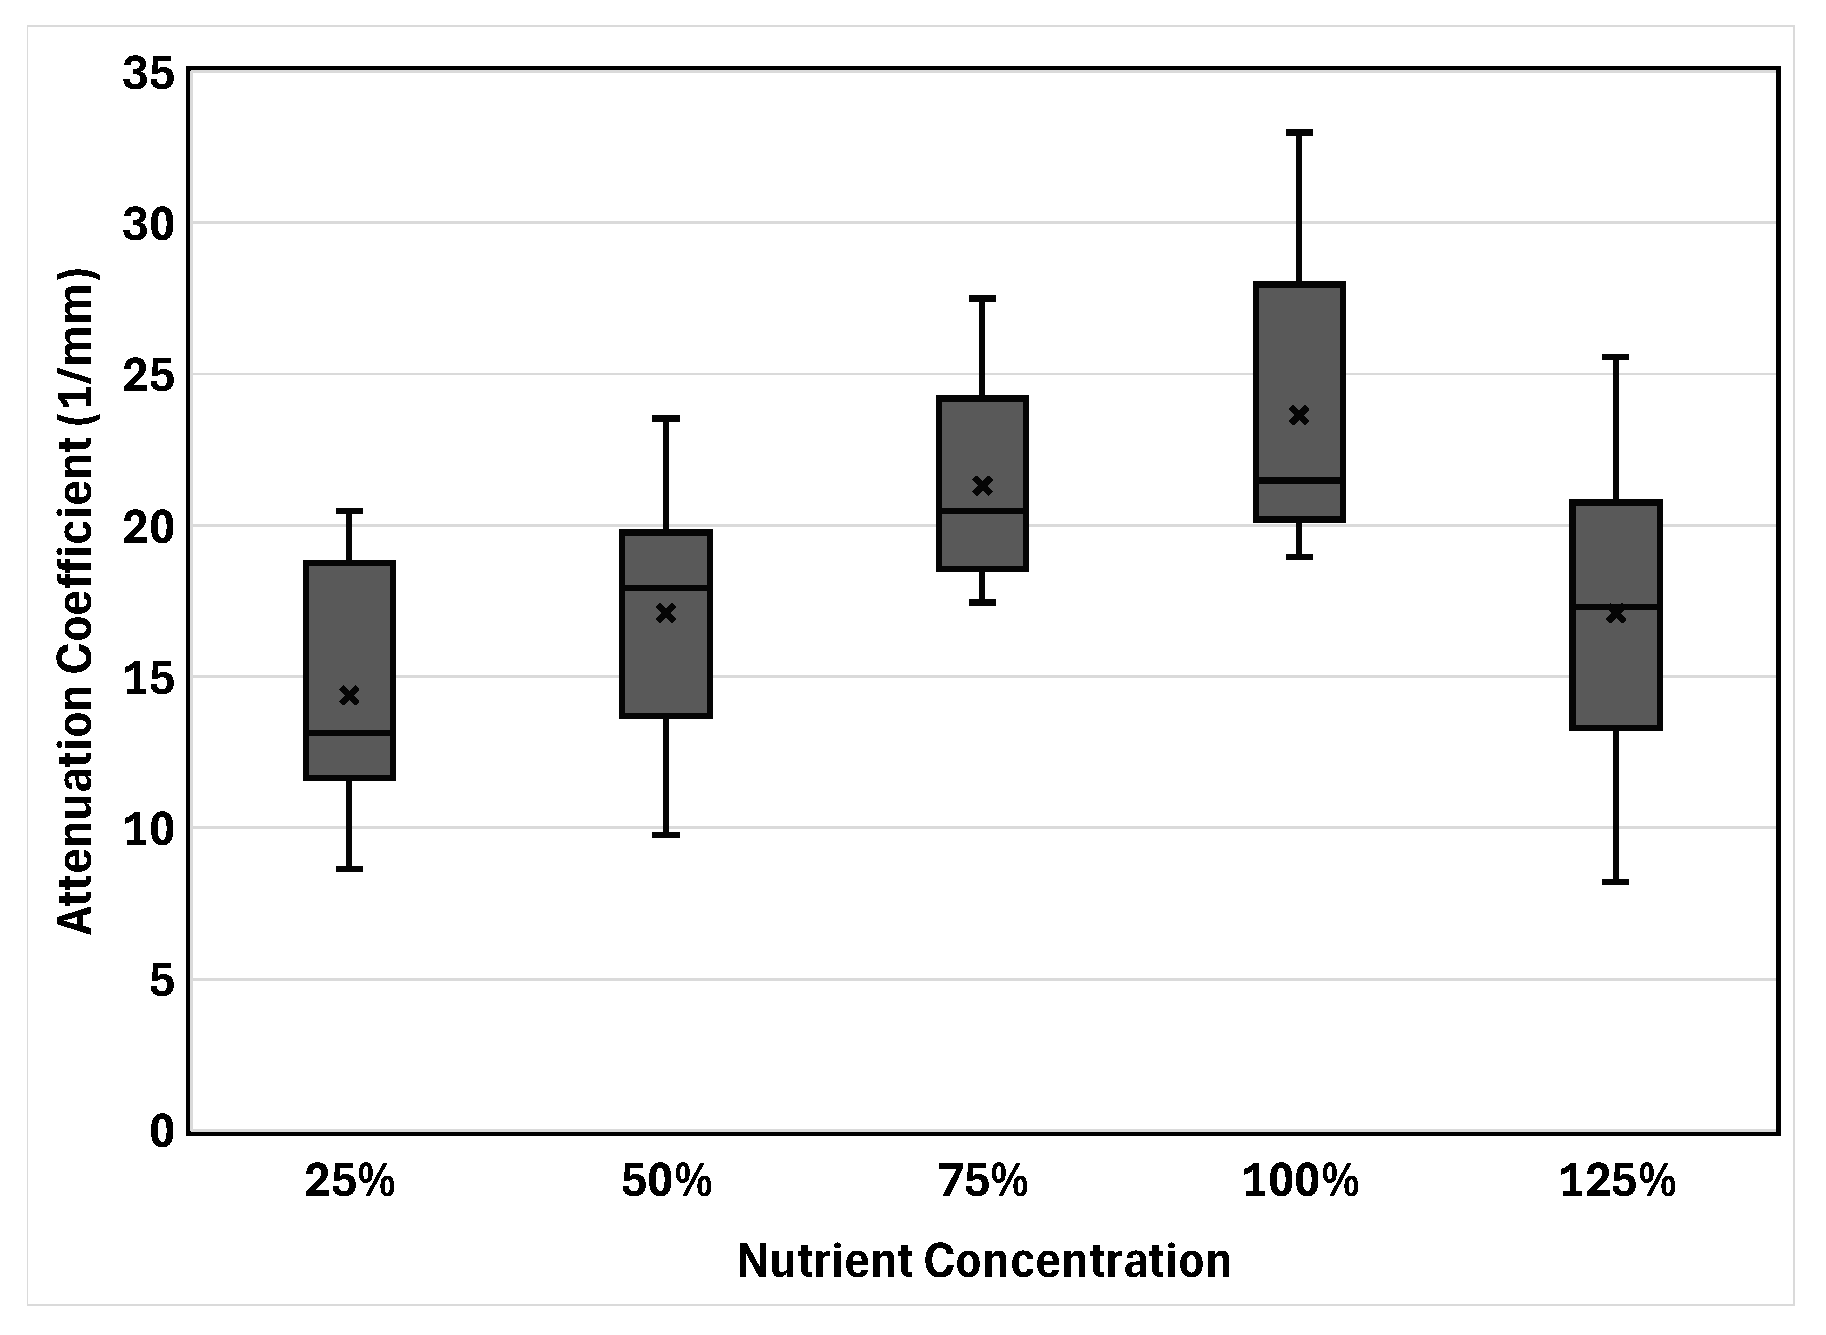
3.2. Attenuation Coefficient

Figure 3 shows that the attenuation coefficient analysis, a measure of how quickly light is attenuated as it passes through a medium, revealed that plants grown with the recommended nutrient mixture (100%) consistently had the highest attenuation coefficient. Plants treated with 75% nutrient concentration had the second highest attenuation coefficients, followed by those treated with 125% (oversaturated), 50%, and 25%. This suggests optimal nutrient supply enhances light absorption and scattering within the leaf tissue, potentially indicating healthier photosynthetic activity. However, there was no clear pattern of a gradual increase or decrease in attenuation coefficient with increasing nutrient concentrations.
Regarding the hypothesis on determining the correlation of leaf thickness from the attenuation coefficient, there was no trend derived in both attenuation coefficient and thickness measurements, which could be attributed to inconsistencies in the positioning of the leaves under the TD-OCT probe as this is highly significant and causes signal fluctuations, variability in leaf morphology, and impacts on attenuation coefficient. Variations in the ROI being scanned could have introduced variability in the data, making it difficult to establish definitive relationships.

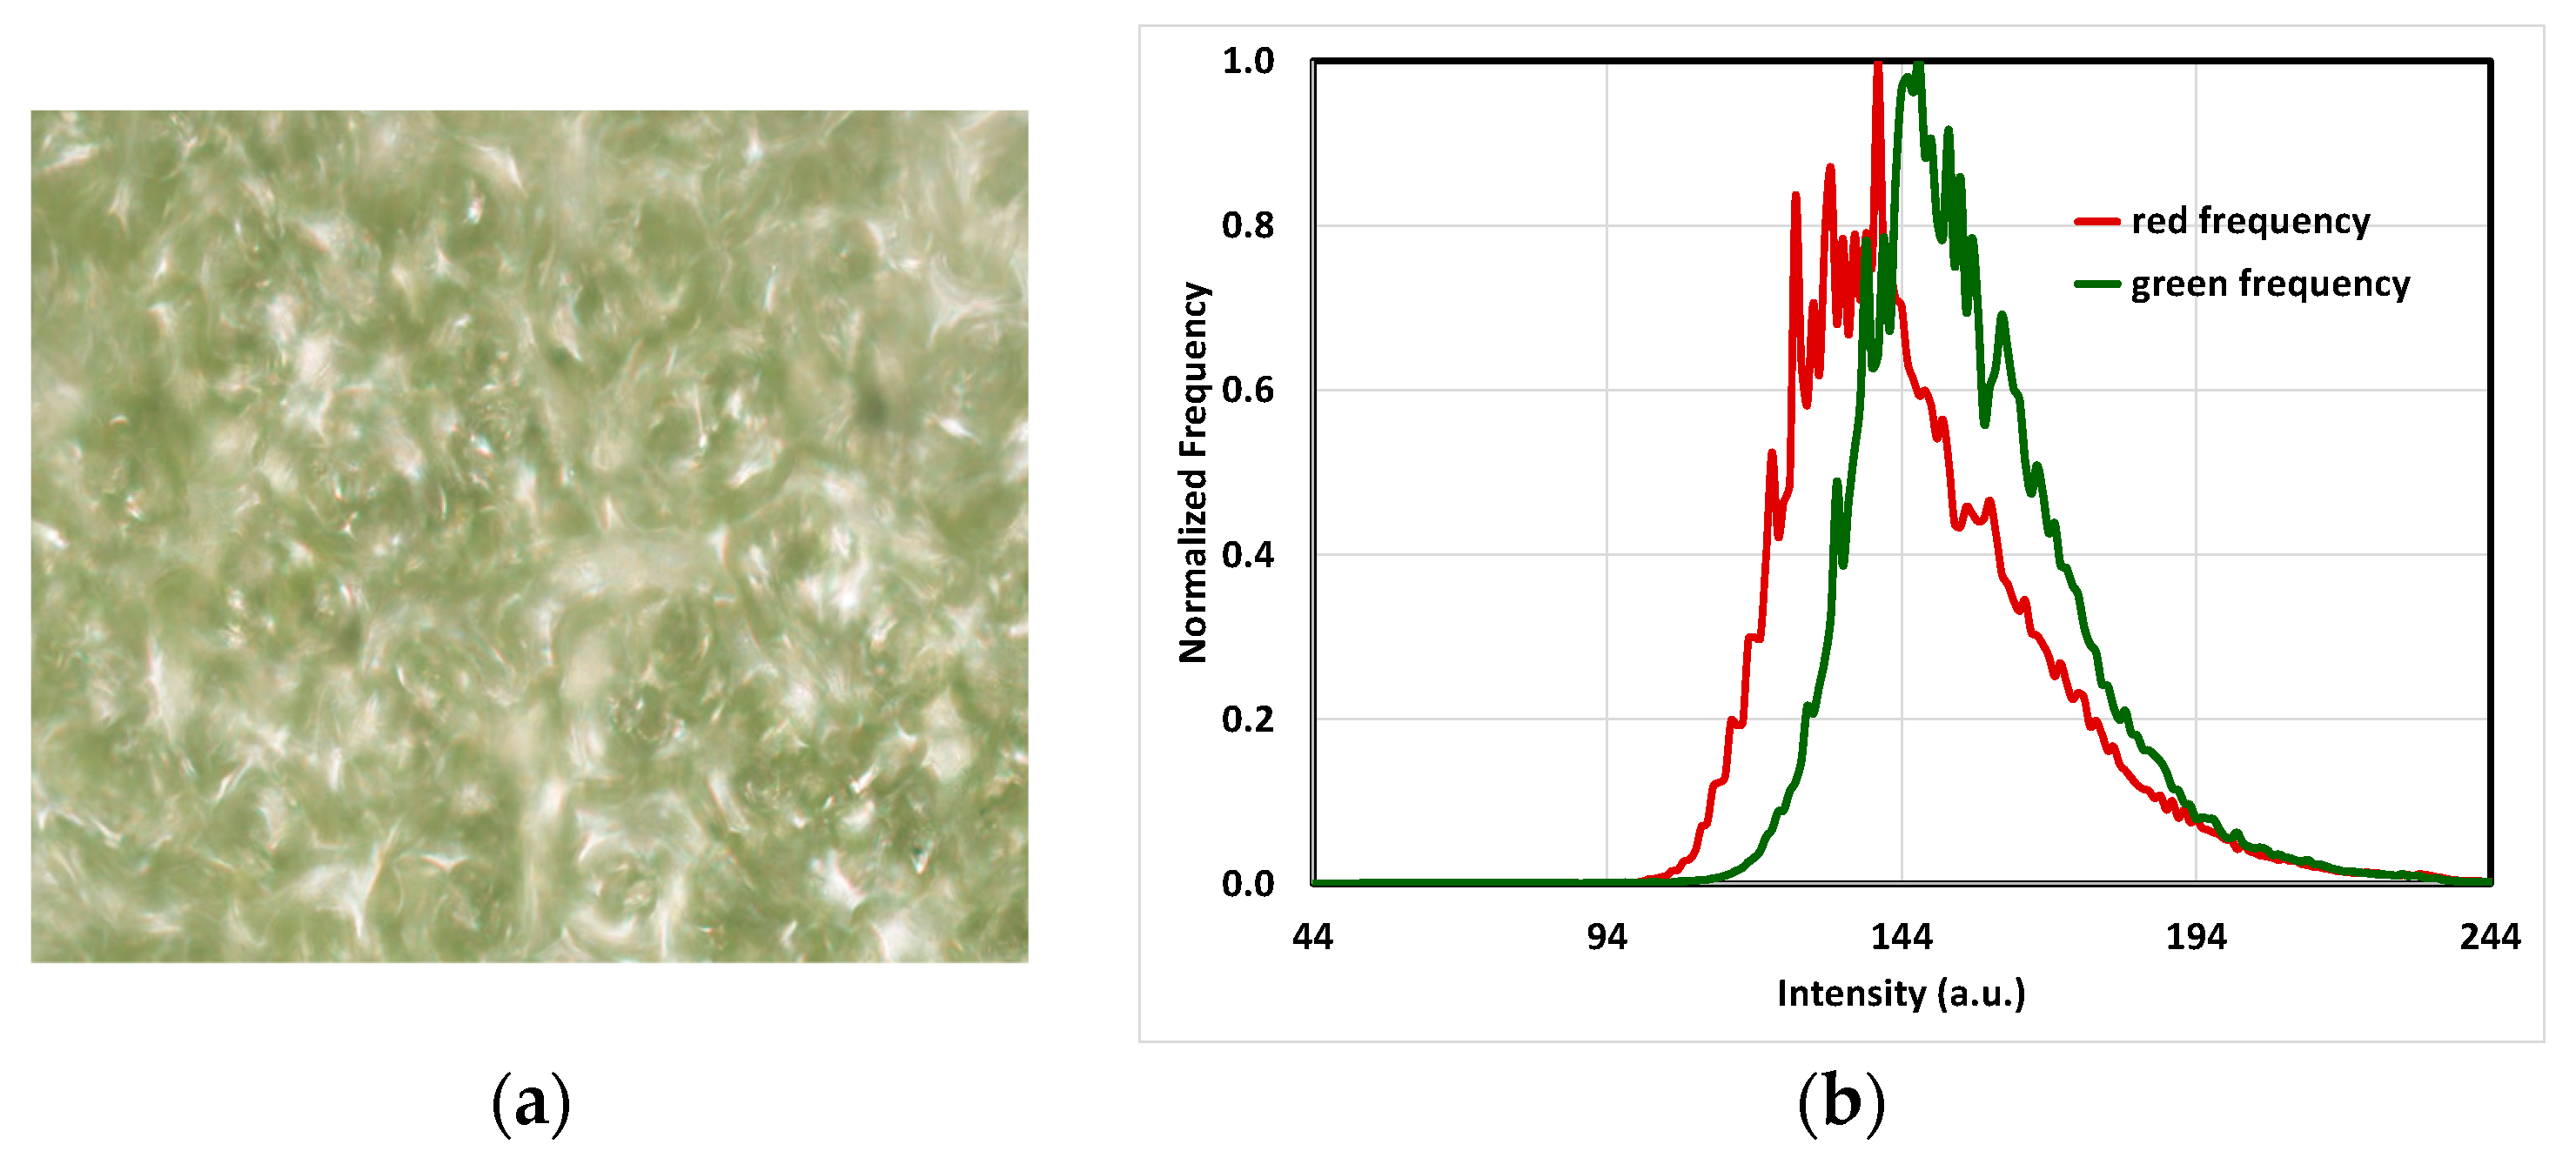
3.3. RGB Graphs and Microscopic Images

RGB images, like the one shown in Figure 4a, of the leaf samples, were also captured using fluorescence microscopy as stated in a previous study [10]. The RGB histograms were analyzed, focusing on the green channel intensity as an indicator of chlorophyll content. It was found that all the plants, regardless of the nutrient treatment, showed similar green channel intensity peaks shown in Figure 4b, suggesting consistent chlorophyll levels across the different concentrations.
The normalized ratios of green (535 nm) to red (575 nm) on intensities and frequencies were calculated from the RGB data. A one-way ANOVA test on the normalized intensity ratios and on the normalized frequency ratios was performed to compare the effect of treatment levels. Table 3 shows the summary of the results. The results on normalized intensity ratios showed no significant difference between the treatment groups, further supporting the observation of consistent chlorophyll content. However, the ANOVA test on the normalized frequency ratios revealed a statistically significant difference, which might reflect variations in the distribution of pixel intensities within the leaf images rather than actual differences in chlorophyll content. Both results from normalized ratios validate the visual nature of the leaf samples becoming increasingly green in hue, but further studies are needed to validate their healthiness alone. These findings do not determine the exact chlorophyll content of the plant samples, but instead, only possible insights on its probable chlorophyll content, as this is only based on pixel intensity.

3.4. Physiological Analysis Based on the Observed Trends

The variations in pigment concentrations, particularly chlorophyll, could explain the differences in attenuation coefficients [11]. A higher attenuation coefficient in the control group (100%) might indicate a higher chlorophyll concentration, leading to more excellent light absorption in the red region of the spectrum. This explanation is supported by studies linking pigment concentration to light attenuation in leaf tissues [12,13]. While pigment concentration, particularly chlorophyll, is a significant factor influencing the attenuation coefficient, other factors related to the physical structure, water content, and the presence of other light-interacting components within the leaf can also contribute to the observed differences in attenuation coefficients. The study also suggests that differences in cellular density and organization within the leaf tissue could contribute to light scattering and absorption variations, influencing the attenuation coefficient. A denser cellular structure could lead to more scattering events, potentially increasing the attenuation coefficient.

4. Conclusions and Recommendations

This study highlights the potential of TD-OCT as a tool for assessing plant health and investigating the effects of nutrient concentration on leaf characteristics. While there was no clear correlation between leaf thickness and nutrient levels, the attenuation coefficient measurements provide insights into the relationship between nutrient supply and light absorption in Brassica rapa leaves. The RGB analysis suggests that the plants maintain relatively consistent chlorophyll levels even under varying nutrient conditions. It is recommended that future studies refine the TD-OCT measurement techniques and address the inconsistencies in leaf positioning during data gathering. Additionally, conducting experiments in controlled environments is recommended to minimize the influence of external factors which are the variabilities and uncertainties associated with traditional soil-based farming such as temperature and climate change. Expanding the sample size and exploring the correlation between the attenuation coefficient and actual chlorophyll content through biochemical analysis could strengthen the findings. Further investigation of the relationship between attenuation coefficient, RGB graph patterns, and leaf thickness variations is also recommended.

Author Contributions

Conceptualization, M.C.G., T.D.T. and M.E.W.; methodology, M.C.G., T.D.T., J.B., J.R.L. and M.E.W.; formal analysis, M.C.G., T.D.T., M.E.W., J.B., J.R.L., J.C., E.V., M.N.T. and T.S.; investigation, M.C.G., T.D.T., M.E.W., J.B., J.R.L., J.C., E.V., M.N.T. and T.S.; resources, M.C.G., T.D.T., M.E.W., J.B., J.R.L., J.C., E.V., M.N.T. and T.S.; writing—T.D.T. and M.E.W.; writing—review and editing, M.C.G. and T.D.T.; visualization, M.C.G. and T.D.T.; supervision, M.C.G.; funding acquisition, M.C.G. and T.S. All authors have read and agreed to the published version of the manuscript.

Funding

This project was made possible with the support of the Commission on Higher Education (CHED) through the project entitled “Development of a Portable Optical Coherence Tomography System for the Evaluation of Human Skin Analogues.”

Institutional Review Board Statement

Not applicable.

Informed Consent Statement

Not applicable.

Data Availability Statement

The data presented in this study are available at the request of the corresponding author.

Acknowledgments

The authors acknowledge the Commission on Higher Education (CHED) of the Philippine Government for funding the project entitled “Development of a Portable Optical Coherence Tomography System for the Evaluation of Human Skin Analogues”. The authors would like to acknowledge support from the Department of Agriculture-Bureau of Plant Industry, Dexter’s Apiary.

Conflicts of Interest

The authors declare no conflicts of interest.

References

  1. Armas, K.; Catherine, B.; Dela, C. Financial Viability of Business Models For Engineered Vertical Hydroponics Systems For Sustainable Onion Production in The Philippines. J. Appl. Eng. Technol. Sci. 2023, 4, 864–872. [Google Scholar] [CrossRef]
  2. Siaton, A.; Ferrater-Gimena, J.; Legaspi, E.; Naraja, M. The Underlying Concerns Defying Organic Farmers in the Philippines. Int. J. Res. Commer. Manag. Stud. 2023, 5, 47–103. [Google Scholar] [CrossRef]
  3. Verdoliva, S.G.; Gwyn-Jones, D.; Detheridge, A.; Robson, P. Controlled comparisons between soil and hydroponic systems reveal increased water use efficiency and higher lycopene and β-carotene contents in hydroponically grown tomatoes. Sci. Hortic. 2021, 279, 109896. [Google Scholar] [CrossRef] [PubMed]
  4. Galvez, M.C.D.; de Lara, R.; Mandia, P.; Vallar, E.; Macalalad, E.; Shiina, T. Leaf Structure and Attenuation Coefficients of Citrofortunella Microcarpa Leaves Using a Portable TD-OCT System. ECS Trans. 2022, 107, 2243–2253. [Google Scholar] [CrossRef]
  5. Cadondon, J.; Halapit, H.; Vallar, E.; Shiina, T.; Galvez, M.C. In-situ Optical Measurement of Bamboo Leaf Health Status Using 1310-nm TD- OCT System. In Proceedings of the DLSU Research Congress 2024; De La Salle University: Manila, Philippines, 2024; Volume 12, E-ISSN 2449-3309; Available online: https://www.dlsu.edu.ph/wp-content/uploads/pdf/conferences/research-congress-proceedings/2024/SEE-26.pdf (accessed on 25 January 2025).
  6. Shiina, T.; Moritani, Y.; Ito, M.; Okamura, Y. Long-optical-path scanning mechanism for optical coherence tomography. Appl. Opt. 2003, 42, 3795–3799. [Google Scholar] [CrossRef] [PubMed]
  7. Gumisiriza, M.S.; Ndakidemi, P.A.; Mbega, E.R. A simplified non-greenhouse hydroponic system for small-scale soilless urban vegetable farming. MethodsX 2022, 9, 101882. [Google Scholar] [CrossRef] [PubMed]
  8. Flores, H.M.C.M.; Qiumado, M.O.; Tinio, C.E.; Maldia, L.S.J.; Combalicer, M.S. Morphological and leaf anatomical characteristics of Narra (Pterocarpus indicus) variants. Philipp. J. Sci. 2021, 150, 219–229. [Google Scholar]
  9. Acero, L. Growth Response of Brassica rapa on the Different Wavelength of Light. Int. J. Chem. Eng. Appl. 2013, 4, 6. [Google Scholar] [CrossRef]
  10. Bulan, J.; Cadondon, J.; Lesidan, J.R.; Vallar, E.; Galvez, M.C. Transmittance Properties of Healthy and Infected Coffee Robusta Leaves with Coffee Leaf Miner (CLM) Pests. Eng. Proc. 2023, 56, 9. [Google Scholar] [CrossRef]
  11. Cadondon, J.; Vallar, E.; Galvez, M.C.; Shiina, T. Microstructure, Extinction Coefficient, and Chlorophyll Content of Philippine Bamboo Leaves by a Portable TD-OCT Scanner. In Proceedings of the 13th International Conference on Photonics, Optics and Laser Technology—PHOTOPTICS, Porto, Portugal, 22–24 February 2025; pp. 114–119, ISBN 978-989-758-736-8, ISSN 2184-4364. [Google Scholar] [CrossRef]
  12. Gitelson, A.; Solovchenko, A. Non-invasive quantification of foliar pigments: Possibilities and limitations of reflectance-and absorbance-based approaches. J. Photochem. Photobiol. B Biol. 2018, 178, 537–544. [Google Scholar] [CrossRef] [PubMed]
  13. Yamada, N.; Fujimura, S. A mathematical model of reflectance and transmittance of plant leaves as a function of chlorophyll pigment content. In International Geoscience and Remote Sensing Symposium, ‘Remote Sensing: Moving Toward the 21st Century’; IEEE: New York, NY, USA, 1988; Volume 2, pp. 833–834. [Google Scholar]
Figure 1. The experimental setup following the Kratky method of hydroponics.
Engproc 87 00062 g001
Figure 2. A-scan after converting time to depth: (a) the region of interest is indicated by the red line where the attenuation coefficient will be measured; (b) plot of depth vs. natural logarithm of the signal showing the equation of the line.
Engproc 87 00062 g002
Figure 3. Box plot of the optical attenuation coefficients of the Brassica rapa plants treated with different nutrient concentrations.
Engproc 87 00062 g003
Figure 4. (a) An example RGB image of the leaf; (b) Normalized intensity distribution of red and green channels from an RGB image of a leaf at 25% concentration (less healthy).
Engproc 87 00062 g004
Table 1. Nutrient concentration mixture.
Nutrient25%50%75%100% (Control)125%
* SNAP A (in mL)6.2512.518.7525.0031.25
* SNAP B (in mL)6.2512.518.7525.0031.25
Total amount of SNAP A added (in mL)1020304050
Total amount of SNAP B added (in mL)1020304050
* Additional concentration for every 1 L (in mL).
Table 2. Dates for data collection.
BatchAge of Brassica rapa Plant (Days)Number of Days
Submerged in Nutrient Solution
Date
12978 July 2024
2391819 July 2024
3422122 July 2024
Table 3. A summary of the One-way ANOVA test on the normalized intensity and frequency ratios.
StatisticsNormalized Intensity RatiosNormalized Frequency I535/575 Ratios
Number of Groups55
Total Sample Size50963673
Grand Mean~1.001~1.743
F-statistic0.01297.02
p-value0.99970
F-critical (α = 0.05)2.374
Significance Level (α)0.050.05
SS Between Groups0.55763285.2737
SS Within Groups59,089.718231,051.3868
SS Total59,090.275834,336.6605
ConclusionNo significant differenceSignificant difference between groups
Disclaimer/Publisher’s Note: The statements, opinions and data contained in all publications are solely those of the individual author(s) and contributor(s) and not of MDPI and/or the editor(s). MDPI and/or the editor(s) disclaim responsibility for any injury to people or property resulting from any ideas, methods, instructions or products referred to in the content.

