Abstract
Modern applications of molecular liquid crystals span from high-resolution displays for augmented and virtual reality to miniature tunable lasers, reconfigurable microwave devices for space exploration and communication, and tunable electro-optical elements, including spatial light modulators, waveguides, lenses, light shutters, filters, and waveplates, to name a few. The tunability of these devices is achieved through electric-field-induced reorientation of liquid crystals. Because the reorientation of the liquid crystals can be altered by ions normally present in mesogenic materials in minute quantities, resulting in their electrical resistivity having finite values, the development of new ways to control the concentration of the ions in liquid crystals is very important. A promising way to enhance the electrical resistivity of molecular liquid crystals is the addition of nano-dopants to low-resistivity liquid crystals. When nanoparticles capture certain ions, they immobilize them and increase their resistivity. If properly implemented, this method can convert low-resistivity liquid crystals into high-resistivity liquid crystals. However, uncontrolled ionic contamination of the nanoparticles can significantly alter this process. In this paper, building on our previous work, we explore how physical parameters such as the size of the nanoparticles, their concentration, and their level of ionic contamination can affect the process of both enhancing and lowering the resistivity of the molecular liquid crystals. Additionally, we analyze the use of two types of nano-dopants to achieve better control over the electrical resistivity of molecular liquid crystals.
1. Introduction
Recently, liquid crystals have substantially expanded their range of applications. In addition to being used as materials for conventional and high-resolution displays for virtual and augmented reality, liquid crystals are important components of tunable electro-optical devices such as filters, spatial light modulators, light diffusers, waveplates, lenses, miniature lasers, waveguides, and numerous reconfigurable microwave devices [1,2,3,4,5,6,7]. The reorientation of liquid crystals under the influence of an applied electric field enables the tunability of liquid crystal electro-optical devices.
Ions present in liquid crystals in minute quantities can compromise the electro-optical performance of liquid crystal devices and lead to undesirable energy consumption [8,9]. Therefore, developing new methods to control ions in liquid crystals is critical for their existing and emerging applications. A promising approach to reducing the concentration of mobile ions in liquid crystals and increasing their resistivity can be found by merging the ideas of liquid crystals and nanotechnology [10,11,12]. Nanomaterials added to liquid crystals can capture ions and substantially increase their electrical resistivity [11,12]. For practical applications, it is important to achieve a several-order increase in electrical resistivity using this method. Recently, we analyzed the role of nanoparticle size and its ability to capture ions for enhancing the electrical resistivity of liquid crystals [13]. The analysis indicates that it is possible to achieve several orders of magnitude enhancement in resistivity if small (~5 nm) nanoparticles with strong ion-capturing properties are used. These results align with recently reported experimental findings showing a two-order increase in the electrical resistivity of liquid crystals recovered from end-of-life liquid crystal displays [14,15].
In principle, it is possible to convert low-resistivity liquid crystals to high-resistivity liquid crystals using nanomaterials that efficiently capture and immobilize ions. However, this process can be affected by the ionic contamination of nanoparticles. In this paper, to mitigate the problem of ionic contamination of nanoparticles, we propose using two types of nanodopants dispersed in liquid crystals simultaneously. The use of two types of nanomaterials allows for better control over the electrical resistivity of liquid crystals. The use of two types of nanomaterials to control the electrical resistivity of liquid crystals has not been reported in the literature and constitutes the scientific novelty of this paper.
2. Model
Interactions between ions and nanoparticles in molecular liquid crystals result in changes in the concentration of mobile ions. In the simplest case, we can assume symmetrical monovalent positive and negative ions of equal mobility and volume concentration .
The Langmuir adsorption model, originally developed by Langmuir [16], can be applied to ions in molecular liquid crystals to describe ion adsorption/desorption on the surface of alignment layers or electrodes (if alignment layers are not used) [17]. Similarly, this model can describe interactions between ions and nanoparticles in liquid crystals [11,12]. The applicability and limitations of the Langmuir adsorption model for ions in molecular liquid crystals containing nanoparticles are discussed in several papers [11,12]. If two types of nanoparticles are used, the corresponding rate equation is given by Equation (1).
where the first term describes the decrease in ion density due to the adsorption of ions on the surface of type 1 nanoparticles. The second term accounts for a similar process occurring with type 2 nanoparticles. The third and fourth terms represent an increase in the concentration of mobile ions due to the desorption of ions from type 1 and type 2 nanoparticles, respectively. Symbol represents the volume concentration of mobile ions (i.e., ion density) in liquid crystals. and are the volume concentrations of type 1 and type 2 nanoparticles, respectively. (), (), (), (), and () are the surface area, fractional surface coverage, total surface density of surface sites, ion adsorption, and ion desorption coefficients of type 1 (type 2) nanoparticles, respectively [11,12].
The conservation of the total number of ions per unit volume is given by Equation (2):
where is the initial ion density in undoped liquid crystals; and are the contamination factors of type 1 and type 2 nanoparticles. The contamination factor quantifies the level of ionic contamination of nanoparticles, as discussed in previous papers [11,12]. As a result, Equation (2) is a special case of the conservation of the total number of ions per unit volume [17], applied to liquid crystals doped with ionically contaminated nanoparticles [11,12]. As a rule, in the case of nanoparticles in molecular liquid crystals, the fractional surface coverage is small (, i = 1, 2) [11,12]. As a result, using this condition and assuming a steady-state case (), the concentration of mobile ions n in liquid crystals containing two types of nanoparticles can be found. By knowing n, the electrical resistivity can be computed using Equation (3):
where . Even though the adopted approximation of symmetrical positive and negative ions is widely used in the literature [17], it is important to mention that, in general, positive and negative ions are characterized by different mobilities [9]. In this case, an effective mobility can be used, assuming , with the adsorption/desorption rate constants considered effective quantities, as discussed in paper [18]. It is also important to mention that the use of effective mobility covers the case of one dominant type of ions in liquid crystals when and (or and ). It should be noted that, in general, the electrical resistivity of molecular liquid crystals is anisotropic due to the anisotropy of ion mobility [8,9]. However, by assuming a uniformly aligned liquid crystal sample, an isotropic approximation to compute the electrical resistivity can be applied.
3. Results and Discussion
The values of material parameters used in our analysis are listed in Table 1. Spherical nanoparticles with radii where = 1, 2 are assumed. In our analysis, the weight concentration of nanoparticles of type ( = 1, 2), which is the ratio of the mass of nanoparticles to the mass of the mixture (i.e., liquid crystals plus nanoparticles), is used. For relatively small weight concentrations, the weight concentration of nanoparticles is related to their volume concentration as , where and are the mass densities of nanoparticles and liquid crystals, respectively. The values of the physical parameters listed in Table 1 are chosen to represent typical molecular liquid crystals and nanodopants. For example, an initial ion density ( m−3) is typical for non-fluorinated nematic liquid crystals such as 5CB or E7 [19,20]. Parameter quantifies the strength of ion adsorption leading to the ion-capturing effect. Nanomaterials such as diamond nanoparticles [15,21] and ferroelectric nanoparticles [22] are considered promising ion-capturing agents [11]. As a rule, the surface density of all surface sites of nanoparticles that can potentially be occupied by ions can vary and is of the order of m−2 [11,23]. Typical values of ion mobility are of the order of m2/Vs [19,20]. The ionic contamination of nanoparticles is generally small [11,24]. For example, for the listed material parameters, the value of the contamination factor indicates that approximately one nanoparticle out of ten is contaminated with one ion. By applying Equations (1)–(3) and assuming small surface coverage () and steady state, the resistivity of liquid crystals containing nanoparticles was evaluated according to Equation (4):
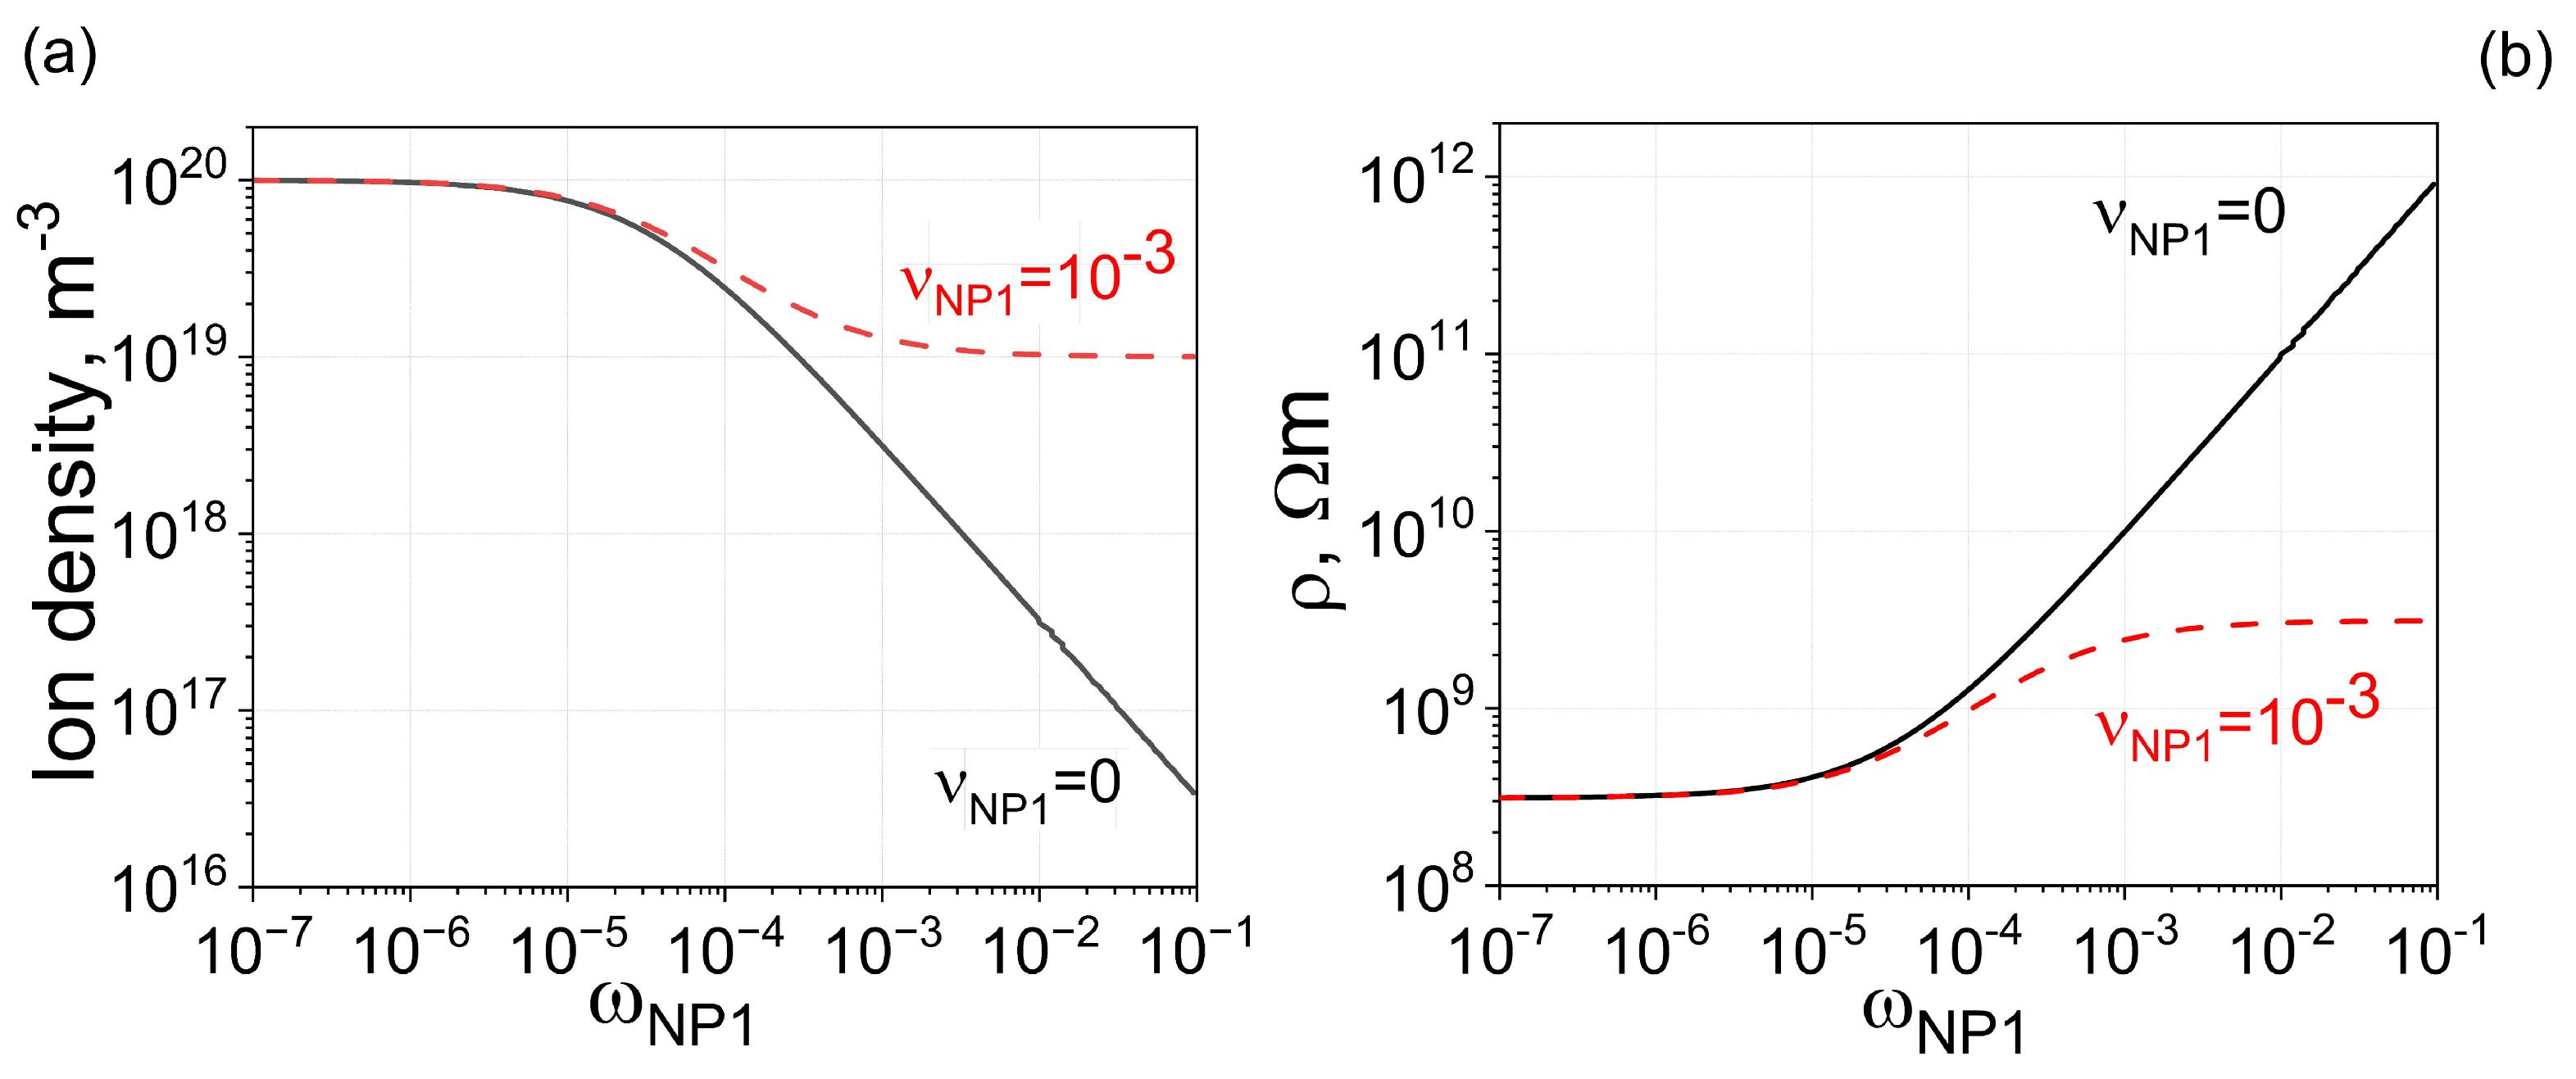
According to previously reported results, smaller nanoparticles and strong ion-capturing properties are beneficial for achieving a noticeable increase in the electrical resistivity of liquid crystals [13]. This can be seen from Figure 1 (solid curve), showing the concentration of mobile ions (Figure 1a, solid curve) in liquid crystals doped with 100% pure nanoparticles of one type with a radius of 2.5 nm and the corresponding value of electrical resistivity (Figure 1b, solid curve). As can be seen, more than a three-order-of-magnitude increase in electrical resistivity can be achieved. However, even minor ionic contamination can affect this process, as seen in Figure 1a,b (dashed curve): in the considered case, the ionic contamination of nanoparticles resulted in nearly a one-order of magnitude increase in resistivity instead of the expected three orders of magnitude increase.
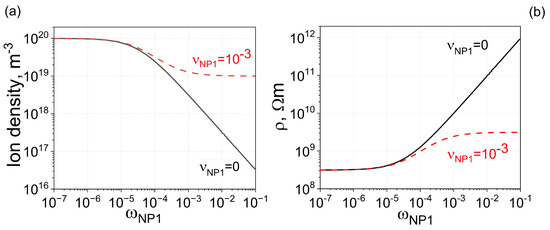
Figure 1.
One type of nanoparticles ( m3) in molecular liquid crystals. (a) The dependence of the ion density n on the weight concentration of type 1 nanoparticles . Only one type of nanoparticles is used. The solid curve represents 100% pure nanoparticles, and the dashed curve represents nanoparticles contaminated with ions. (b) The electrical resistivity of molecular liquid crystals plotted against the weight concentration of one type of nanoparticles.

Table 1.
The values of physical parameters used to calculate the curves shown in Figure 1, Figure 2 and Figure 3.
| Physical Parameter | Value |
|---|---|
| m−3 (Figure 1, Figure 2 and Figure 3) | |
| nm (Figure 1, Figure 2 and Figure 3) | |
| m−2 (Figure 1, Figure 2 and Figure 3) | |
| m3 (Figure 1, Figure 2 and Figure 3) | |
| m3 (Figure 2) | |
| m3 (Figure 3) | |
| 0 (Figure 1, Figure 2 and Figure 3); (Figure 1, Figure 2 and Figure 3) | |
| 0 (Figure 2 and Figure 3) | |
| m2/Vs. (Figure 1, Figure 2 and Figure 3) | |
| 0.1 (Figure 3); 1 and 10 (Figure 2 and Figure 3) | |
| 3.9 |
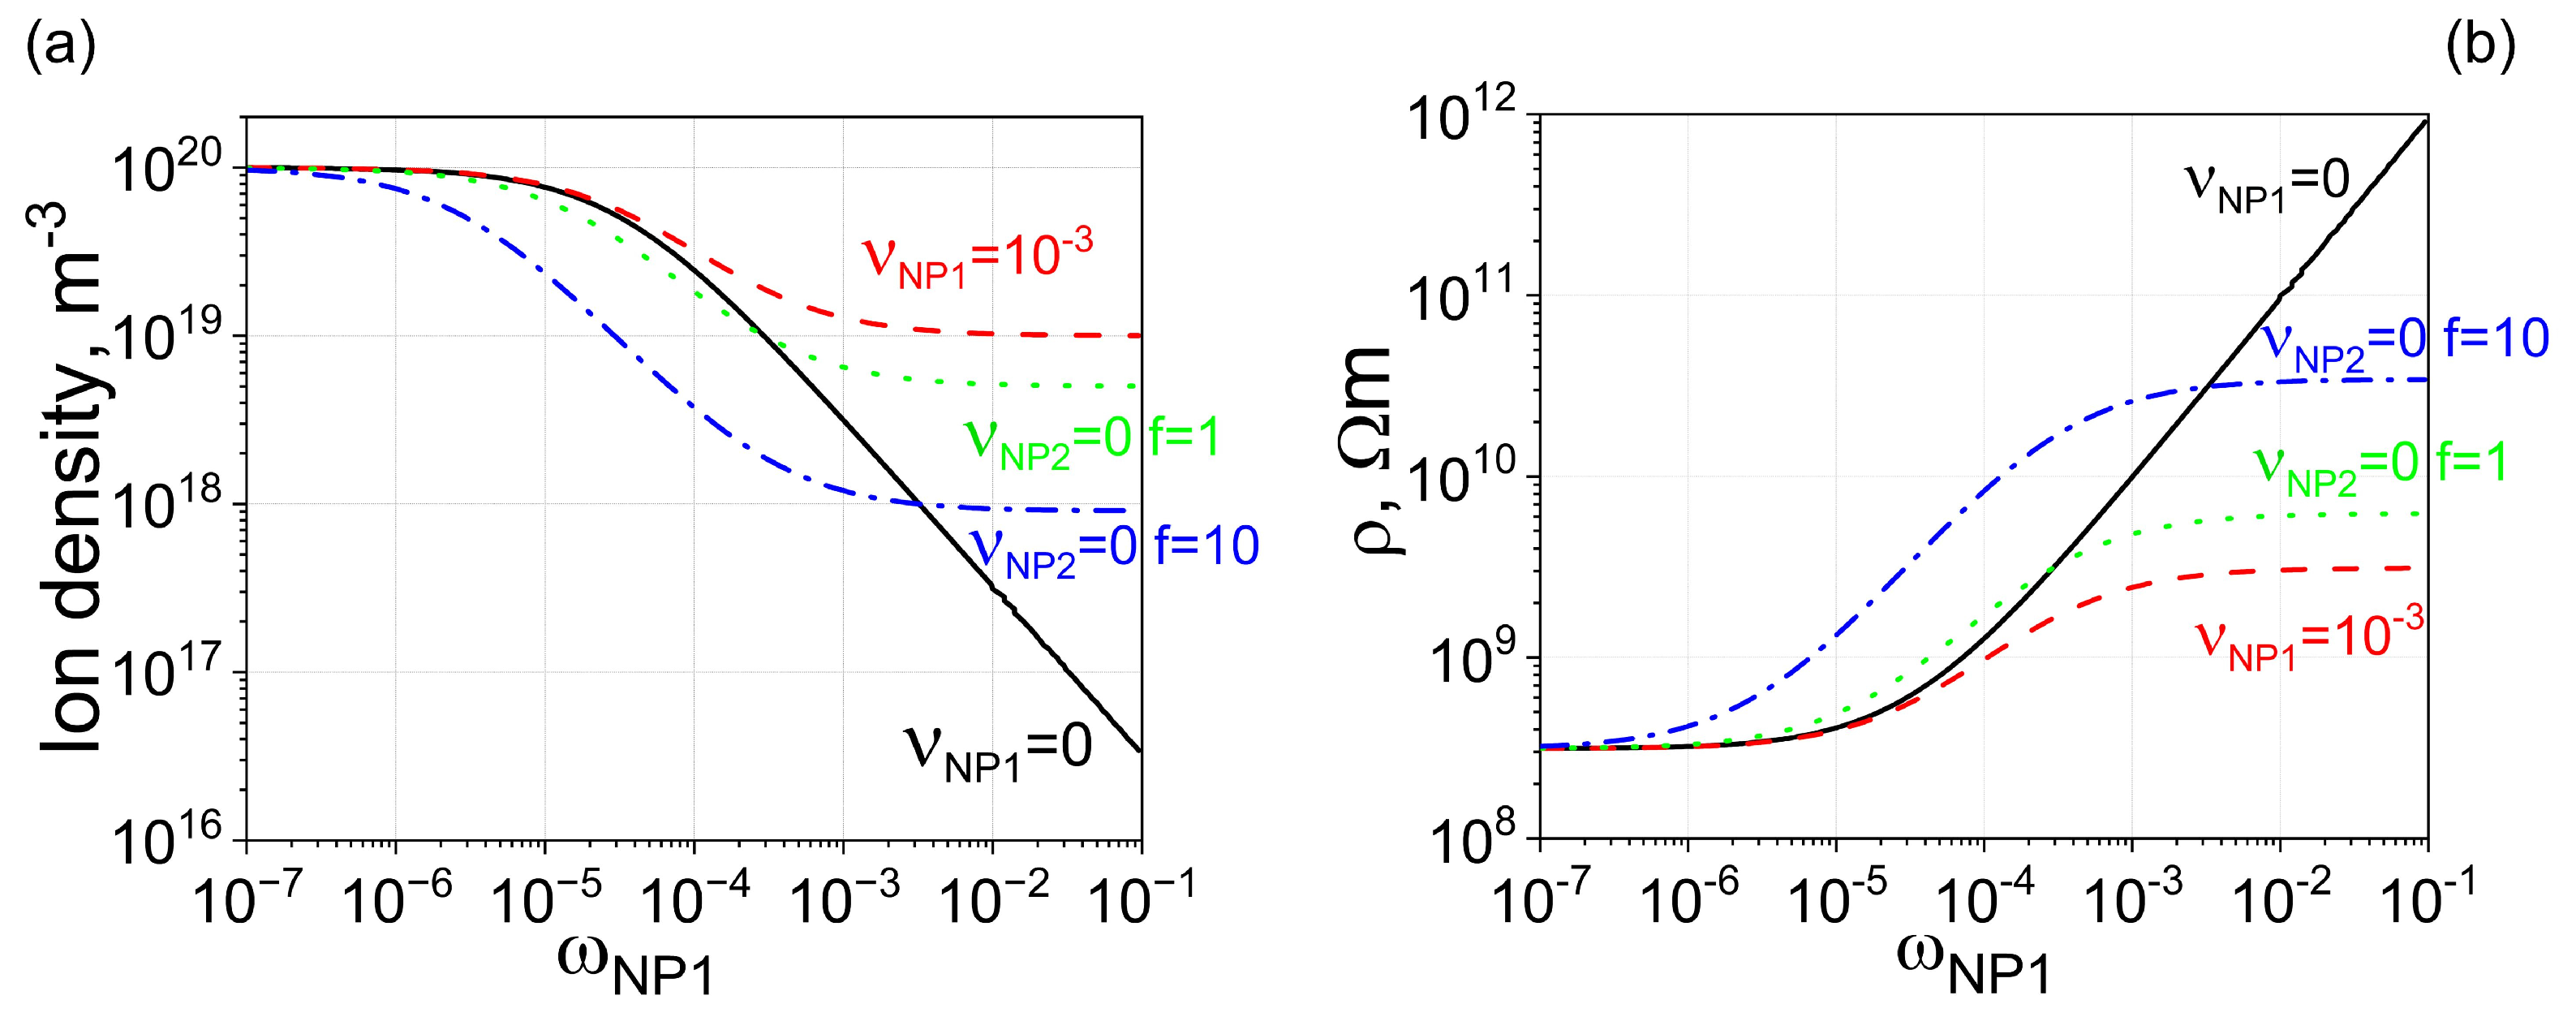
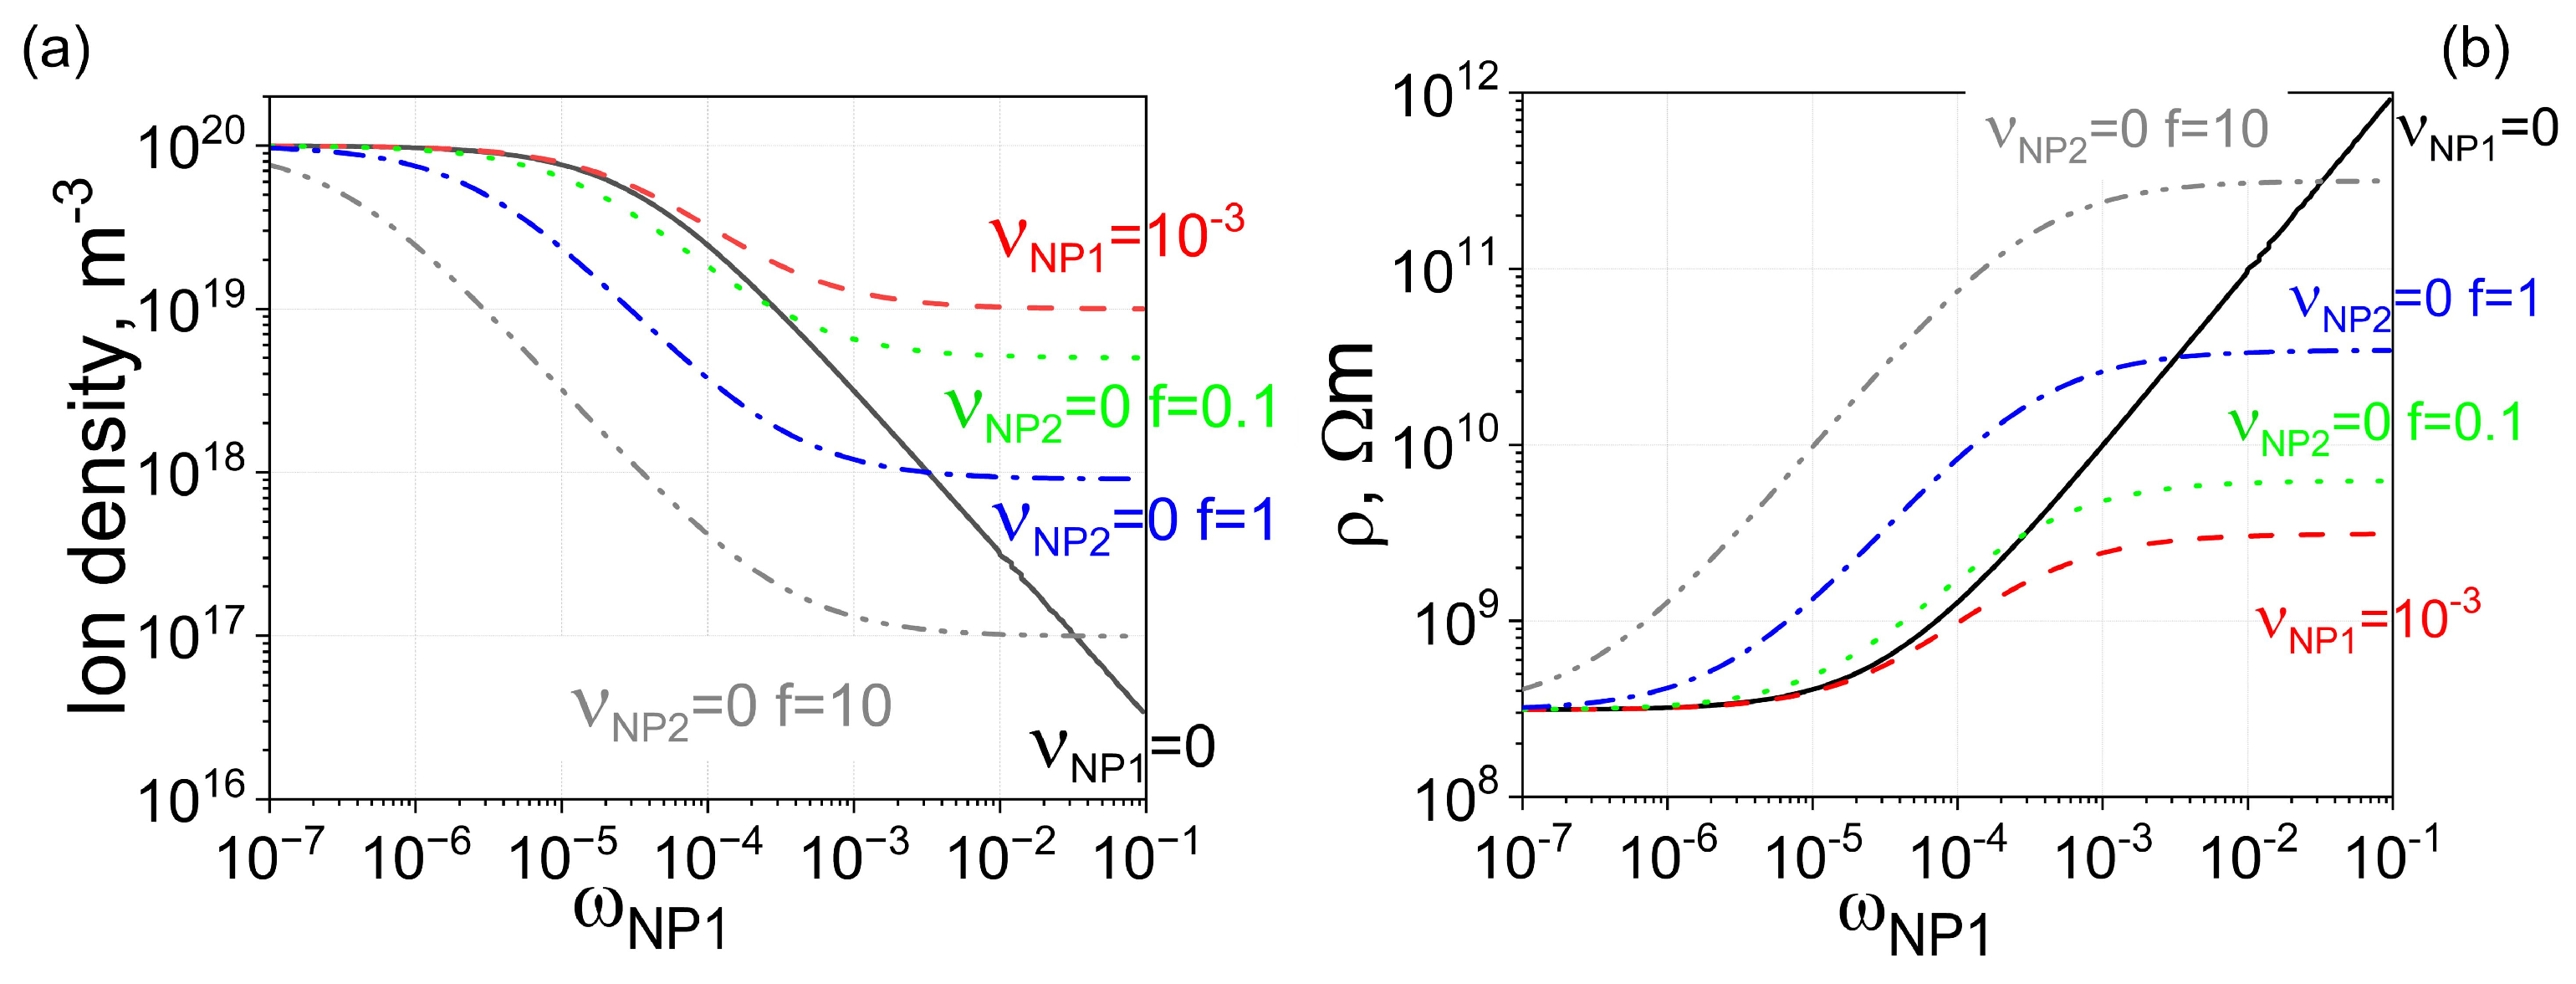
The detrimental effect caused by the ionic contamination of nanoparticles can be mitigated by adding non-contaminated nanoparticles to liquid crystals already containing contaminated nanodopants, as shown in Figure 2. For comparison purposes, Figure 2 also shows curves obtained for liquid crystals doped with non-contaminated (solid curves) and contaminated (dashed curves) nanoparticles of one type. By adding uncontaminated nanoparticles made from the same material to liquid crystals already doped with contaminated nanoparticles, it is possible to further enhance the electrical resistivity, as shown in Figure 2 (dash-dotted and dotted curves), achieving an increase of more than two orders of magnitude.
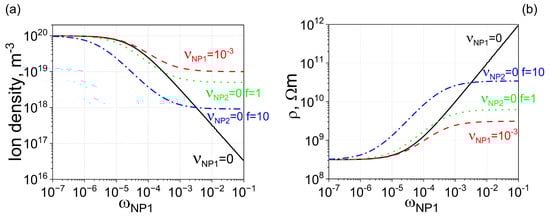
Figure 2.
Two types of nanoparticles made from the same material ( m3) are dispersed in molecular liquid crystals. (a) Solid curve: The dependence of the ion density n on the weight concentration of type 1 nanoparticles . Nanoparticles are 100% pure, meaning the contamination factor is zero. Dashed curve: The same dependence, assuming minor ionic contamination of type 1 nanoparticles. Dotted curve: The dependence of ion density on the weight concentration of nanoparticles, assuming two types of nanoparticles made from the same material are used. Type 1 nanoparticles are contaminated with ions ( = 10−3), whereas type 2 nanoparticles are 100% pure ( = 0). The ratio of the weight concentration of type 2 nanoparticles to that of type 1 nanoparticles is equal to f (f = 1). Dash-dotted curve: The same scenario as the dotted curve, except the relative ratio is increased by 10 times (f = 10). (b) The electrical resistivity of molecular liquid crystals is plotted against the weight concentration of type 1 nanoparticles (the concentration of type 2 nanoparticles is f times greater), corresponding to ion densities shown in (a) with solid (dashed, dotted, and dash-dotted) curves matching the solid (dashed, dotted, and dash-dotted) curves shown in (b).
To further enhance electrical conductivity, uncontaminated nanoparticles with stronger ion-capturing properties can be added to liquid crystals already doped with contaminated nanodopants. This scenario is shown in Figure 3 (dotted, dash-dotted, and dash-double-dotted curves). As can be seen, in this case, it is possible to achieve the planned three-order-of-magnitude increase in the electrical resistivity of liquid crystals.
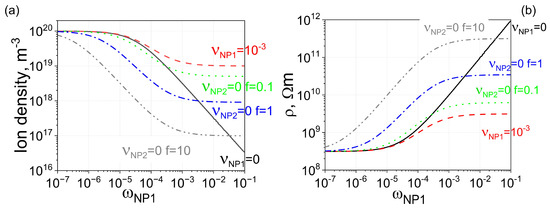
Figure 3.
Two types of nanoparticles made from different materials ( m3, and m3) are dispersed in molecular liquid crystals. (a) Solid curve: The dependence of the ion density n on the weight concentration of type 1 nanoparticles . Nanoparticles are 100% pure, meaning the contamination factor is zero. Dashed curve: The same dependence, assuming minor ionic contamination of type 1 nanoparticles. Dotted curve: The dependence of ion density on the weight concentration of nanoparticles, assuming two types of nanoparticles made from different materials are used. Type 1 nanoparticles are contaminated with ions ( = 10−3), whereas type 2 nanoparticles are 100% pure ( = 0). The ratio of the weight concentration of type 2 nanoparticles to that of type 1 nanoparticles is equal to f (f = 0.1). Dash-dotted curve: The same scenario as the dotted curve, except the relative ratio is increased by 10 times (f = 1). Dash-double-dotted curve: The same scenario as the dotted curve, except the relative ratio is increased by 100 times (f = 10). (b) The electrical resistivity of molecular liquid crystals is plotted against the weight concentration of type 1 nanoparticles (the concentration of type 2 nanoparticles is f times greater), corresponding to ion densities shown in (a) with solid (dashed, dotted, dash-dotted, and dash-double-dotted) curves matching the solid (dashed, dotted, dash-dotted, and dash-double-dotted) curves shown in (b).
4. Conclusions
The results shown in Figure 1, Figure 2 and Figure 3 indicate that using two types of nanoparticles dispersed in liquid crystals is promising for mitigating the effects of ionic contamination of nanodopants and ultimately achieving better control over the electrical resistivity of molecular liquid crystals. The greater number of parameters, including the size of nanoparticles, materials of which they are made, and their concentrations, offer a greater number of degrees of freedom to tune the electrical properties of liquid crystals in a desirable way. This paper also highlights the importance of considering the possibility of ionic contamination of nanoparticles for practical applications, such as converting low-resistivity liquid crystals to high-resistivity liquid crystals.
Author Contributions
Conceptualization, Y.G.; methodology, Y.G.; formal analysis, M.G., I.T., M.B., N.L., A.S. and Y.G.; investigation, M.G., I.T., M.B., N.L., A.S. and Y.G.; resources, Y.G.; data curation, Y.G.; writing—original draft preparation, Y.G.; writing—review and editing, M.G., I.T., M.B., N.L., A.S. and Y.G.; supervision, Y.G.; project administration, Y.G.; funding acquisition, Y.G. All authors have read and agreed to the published version of the manuscript.
Funding
This research was funded by the CSU—AAUP Faculty Research Grant, and the Faculty—Student Research Grant.
Institutional Review Board Statement
Not applicable.
Informed Consent Statement
Not applicable.
Data Availability Statement
All data that support the findings of this study are included within the article.
Conflicts of Interest
The authors declare no conflicts of interest.
References
- Zia, A.; Saeed, S.; Man, T.; Liu, H.; Chen, C.X.; Wan, Y. Next-generation interfaces: Integrating liquid crystal technologies in augmented and virtual reality—A review. Liq. Cryst. Rev. 2024, 12, 30–56. [Google Scholar] [CrossRef]
- Wang, Y.-J.; Lin, Y.-H. Liquid crystal technology for vergence-accommodation conflicts in augmented reality and virtual reality systems: A review. Liq. Cryst. Rev. 2021, 9, 35–64. [Google Scholar] [CrossRef]
- Xiong, J.; Hsiang, E.-L.; He, Z.; Zhan, T.; Wu, S.-T. Augmented reality and virtual reality displays: Emerging technologies and future perspectives. Light Sci. Appl. 2021, 10, 216. [Google Scholar] [PubMed]
- d’Alessandro, A.; Asquini, R. Light Propagation in Confined Nematic Liquid Crystals and Device Applications. Appl. Sci. 2021, 11, 8713. [Google Scholar] [CrossRef]
- Otón, J.M.; Otón, E.; Quintana, X.; Geday, M.A. Liquid-crystal phase-only devices. J. Mol. Liq. 2018, 267, 469–483. [Google Scholar]
- Aljohani, O.; Dierking, I. Modern developments in lasing with liquid crystals. Front. Mater. 2024, 11, 1453744. [Google Scholar] [CrossRef]
- Camley, R.; Celinski, Z.; Garbovskiy, Y.; Glushchenko, A. Liquid crystals for signal processing applications in the microwave and millimeter wave frequency ranges. Liq. Cryst. Rev. 2018, 6, 17–52. [Google Scholar]
- Blinov, L.M. Structure and Properties of Liquid Crystals; Springer: New York, NY, USA, 2010. [Google Scholar]
- Neyts, K.; Beunis, F. Ion Transport in Liquid Crystals. In Handbook of Liquid Crystals: Physical Properties and Phase Behavior of Liquid Crystals; Wiley-VCH: Weinheim, Germany, 2014; Volume 2, Chapter 11; pp. 357–382. [Google Scholar]
- Chen, C.-H.; Dierking, I. Nanoparticles in thermotropic and lyotropic liquid crystals. Front. Soft Matter 2025, 4, 1518796. [Google Scholar] [CrossRef]
- Garbovskiy, Y. Conventional and unconventional ionic phenomena in tunable soft materials made of liquid crystals and nanoparticles. Nano Express 2021, 2, 012004. [Google Scholar]
- Garbovskiy, Y. A perspective on the Langmuir adsorption model applied to molecular liquid crystals containing ions and nanoparticles. Front. Soft Matter 2022, 2, 1079063. [Google Scholar]
- Lee, N.; Burnes, M.; Foster, S.; Saeed, A.; Guevara, S.; Trevino, I.; Garbovskiy, Y. Nanoparticle-Induced Ionic Effects in Liquid Crystal Devices. Eng. Proc. 2023, 56, 199. [Google Scholar] [CrossRef]
- Barrera, A.; Binet, C.; Dubois, F.; Hébert, P.-A.; Supiot, P.; Foissac, C.; Maschke, U. Dielectric Spectroscopy Analysis of Liquid Crystals Recovered from End-of-Life Liquid Crystal Displays. Molecules 2021, 26, 2873. [Google Scholar] [CrossRef]
- Barrera, A.; Binet, C.; Danede, F.; Tahon, J.-F.; Ouddane, B.; Dubois, F.; Supiot, P.; Foissac, C.; Maschke, U. Chemical Characterization and Thermal Analysis of Recovered Liquid Crystals. Crystals 2023, 13, 1064. [Google Scholar] [CrossRef]
- Langmuir, I. The Adsorption of Gases on Plane Surface of Glass, Mica and Platinum. J. Am. Chem. Soc. 1918, 40, 1361–1402. [Google Scholar] [CrossRef]
- Barbero, G.; Evangelista, L.R. Adsorption Phenomena and Anchoring Energy in Nematic Liquid Crystals; Taylor & Francis: Boca Raton, FL, USA, 2006. [Google Scholar]
- Garbovskiy, Y. Adsorption/desorption of ions in liquid crystal nano-colloids: The applicability of the Langmuir isotherm, impact of high electric fields, and effects of the nanoparticle’s size. Liq. Cryst. 2016, 43, 853–860. [Google Scholar]
- Naemura, S.; Sawada, A. Ionic conduction in nematic and smectic liquid crystals. Mol. Cryst. Liq. Cryst. 2003, 400, 79–96. [Google Scholar]
- Costa, M.R.; Altafim, R.A.C.; Mammana, A.P. Ionic impurities in nematic liquid crystal displays. Liq. Cryst. 2001, 28, 1779–1783. [Google Scholar] [CrossRef]
- Tomylko, S.; Yaroshchuk, O.; Kovalchuk, O.; Maschke, U.; Yamaguchi, R. Dielectric and Electro-Optical Properties of Liquid Crystals Doped with Diamond Nanoparticles. Mol. Cryst. Liq. Cryst. 2011, 541, 35–273. [Google Scholar] [CrossRef]
- Shukla, R.K.; Liebig, C.M.; Evans, D.R.; Haase, W. Electro-optical behaviour and dielectric dynamics of harvested ferroelectric LiNbO3 nanoparticle-doped ferroelectric liquid crystal nanocolloids. RSC Adv. 2014, 4, 18529–18536. [Google Scholar]
- Huang, Y.; Bos, P.J.; Bhowmik, A. The ion capturing effect of 5 SiOx alignment films in liquid crystal devices. J. Appl. Phys. 2010, 108, 064502. [Google Scholar]
- Urbanski, M.; Lagerwall, J.P.F. Why organically functionalized nanoparticles increase the electrical conductivity of nematic liquid crystal dispersions. J. Mater. Chem. C 2017, 5, 8802–8809. [Google Scholar]
Disclaimer/Publisher’s Note: The statements, opinions and data contained in all publications are solely those of the individual author(s) and contributor(s) and not of MDPI and/or the editor(s). MDPI and/or the editor(s) disclaim responsibility for any injury to people or property resulting from any ideas, methods, instructions or products referred to in the content. |
© 2025 by the authors. Licensee MDPI, Basel, Switzerland. This article is an open access article distributed under the terms and conditions of the Creative Commons Attribution (CC BY) license (https://creativecommons.org/licenses/by/4.0/).