Abstract
This paper proposes an advanced forecasting model for predicting carbon dioxide (CO2) emissions in Thailand’s electricity generation sector. The model integrates a multivariate gray model with the fminsearch optimization algorithm in MATLAB (R2025a) to address the critical challenge of accurate emission forecasting, a key driver of climate change. Historical data on CO2 emissions, gross domestic product (GDP), peak electricity demand, and electricity user numbers are utilized to enhance predictive accuracy. Comparative analysis demonstrates that the optimized model significantly outperforms the conventional multivariate gray model, achieving mean absolute percentage error (MAPE) values of 7.74% for the training set and 1.75% for the testing set. The results highlight the effectiveness of the proposed approach as a robust tool for policymakers and stakeholders in Thailand’s energy sector, offering actionable insights to support informed decision-making in managing and reducing CO2 emissions.
1. Introduction
The amount of carbon dioxide (CO2) generated during electricity production significantly impacts the environment and human health. In the context of global climate change, reducing CO2 emissions is a global priority. Thailand’s electricity sector is a significant contributor to the country’s overall emissions, primarily due to the heavy reliance on fossil fuels, such as coal and natural gas. As a result, there is an urgent need to adopt sustainable and efficient strategies to forecast and mitigate emissions, thereby supporting environmental sustainability [1].
Various predictive models have been employed for CO2 forecasting. Techniques such as artificial neural networks (ANNs) have demonstrated high accuracy through error feedback mechanisms [2]. Time series methods like ARIMA have proven effective for smaller datasets [3], while multivariate models such as GM (1,n) offer advantages in scenarios with uncertain or incomplete data [4]. However, most existing models face challenges in balancing complexity and precision, especially when applied to specific sectors like electricity generation. Moreover, the integration of optimization methods, such as the fminsearch algorithm, has yet to be fully explored to enhance the predictive accuracy of multivariate models in this domain [5].
This research bridges the aforementioned gap by developing an advanced CO2 emission forecasting model tailored for Thailand’s electricity sector. By integrating a multivariate gray model with the fminsearch optimization function in MATLAB, this study achieves significant improvements in prediction accuracy. This approach not only enhances parameter tuning but also provides actionable insights for policymakers to design effective carbon reduction strategies, thereby addressing the dual objectives of environmental and economic sustainability.
2. Materials
2.1. Gray Forecasting Method
The gray system theory, developed by Julong Deng, has been widely applied across various fields, including agriculture, economics, medicine, and history. The gray model (GM) integrates both complete and incomplete data into the forecasting process [6]. Compared to other forecasting methods, the GM is particularly well-suited for systems characterized by uncertainty, limited information, and small datasets [7,8,9].
2.1.1. Univariate Gray Technique
The univariate gray technique, known as GM(1,1), is named such because the first “1” denotes the order of the differential equation, while the second “1” represents the number of factors used in constructing the forecast model. The actual data sequence is arranged chronologically as follows:
where x(0) (k) ≥ 0, k = 1, 2, …, n, and k is the data required to create the forecasting model.
2.1.2. Multivariate Gray
The multivariate gray technique, or GM(1,n) technique, where the first number represents the order of the differential equation and the subsequent number (n) refers to the number of factors used to create the forecasting model, which depends on time, can be expressed as follows:
where is the value from the forecasting model , which can defined by x(1) (1) = x(0) (1).
2.2. The Fminsearch Function in MATLAB
The fminsearch function is a built-in function in MATLAB. It is designed to find the minimum of an unconstrained multivariate function without relying on derivatives. The input is provided as a matrix or vector, which serves as the starting point for the function [10]. The function then performs iterative minimization on the specified objective function provided in the argument. The appropriateness of the forecast is then evaluated considering the relationship of the average absolute error percentage value with the Lewis criteria. The relationship of the average absolute error percentage with the Lewis criterion by the appropriateness assessment criteria is shown in Table 1.
where x(0) is a real value, is the forecasted value, and n is total number of data.

Table 1.
Assessment of MAPE with respect to the Lewis Criteria.
3. Methods
This section outlines the procedures and methods employed in utilizing the fminsearch technique in MATLAB. The steps are illustrated in Figure 1.
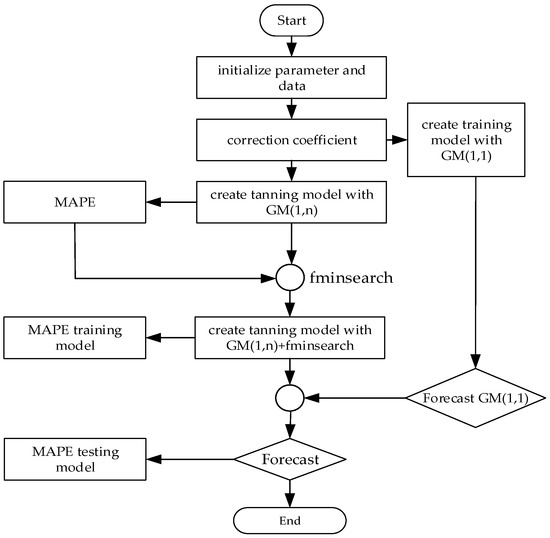
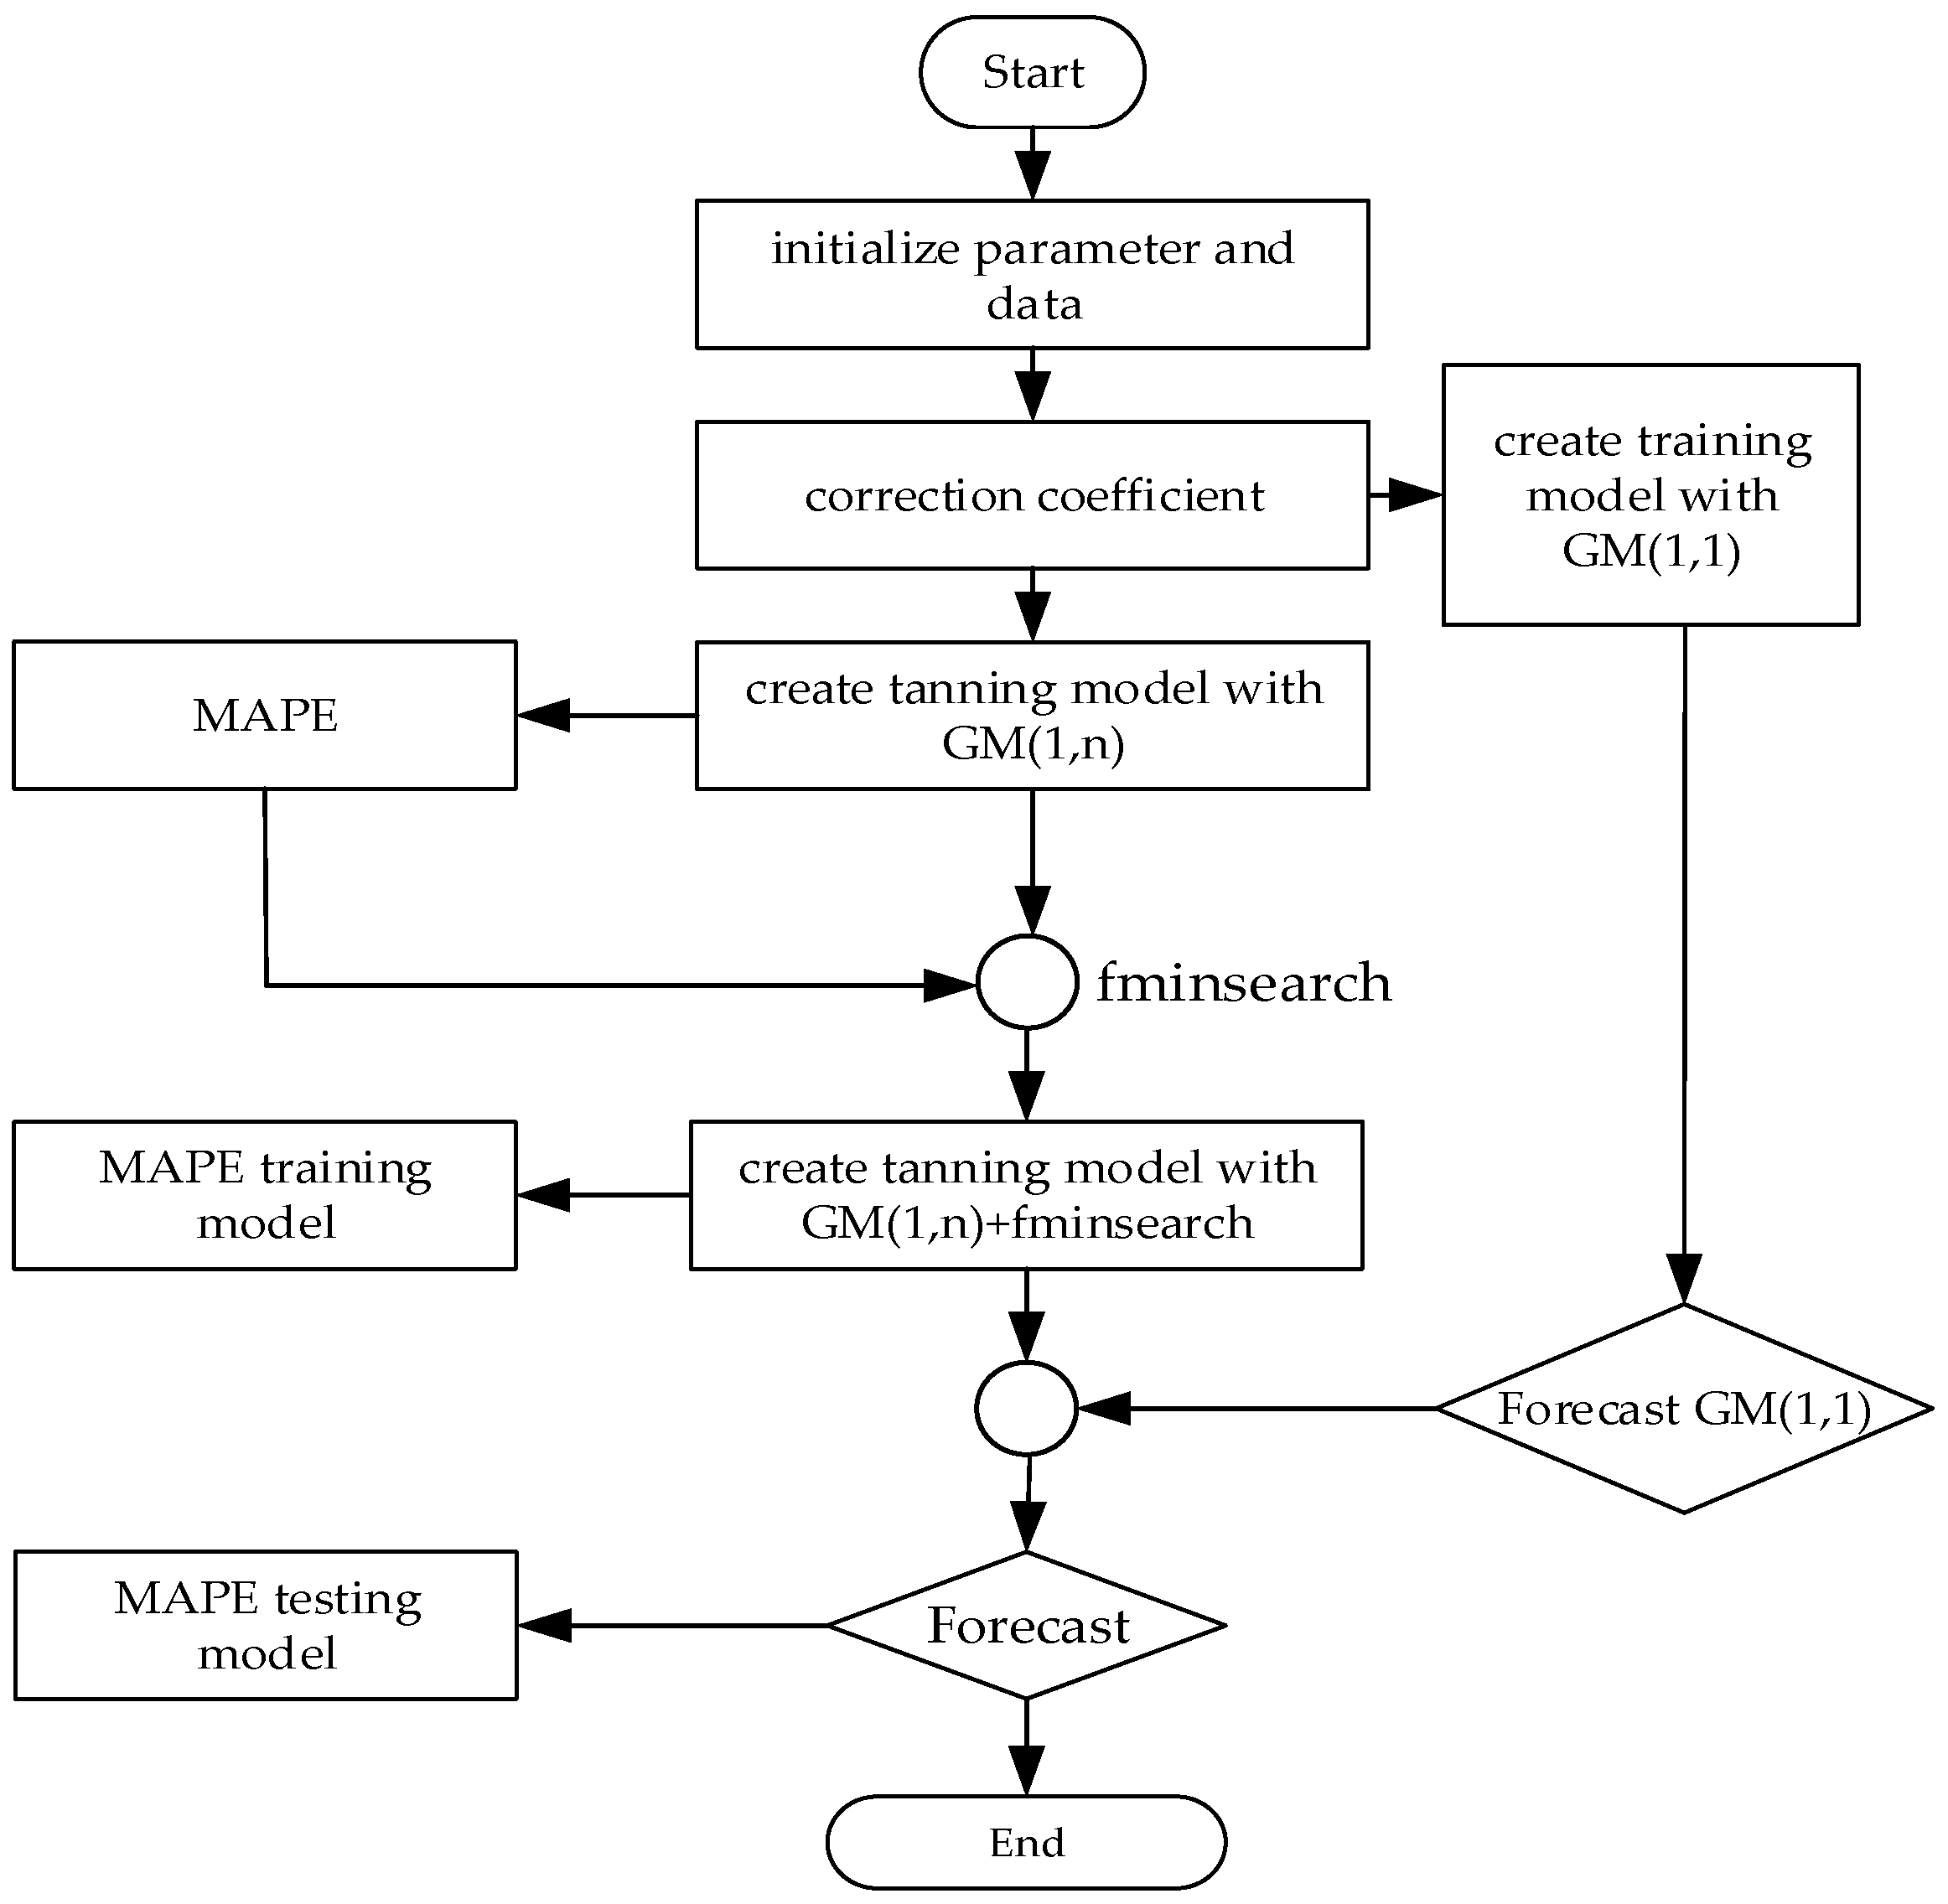
Figure 1.
Flowchart of designing the algorithm with fminsearch.
Figure 1 presents a flowchart for designing an optimization-based forecasting algorithm using fminsearch in MATLAB, commonly applied in predictive analysis. The algorithm begins with the initialization of parameters and data relevant to the system or process being modeled, establishing baseline inputs for accurate forecasting. Following initialization, a correction coefficient is applied to adjust initial conditions or account for potential discrepancies in data, enhancing model accuracy. The process then diverges to create two distinct predictive models, GM(1,1), a single-variable gray model, and GM(1,n), a multivariable extension, both of which are tailored for systems exhibiting uncertain or limited data, a typical scenario in electrical engineering applications like load forecasting or fault prediction. To validate these models, the mean absolute percentage error (MAPE) training model was used to evaluate each model’s accuracy in capturing the underlying trends and variations in the data.
3.1. Gathering Information
Historical statistical data were collected on carbon dioxide emissions from Thailand’s electricity production sector, GDP, maximum electricity demand, and the number of electricity users [10,11,12,13]. The dataset for training the model covers the period from 2007 to 2020, while the testing dataset spans from 2021 to 2022, as shown in Table 2.
Table 2.
Data on the amount of carbon dioxide produced by the electricity production sector and other factors.
3.2. Filtering Information and Correlation Coefficients
The process of screening independent variables by finding the correlation coefficient was performed in order to evaluate the consistency of the relationships between the three sets of independent variables and the amount of carbon dioxide produced by the electricity production sector. The results are shown in Table 3.
Table 3.
The correlation coefficients of carbon dioxide produced by the electricity production sector.
Table 3 summarizes the correlation coefficients between the three sets of independent variables and the amount of carbon dioxide produced by the electricity production sector. When analyzed based on the value r, it can be concluded that all three sets of independent variables show positive results and have a value greater than 0.5. Therefore, in this article, we chose to use the amount of carbon dioxide produced by the electricity production sector (million tons), the value of GDP, the maximum electricity demand value (MW), and the total number of electricity consumers (persons) for creating models to predict the results.
3.3. Creating a Set Training Model
A forecasting model was developed using the GM(1,1) technique to predict GDP, maximum electricity demand, and the total number of electricity consumers for the years 2021 and 2022. The forecasted GDP values are 11,305.20 and 11,637.69, respectively. The predicted maximum electricity demand values are 31,370.95 and 32,140.48, and the forecasted total number of electricity consumers is 4,177,223.95 and 4,303,156.77, respectively.
3.4. Creating a Set Training Model with the GM(1,n) Technique
A model was developed using the GM(1,n) technique to estimate carbon dioxide emissions from the electricity production sector, with one dependent variable and three independent variables. The GM(1,n) model, where n = 4, yielded the following parameter values: [2.1235, 27.0509, 0.0005, −56.4652]. The simulation results are presented in Figure 2.
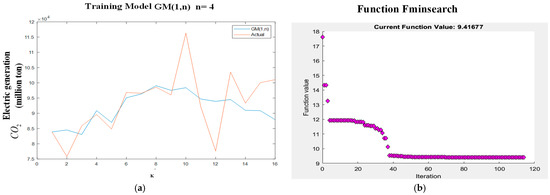
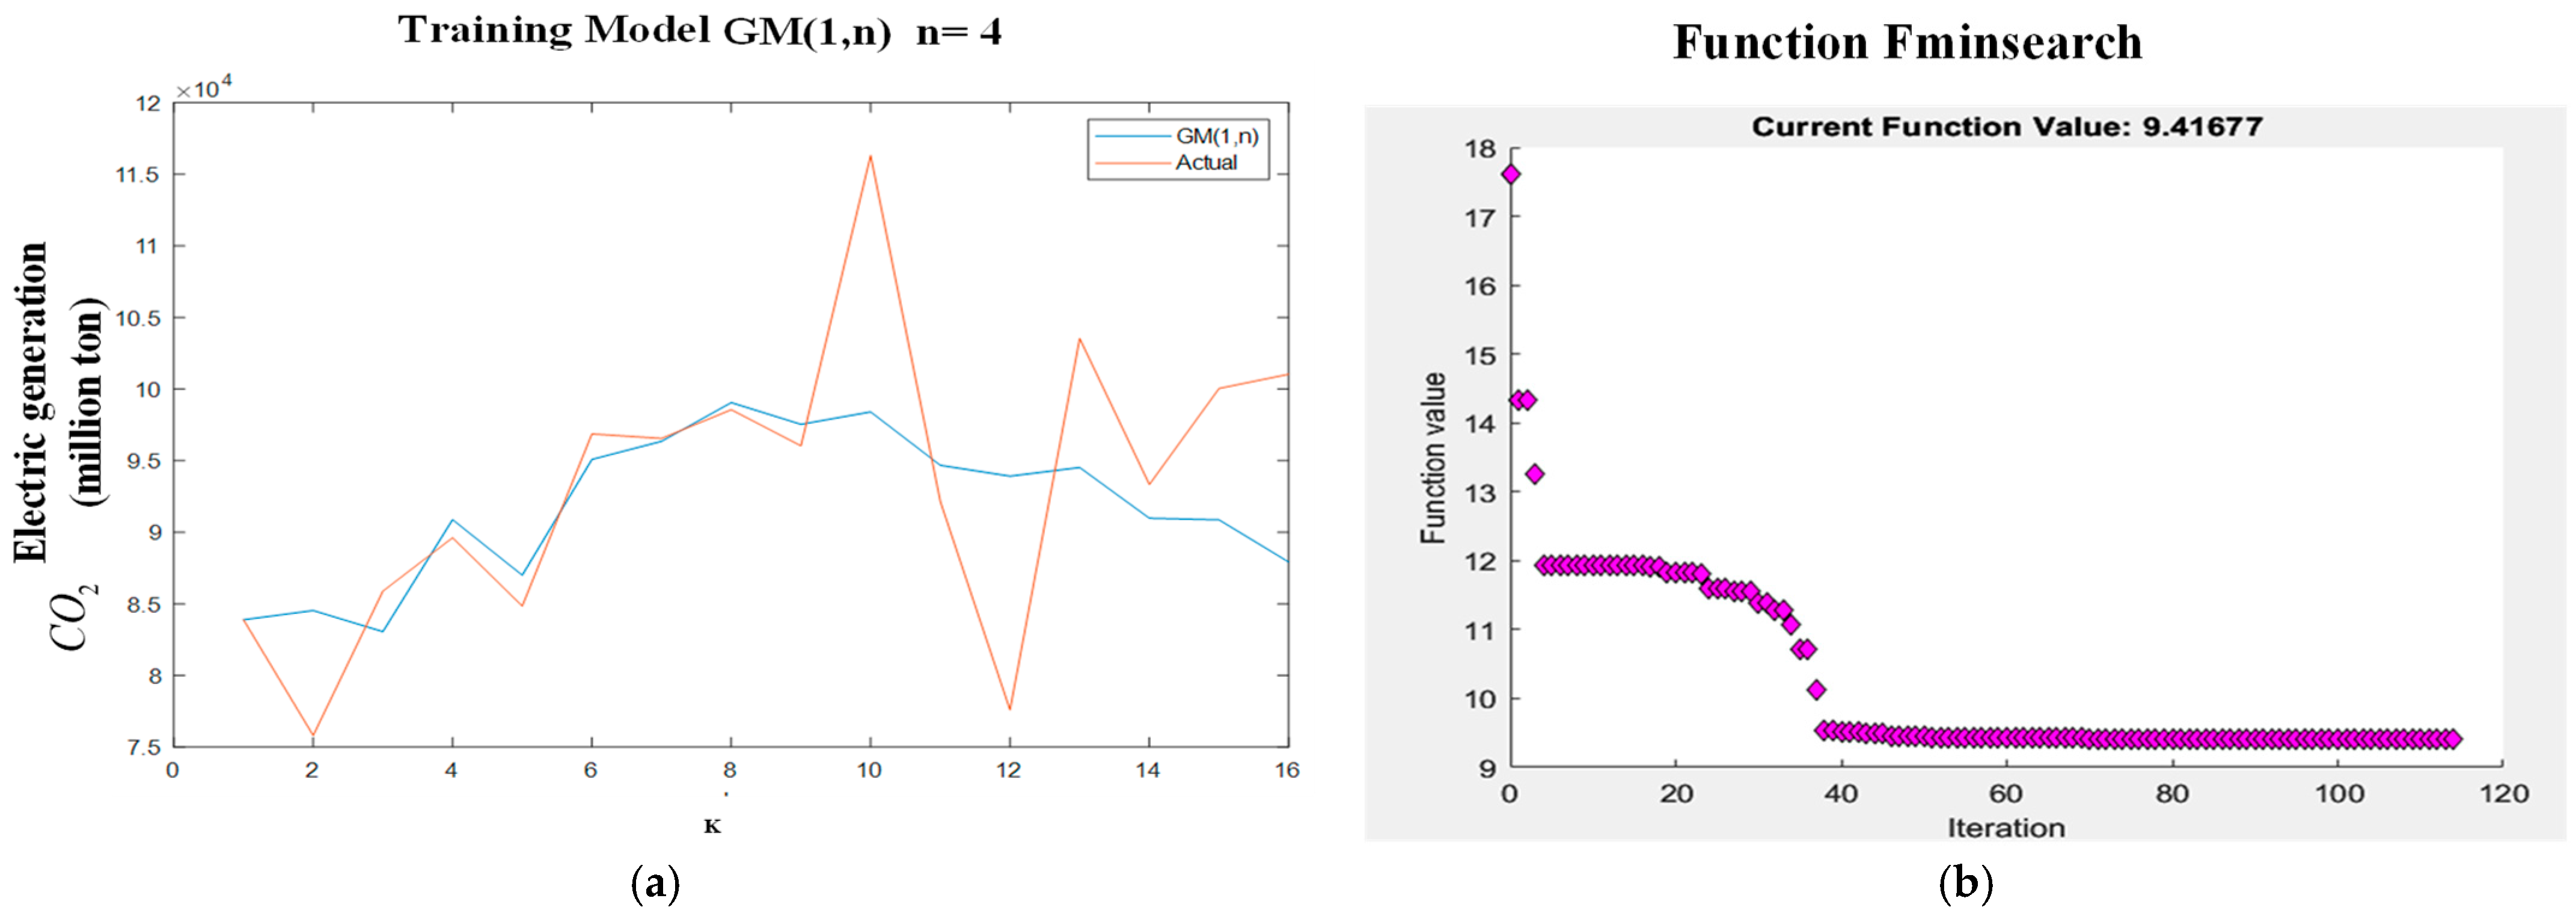
Figure 2.
Training model created using the GM(1,n) technique.
Figure 2a presents a comparison between the actual data and the results obtained using the GM(1,n) technique. The training model yields a MAPE of 5.15%, while the testing model results in a MAPE of 12.51%, giving a combined MAPE of 17.66%. This combined value is considered in determining the optimal parameters during model creation. The training model was developed using both the GM(1,n) and fminsearch techniques. Figure 2b shows that the fminsearch function begins optimization with an initial MAPE of 9.42% and successfully identifies new parameter values that minimize the MAPE.
3.5. Creating a Set Training Model with the GM(1,n) and Fminsearch Techniques
Using the fminsearch function, we developed a model integrated with the GM(1,n) technique by optimizing new parameter values based on the initial parameters and the MAPE obtained from the original GM(1,n) training model. This process produced the parameters [b1, b2, b3, b4] = [2.1235, 27.0509, 0.0005, −56.4652], with a corresponding MAPE of 17.66%.
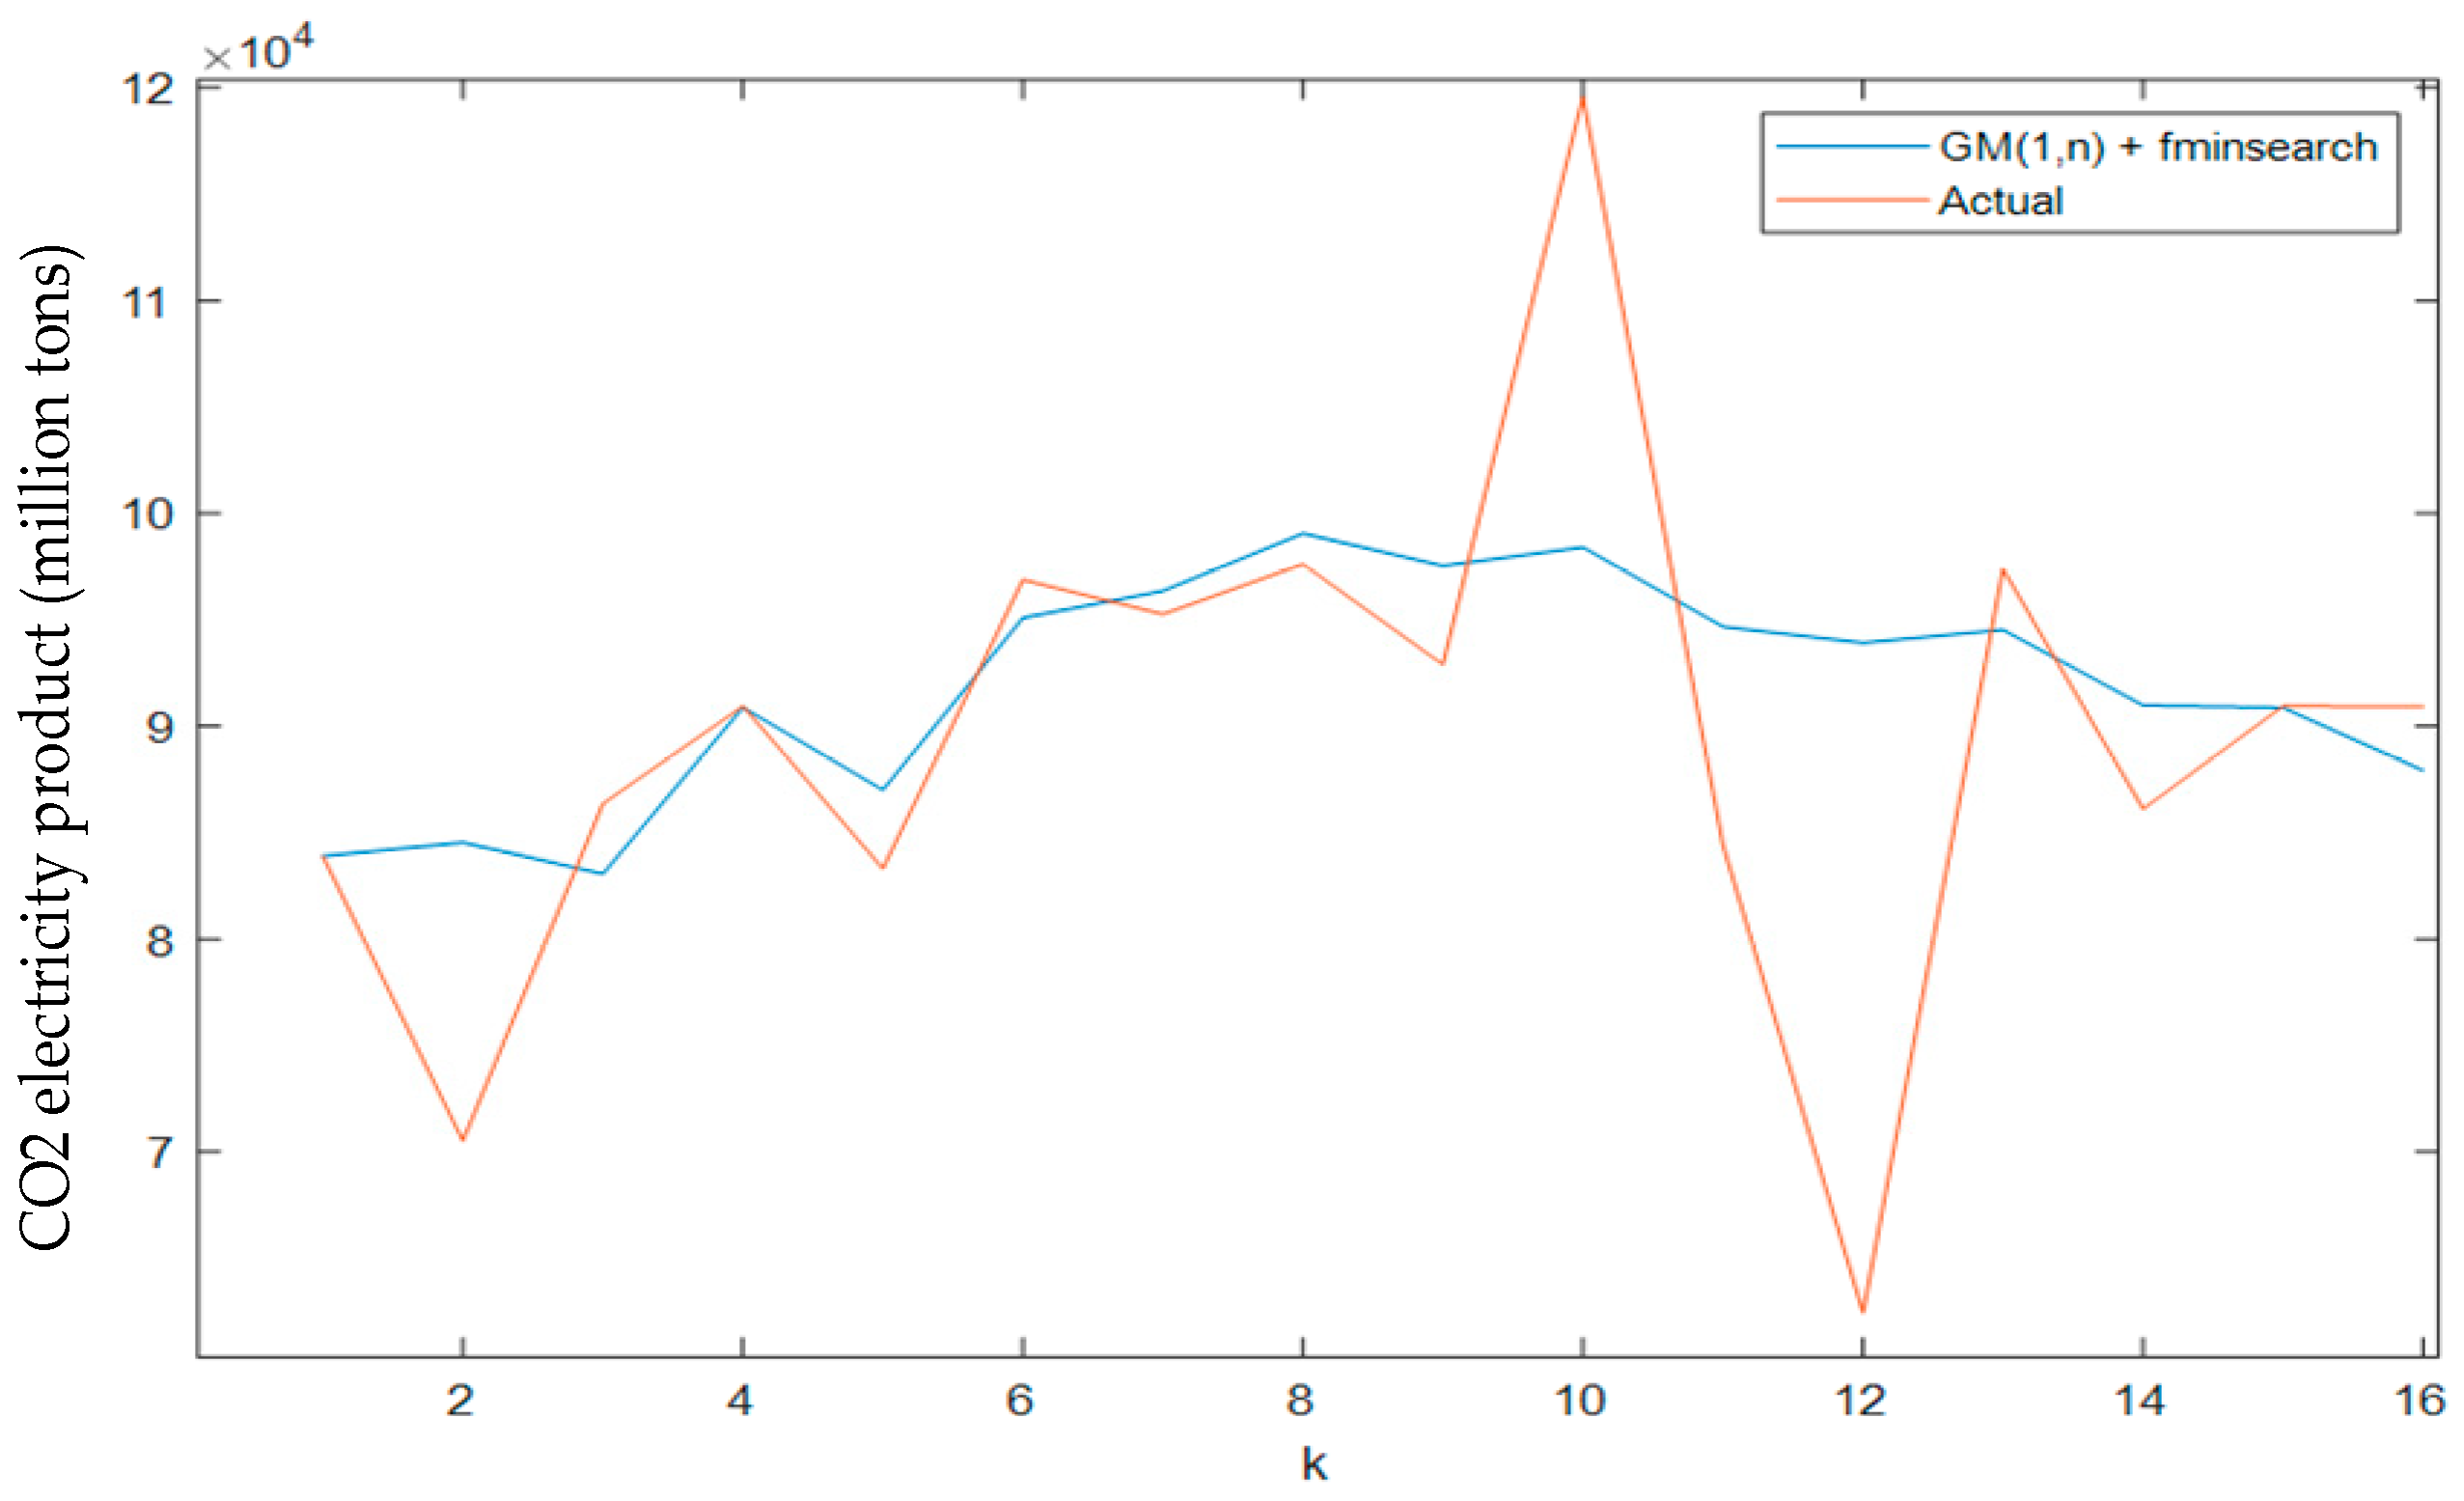
Figure 3 compares the empirical data with the results of the fminsearch-optimized GM(1,n) model. The MAPE is 7.74% for the training set and 1.75% for the testing set, resulting in a combined MAPE of 9.42%.
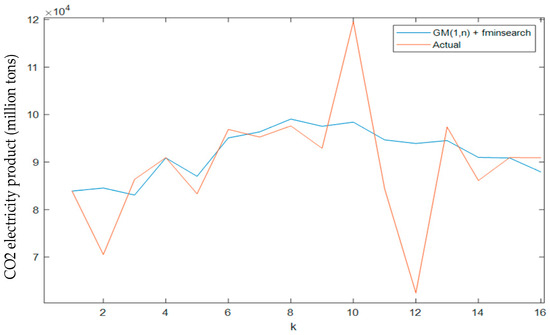
Figure 3.
Training model created using GM(1,n) and fminsearch.
4. Results
This section provides the forecast results regarding the amount of carbon dioxide produced by Thailand’s electricity production sector generated using gray models and fminsearch optimization.
Table 4 Summary of carbon dioxide emission forecast results from the power generation sector (million tons).
Table 4.
Forecast results regarding the amount of carbon dioxide produced by the electricity production sector.
5. Conclusions
This paper introduces an optimized CO2 emission forecasting model tailored for Thailand’s electricity generation sector, employing a multivariate gray model with the fminsearch optimization function. This model demonstrated significant improvements in predictive accuracy, with a mean absolute percentage error (MAPE) of 7.74% for the training set and 1.75% for the testing set. These results indicate a marked enhancement over conventional multivariate gray models, which often struggle with parameter tuning and may exhibit lower precision due to a lack of optimization. Compared to traditional statistical models like ARIMA and linear regression, which are limited in capturing nonlinear relationships in emission data, the integration of fminsearch optimization enables more accurate trend forecasting by adjusting parameters to minimize prediction errors. Future work directions include the integration of real-time data streams and the application of the model to other sectors beyond electricity generation.
Author Contributions
K.J.: Conceptualization, Methodology, Software, Formal analysis, Investigation, Writing—original draft. T.P. and S.M.: Conceptualization, Methodology, Software, Investigation, Supervision, Writing—review and editing. S.P.: writing—review and editing, supervision. All authors have read and agreed to the published version of the manuscript.
Funding
This research was funded year 2024 by Sukhothai Technical College, Northern Vocational Education Institute 3 and Nakhonphanom University, Thailand.
Data Availability Statement
Data are contained within the article.
Conflicts of Interest
The authors declare no conflict of interest.
References
- Waheeb, W.; Shah, H.; Jabreel, M.; Puig, D. Ridge Polynomial Neural Network with Error Feedback for Recursive Multi-step Forecast Strategy: A Case Study of Carbon Dioxide Emissions Forecasting. In Proceedings of the 2nd International Conference on Computer and Information Sciences (ICCIS), Sakaka, Saudi Arabia, 13–15 October 2020; pp. 1–6. [Google Scholar] [CrossRef]
- Mustaffa, A.S.; Shabri, A. An Improved Rolling NGBM(1,1) Forecasting Model with GRG Nonlinear Method of Optimization for Fossil Carbon Dioxide Emissions in Malaysia and Singapore. In Proceedings of the 11th IEEE Control and System Graduate Research Colloquium (ICSGRC), Shah Alam, Malaysia, 8 August 2020; pp. 32–37. [Google Scholar] [CrossRef]
- Liu, S.; An, Q.; Zhao, B.; Hao, Y. A Novel Control Forecasting Method for Electricity-Carbon Dioxide Based on PID Tracking Control Theorem. In Proceedings of the 4th Power System and Green Energy Conference (PSGEC), Shanghai, China, 22–24 August 2024; pp. 500–504. [Google Scholar] [CrossRef]
- Ismail, L.; Materwala, H.; Dankar, F.K. Machine Learning Data-Driven Residential Load Multi-Level Forecasting with Univariate and Multivariate Time Series Models Toward Sustainable Smart Homes. IEEE Access 2024, 12, 55632–55668. [Google Scholar] [CrossRef]
- Ravi Kumar, M.; Panda, S.K.; Guruguluri, V.R.; Potluri, N.; Kolli, N. Forecasting Carbon Dioxide Levels Using Autoregressive Integrated Moving Average Model. In Proceedings of the 2nd International Conference on Artificial Intelligence and Signal Processing (AISP), Vijayawada, India, 12–14 February 2022; pp. 1–5. [Google Scholar] [CrossRef]
- Jiang, J.; Zhao, W.; Ou, M.; Wang, T.; Huang, G. The Practical Engineering Application of Improved Grey Prediction Model in Power Load Forecasting. In Proceedings of the 3rd International Conference on Intelligent Power and Systems (ICIPS), Shenzhen, China, 20–22 October 2023; pp. 193–199. [Google Scholar] [CrossRef]
- Peng, T.; Sun, Y.; Zheng, Y.; Ge, L.; Jin, F.; Wang, C. Application of Grey Prediction Model Based on Python in Carbon Emission Prediction and Low-Carbon Economic Development Analysis. In Proceedings of the International Conference on Network, Multimedia and Information Technology (NMITCON), Bengaluru, India, 1–2 September 2023; pp. 1–6. [Google Scholar] [CrossRef]
- Shabri, A. An Optimized Kernel Grey Model for Carbon Dioxide Emissions Forecasting. In Proceedings of the 2024 IEEE 14th Symposium on Computer Applications & Industrial Electronics (ISCAIE), Penang, Malaysia, 24–25 May 2024; pp. 72–76. [Google Scholar] [CrossRef]
- Wang, J.; Wang, T.; Shao, X. Carbon emission forecast of China Transport Industry Based on Grey-Markov. In Proceedings of the 7th International Conference on Intelligent Computing and Signal Processing (ICSP), Xi’an, China, 15–17 April 2022; pp. 984–990. [Google Scholar] [CrossRef]
- Ghalandari, M.; Forootan Fard, H.; Komeili Birjandi, A.; Mahariq, I. Energy-related carbon dioxide emission forecasting of four European countries by employing data-driven methods. J. Therm. Anal. Calorim. 2021, 144, 1999–2008. [Google Scholar] [CrossRef]
- Carbon Dioxide Emissions Separated by Fuel Type and Economic Sector. Available online: https://www.eppo.go.th/index.php/th/ (accessed on 20 December 2024).
- Maximum Demand for Electric Power. Available online: https://www.egat.co.th/home/statistics-demand-annual/ (accessed on 1 January 2023).
- Number of Electricity Users. Available online: https://www.mea.or.th/profile/122/ (accessed on 20 December 2024).
Disclaimer/Publisher’s Note: The statements, opinions and data contained in all publications are solely those of the individual author(s) and contributor(s) and not of MDPI and/or the editor(s). MDPI and/or the editor(s) disclaim responsibility for any injury to people or property resulting from any ideas, methods, instructions or products referred to in the content. |
© 2025 by the authors. Licensee MDPI, Basel, Switzerland. This article is an open access article distributed under the terms and conditions of the Creative Commons Attribution (CC BY) license (https://creativecommons.org/licenses/by/4.0/).