1. Introduction
Advanced Driver Assistance Systems (ADAS) are a collection of technologies designed to assist drivers improve vehicle safety and efficiency of driving.
As most road accidents are caused by human error [
1], ADAS were developed to automate, adapt, and improve vehicle technology to ensure safety and better driving. ADAS has been shown to reduce road accidents by minimizing human error [
2]. The safety features are designed to prevent accidents and collisions by alerting the driver to potential problems, implementing protections, and taking control of the vehicle when necessary. ADAS can provide adaptive cruise control, help avoid collisions, warn the driver of potential obstacles, give lane departure warnings, assist with lane centering, incorporate satellite navigation, provide traffic alerts, automate lighting, or offer other functions.
Given their proven centrality in reducing road deaths, their development plays a key role in the European project known as “Vision Zero”, an initiative that aims to reduce road deaths to zero by 2050 [
3].
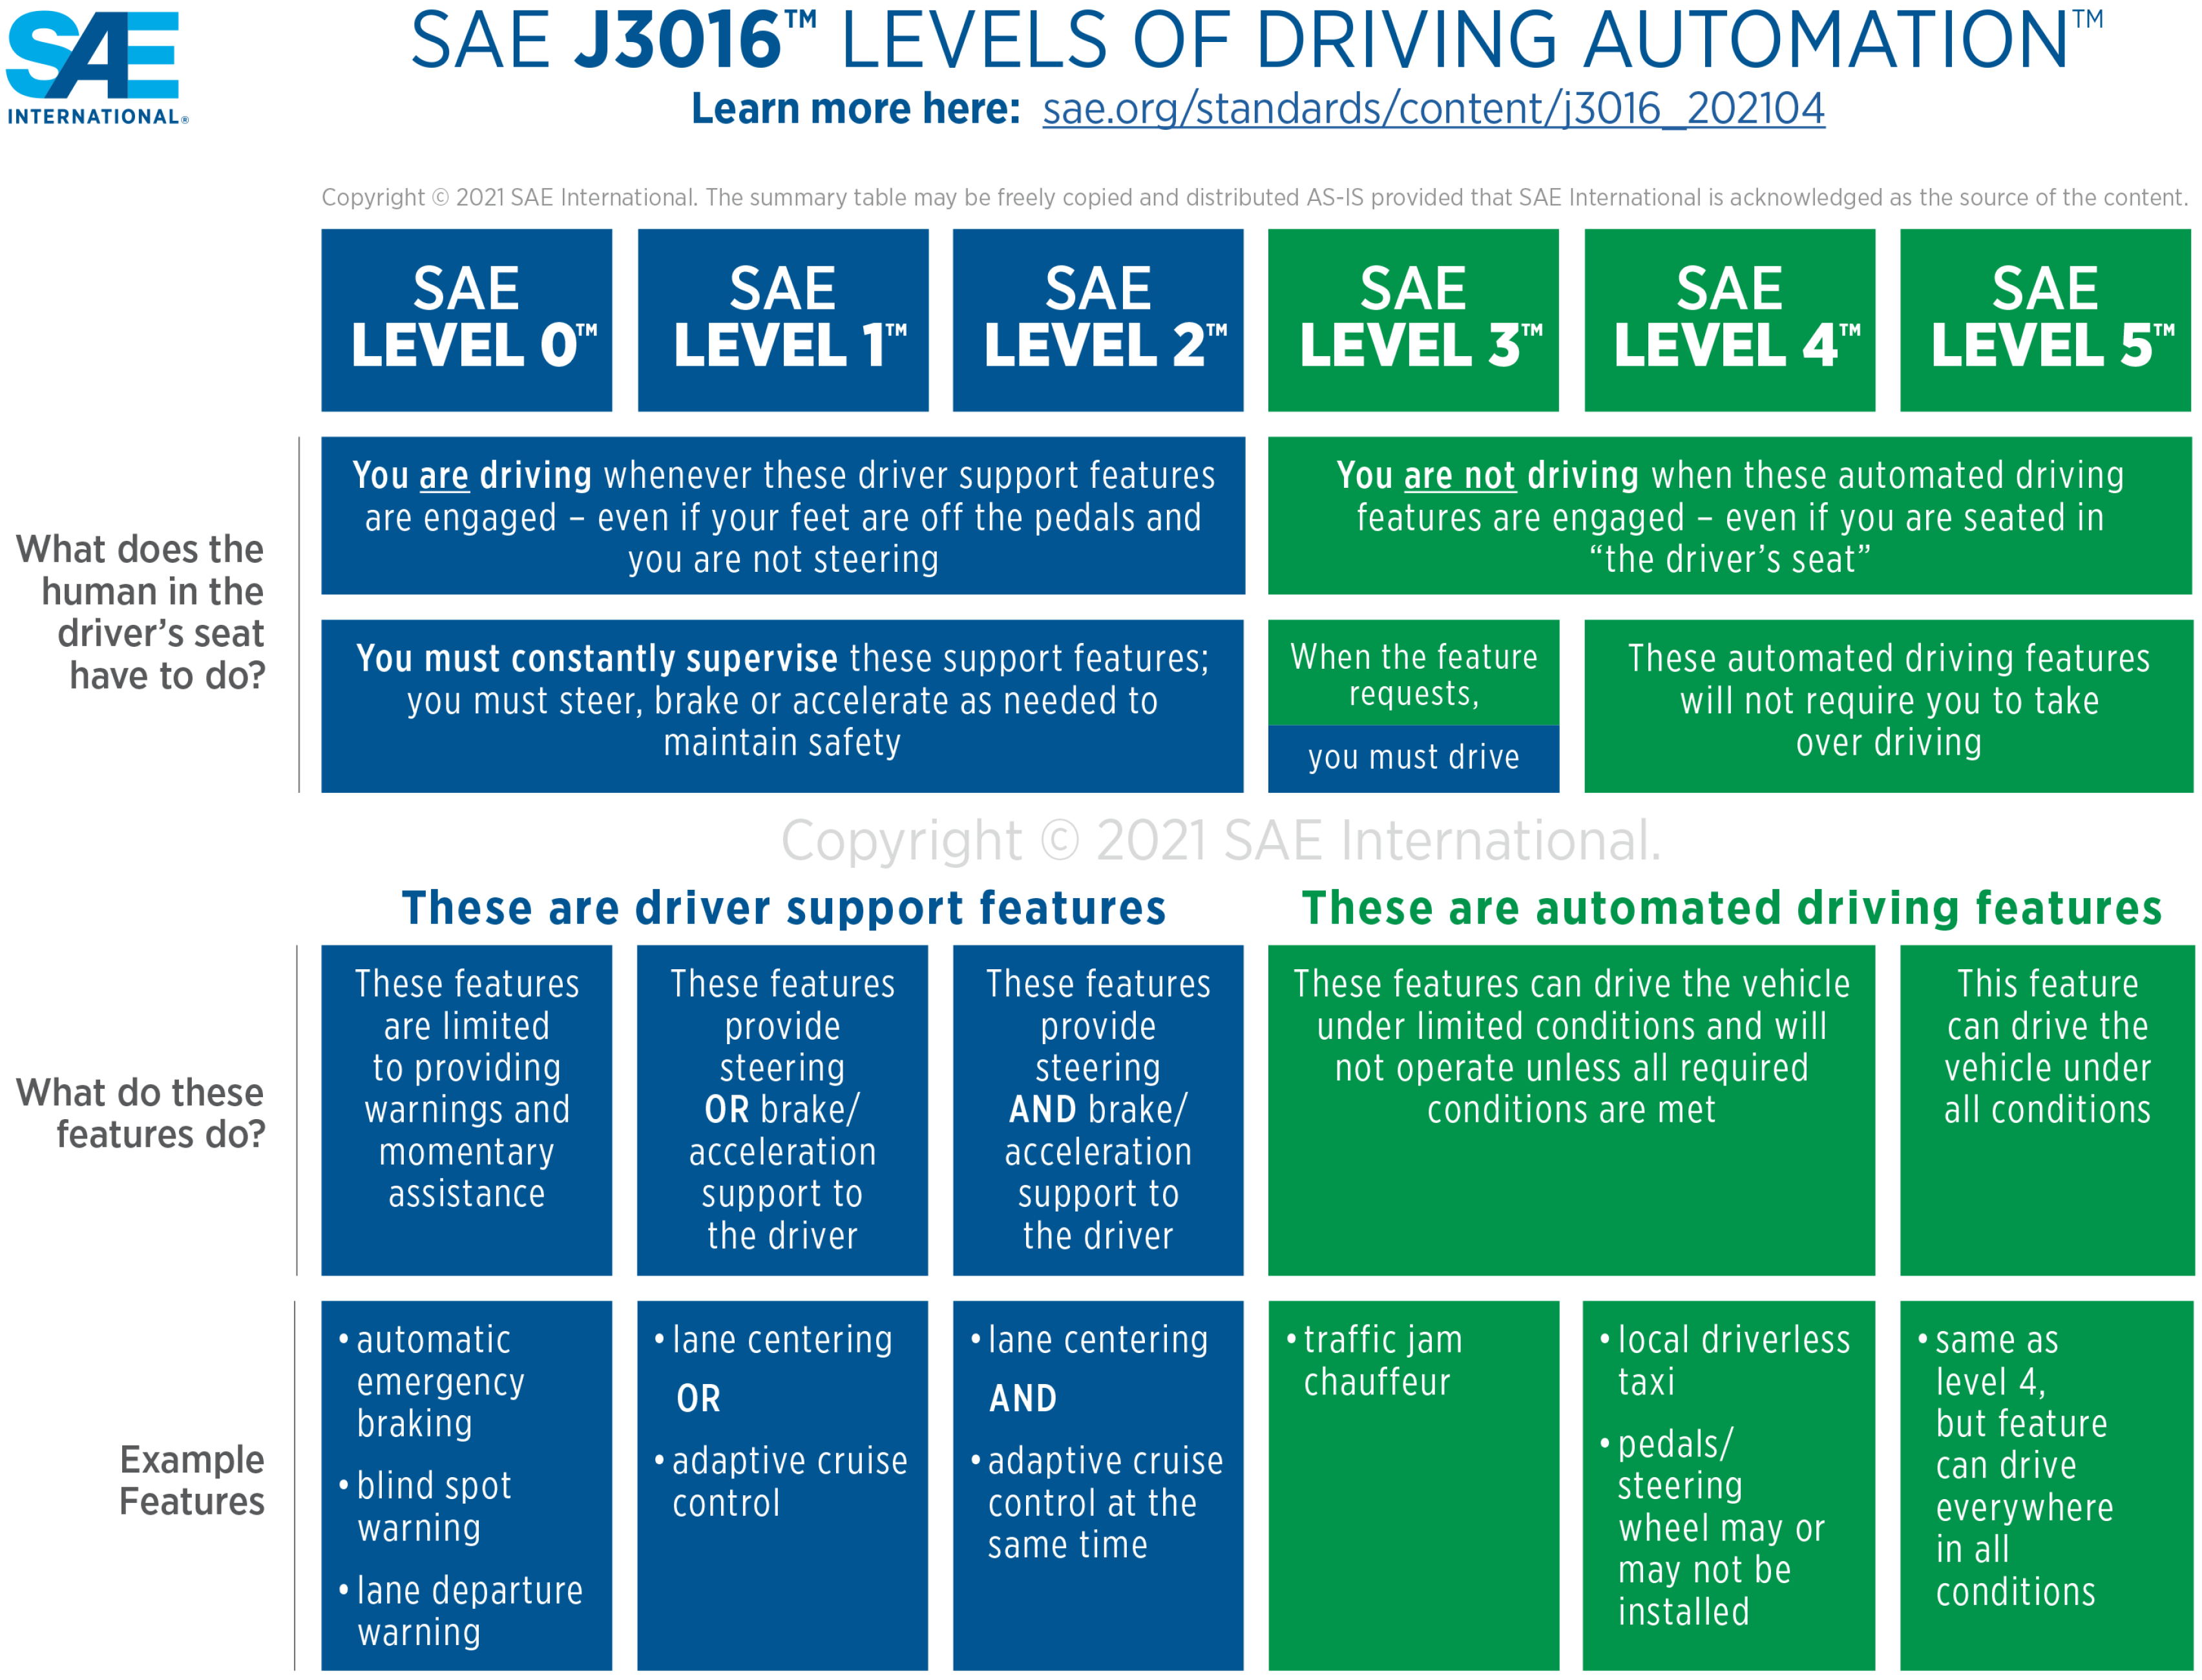
ADAS can enable various levels of autonomous driving, precisely they can be divided into six levels based on the amount of automation [
4]. In Level 0, ADAS cannot control the car and can only provide information for the driver to interpret on their own, while Level 5 is where the vehicle is fully autonomous. Intermediate levels differ in a gradual increase in the system’s ability to override human action and decision, as shown in
Figure 1.
Because human error is the main cause of road accidents, the ADAS systems that have the greatest impact on reducing accident death are those at levels greater than zero. In particular, Level 2 and Level 3 systems, which, unlike their predecessors, involve the system taking active control over driving, are those on which the greatest investment is expected in the near future.
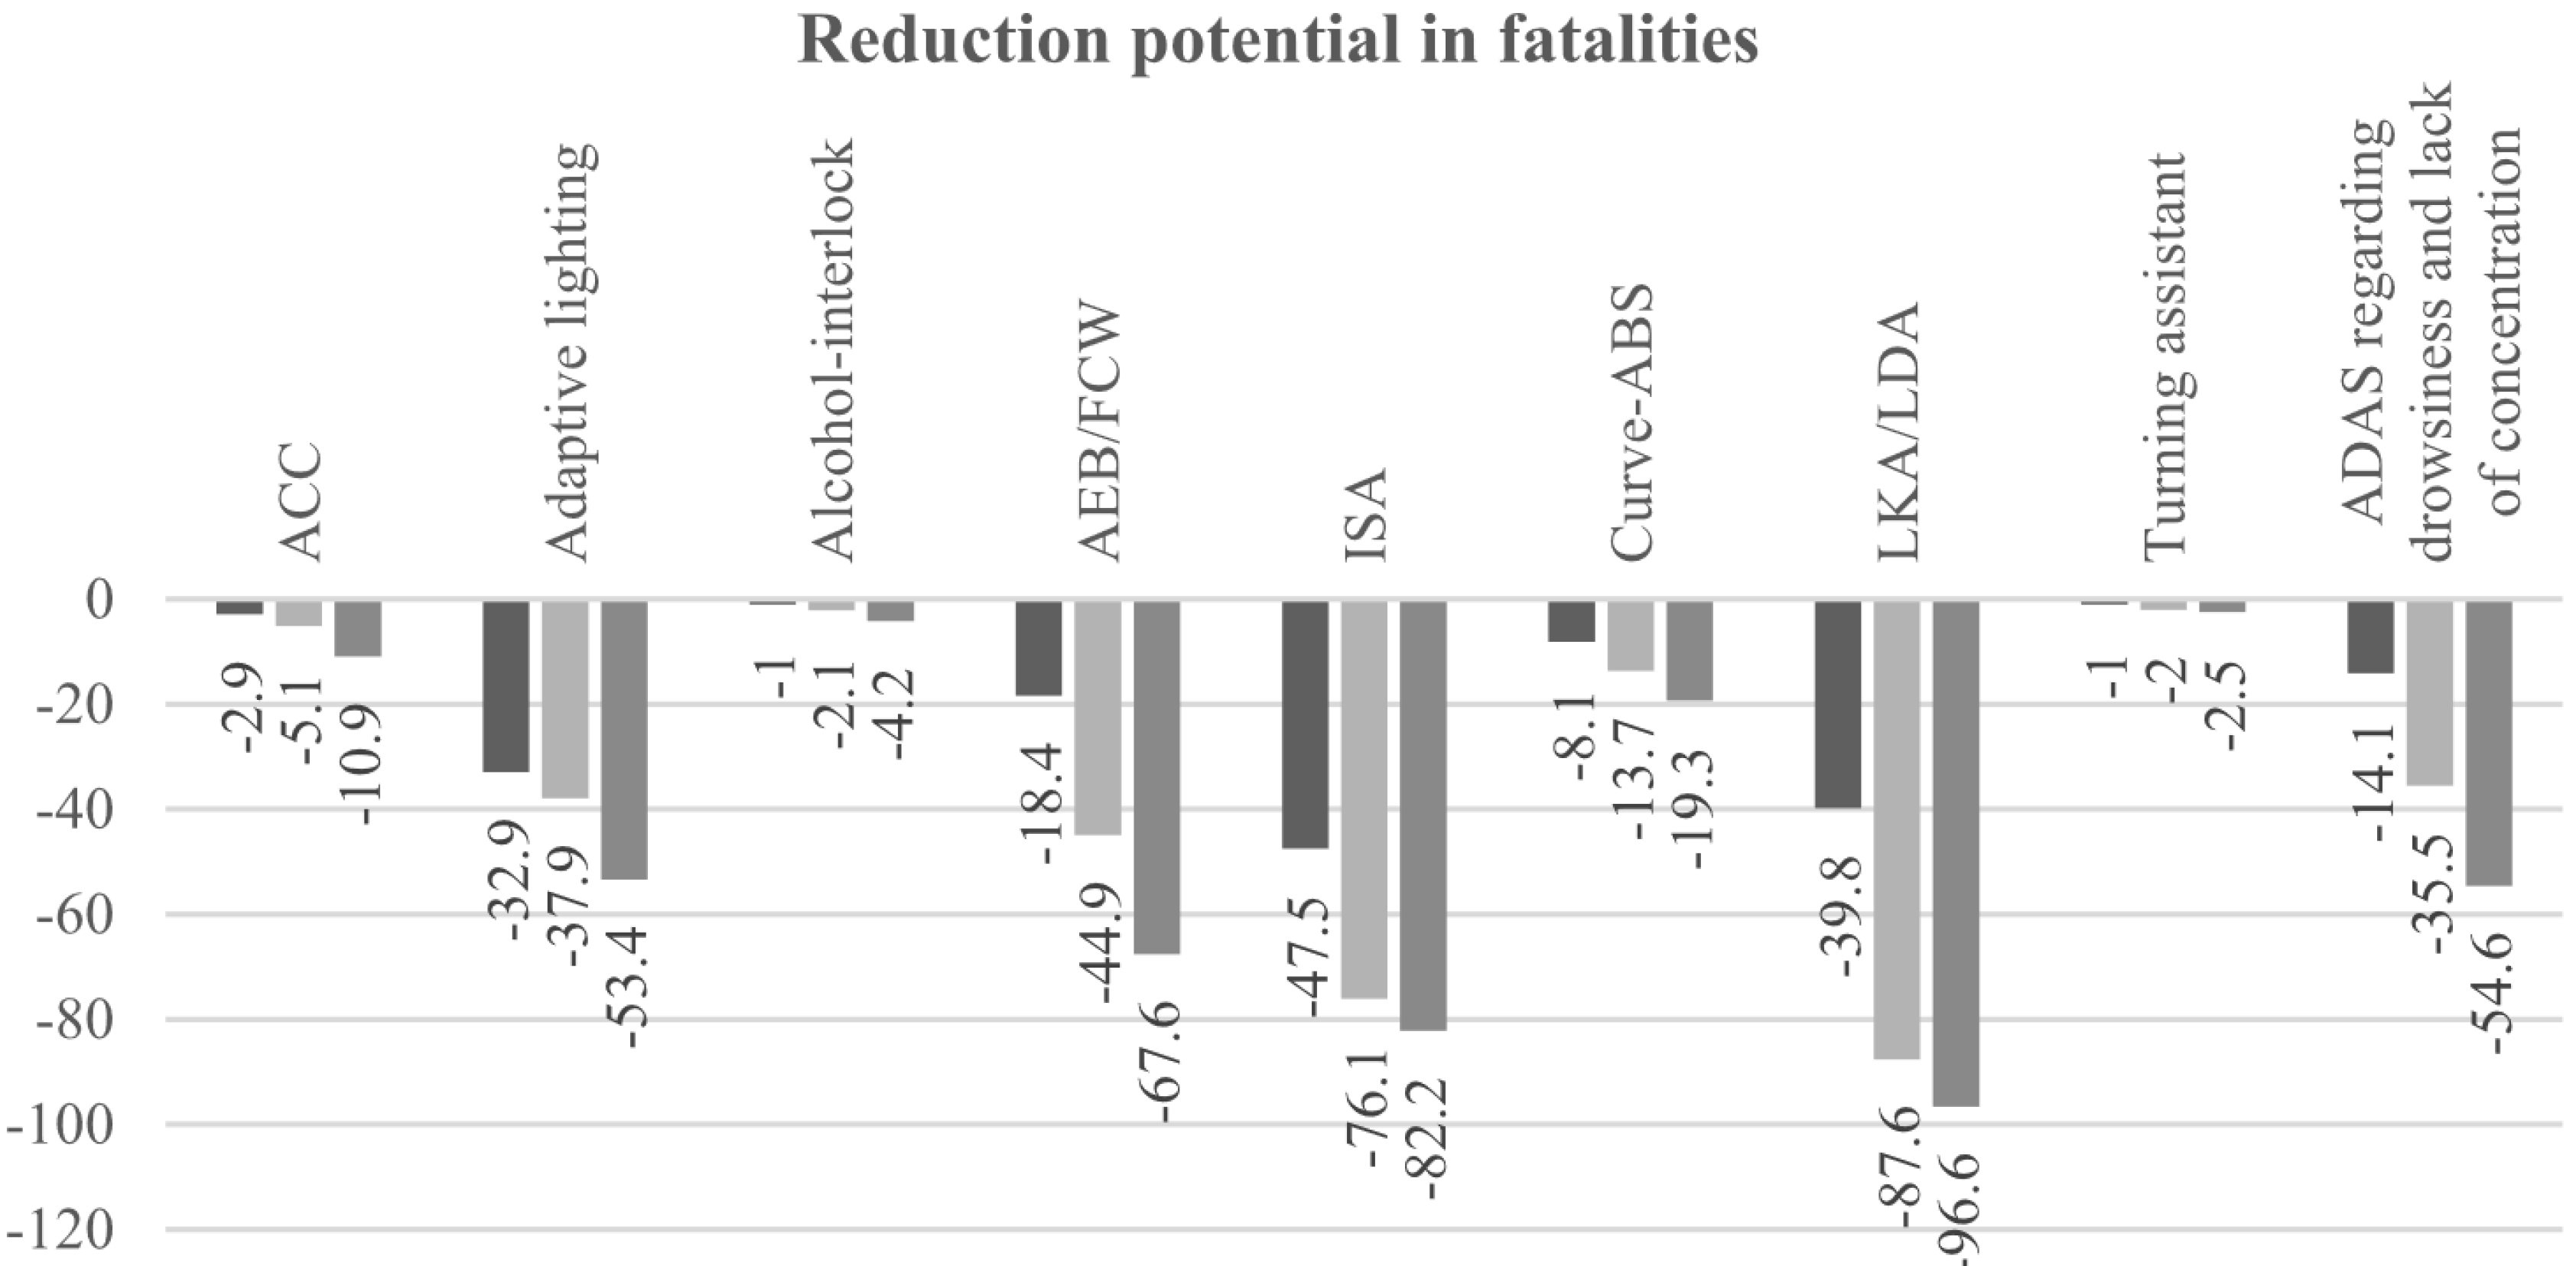
The most interesting among these are driver assistance systems designed to help prevent unwanted lane departures, commonly referred to as LKA/LDA systems. These systems detect when a vehicle drifts out of its lane without a turn signal and then alert the driver (LDA) or automatically provide corrective steering inputs to keep the car centered (LKA).
In fact, recent studies [
5] have quantified the safety impact of some of the most promising ADAS systems; when considering fatal accidents, the LKA/LDA systems promise the highest reduction, which can be estimated to be more than
by 2040, as shown in
Figure 2.
Considering, therefore, the expected impact of ADAS systems in general and LKA/LDA in particular in lowering road accident numbers and the commitment that government agencies, first and foremost the European Union, are putting on the topic, there is an increasing need for an objective and commonly accepted framework that can enable, standardize, and regulate their development, testing, and validation.
2. A KPI Based Methodology
The central idea behind the development of a methodology for the testing and validation of ADAS systems is to identify a number of KPIs that would allow us to quantify the performance of the system, looking at it from different perspectives (each captured by a specific KPI). Such a framework would allow us both to effectively understand the performance of the system as a whole, taking all the indicators together, and to identify what specific aspects can be improved, working on the individual KPI. In addition, KPIs will be designed to be stable and equally good at testing the system in the following environments:
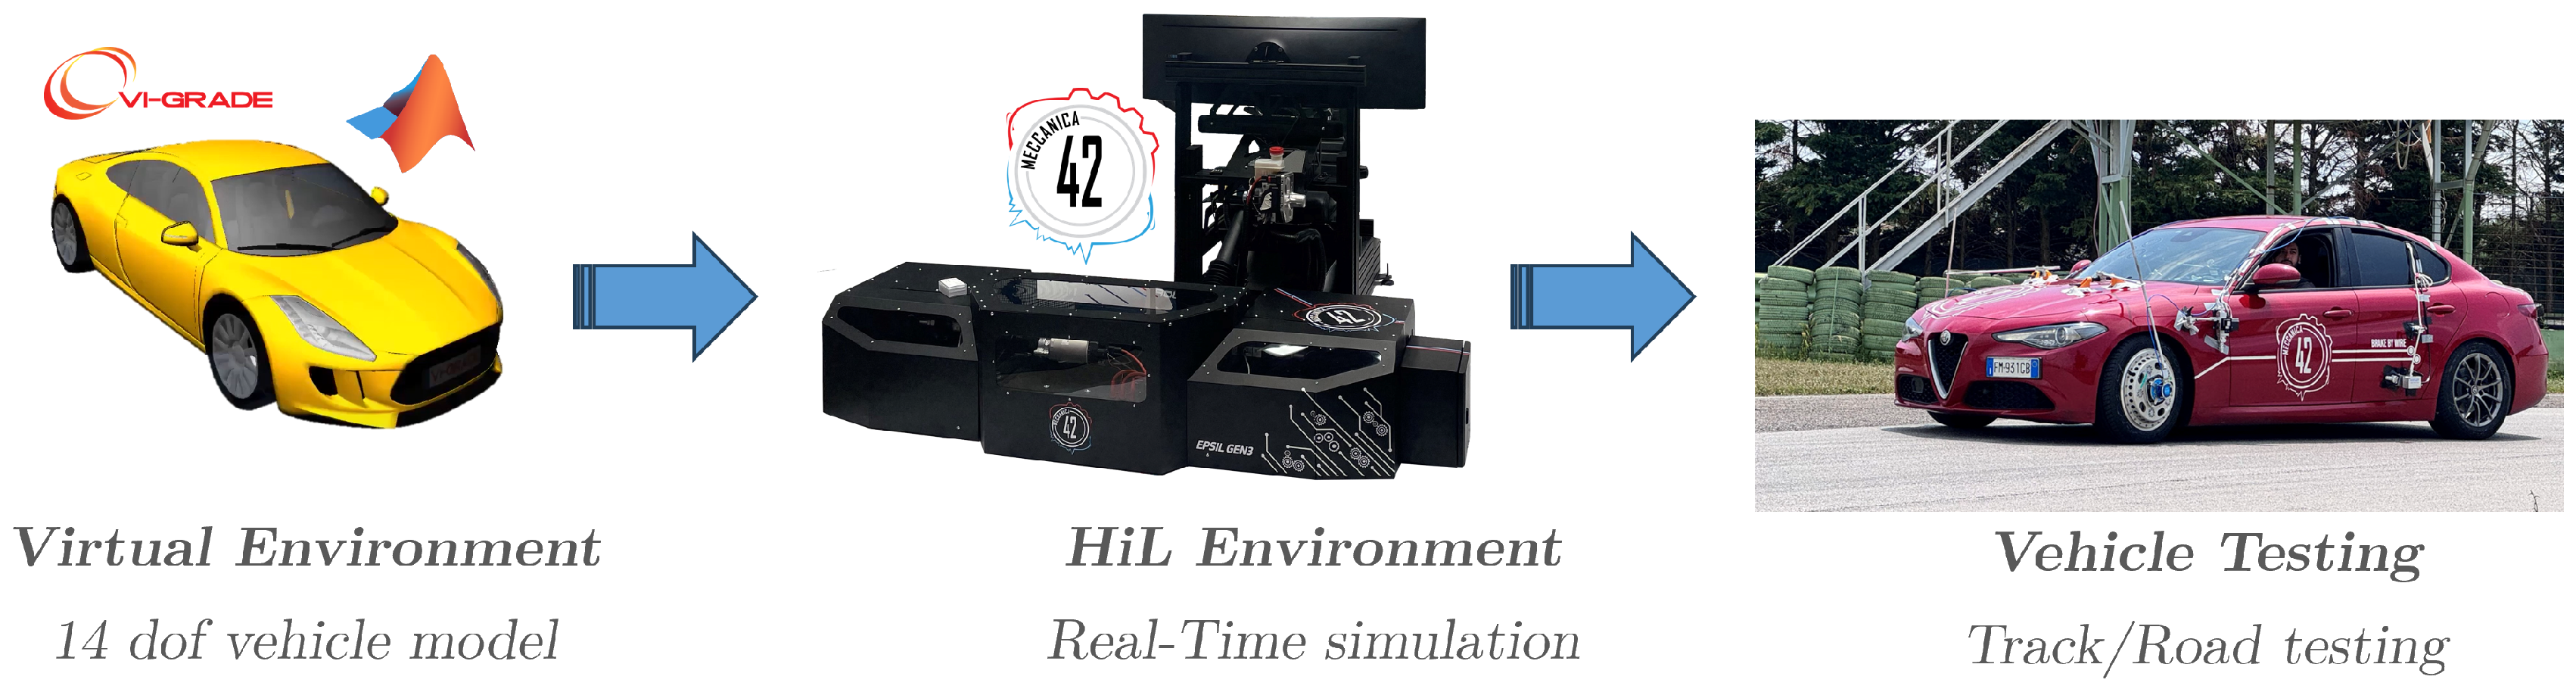
Virtual Environment
HiL Environment
Vehicle Testing
This stability of the framework across environments is of central importance because, by being able to test the system effectively already in a virtual environment, the reduction in cost and time spent on testing activities would obviously be considerable. Furthermore, by reducing the number of actual road tests, the possibility of accidents at this stage would inevitably be reduced, as a system would arrive on the road that had already been tested in at least two phases and possibly already corrected and improved.
In addition, the ability to use the same KPIs in a HiL environment would allow for fairly reliable first estimates of what the driver’s perception of the driving experience is before entering the car. The HiL environment represents a meeting point between the world of non-real-time virtual simulation and in-car testing (
Figure 3), so that human perception can be incorporated in the analysis from the earliest stages of simulation. Various studies are increasingly making use of this environment to guide the development of various systems [
6,
7,
8]. Thus, the simulation in the HiL environment will represent the central point at which both the insights that come out of testing in the virtual environment and those on the road should converge and thus represents the end point of the entire framework.
At the current state of the work, we have indeed focused on creating a solid foundation in the virtual environment of non-real-time simulation, keeping in mind, however, that the ultimate goal will be to transfer the methodology to the HiL environment as well.
Virtual Environment Setup
In order to develop an effective methodology to guide the evolution of an ADAS system design, it is crucial to take advantage of the offline virtual simulation environment by attempting to implement a robust methodology as early as this development environment.
Using this environment early on in development allows the testing and analysis of system behavior and performance without the need for specific hardware components. Offline simulations in these early stages have a low budget impact and allow for the identification and reduction of errors and contingencies that, in the later stages of the project, can lead to an expected performance deficit.
To ensure a robust methodological approach, it is essential to use as realistic a virtual model of the system under development as possible from the outset. This model must not only represent the ideal behavior but also simulate the real defects and perturbations of the system components.
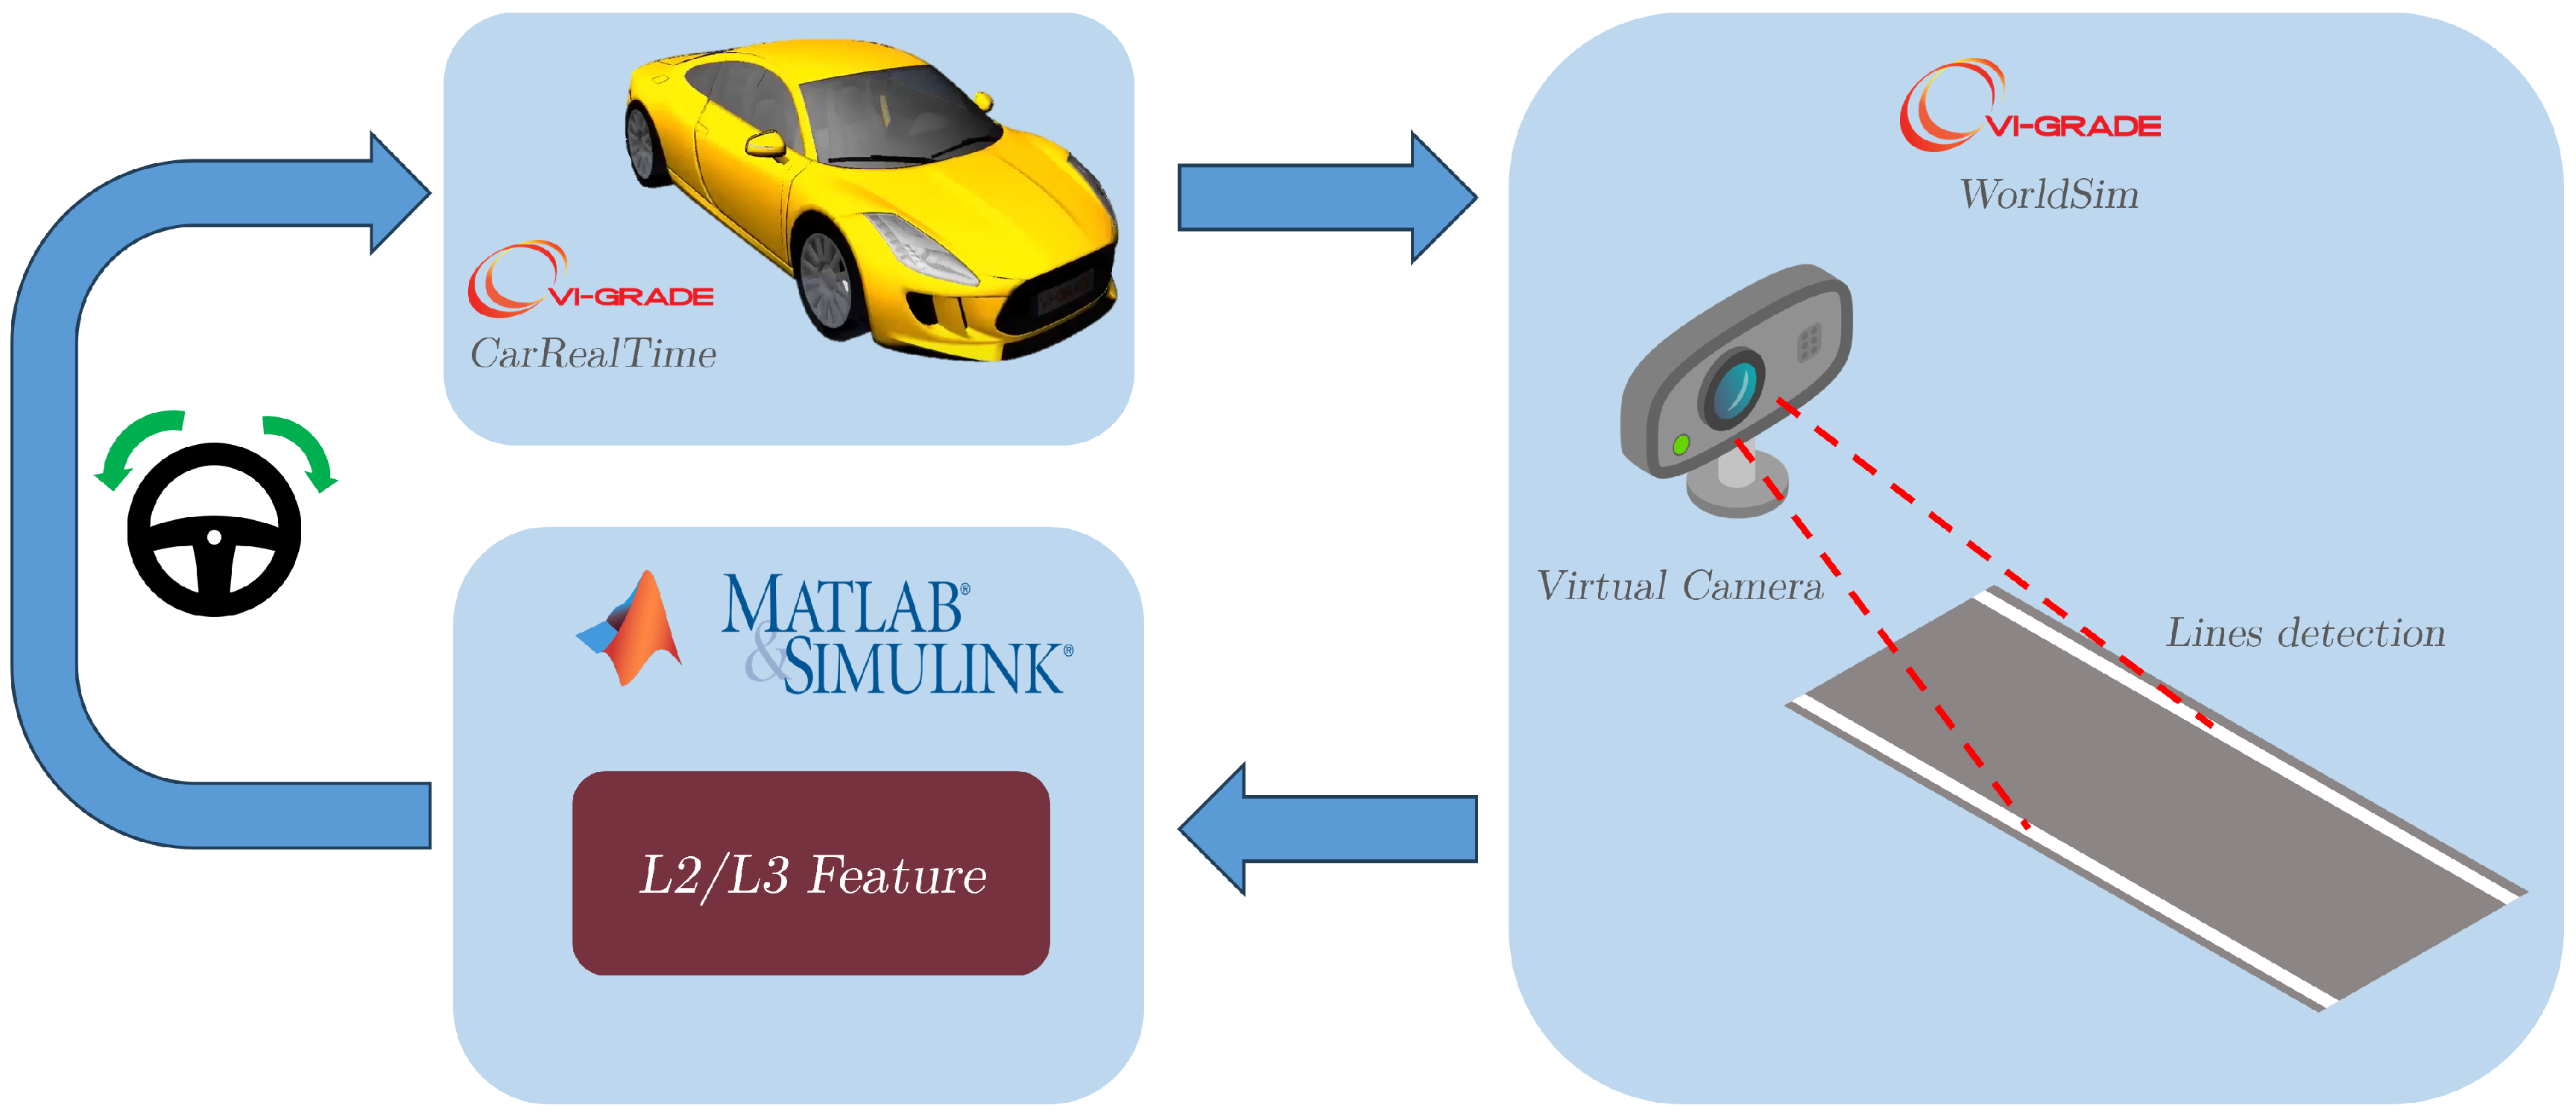
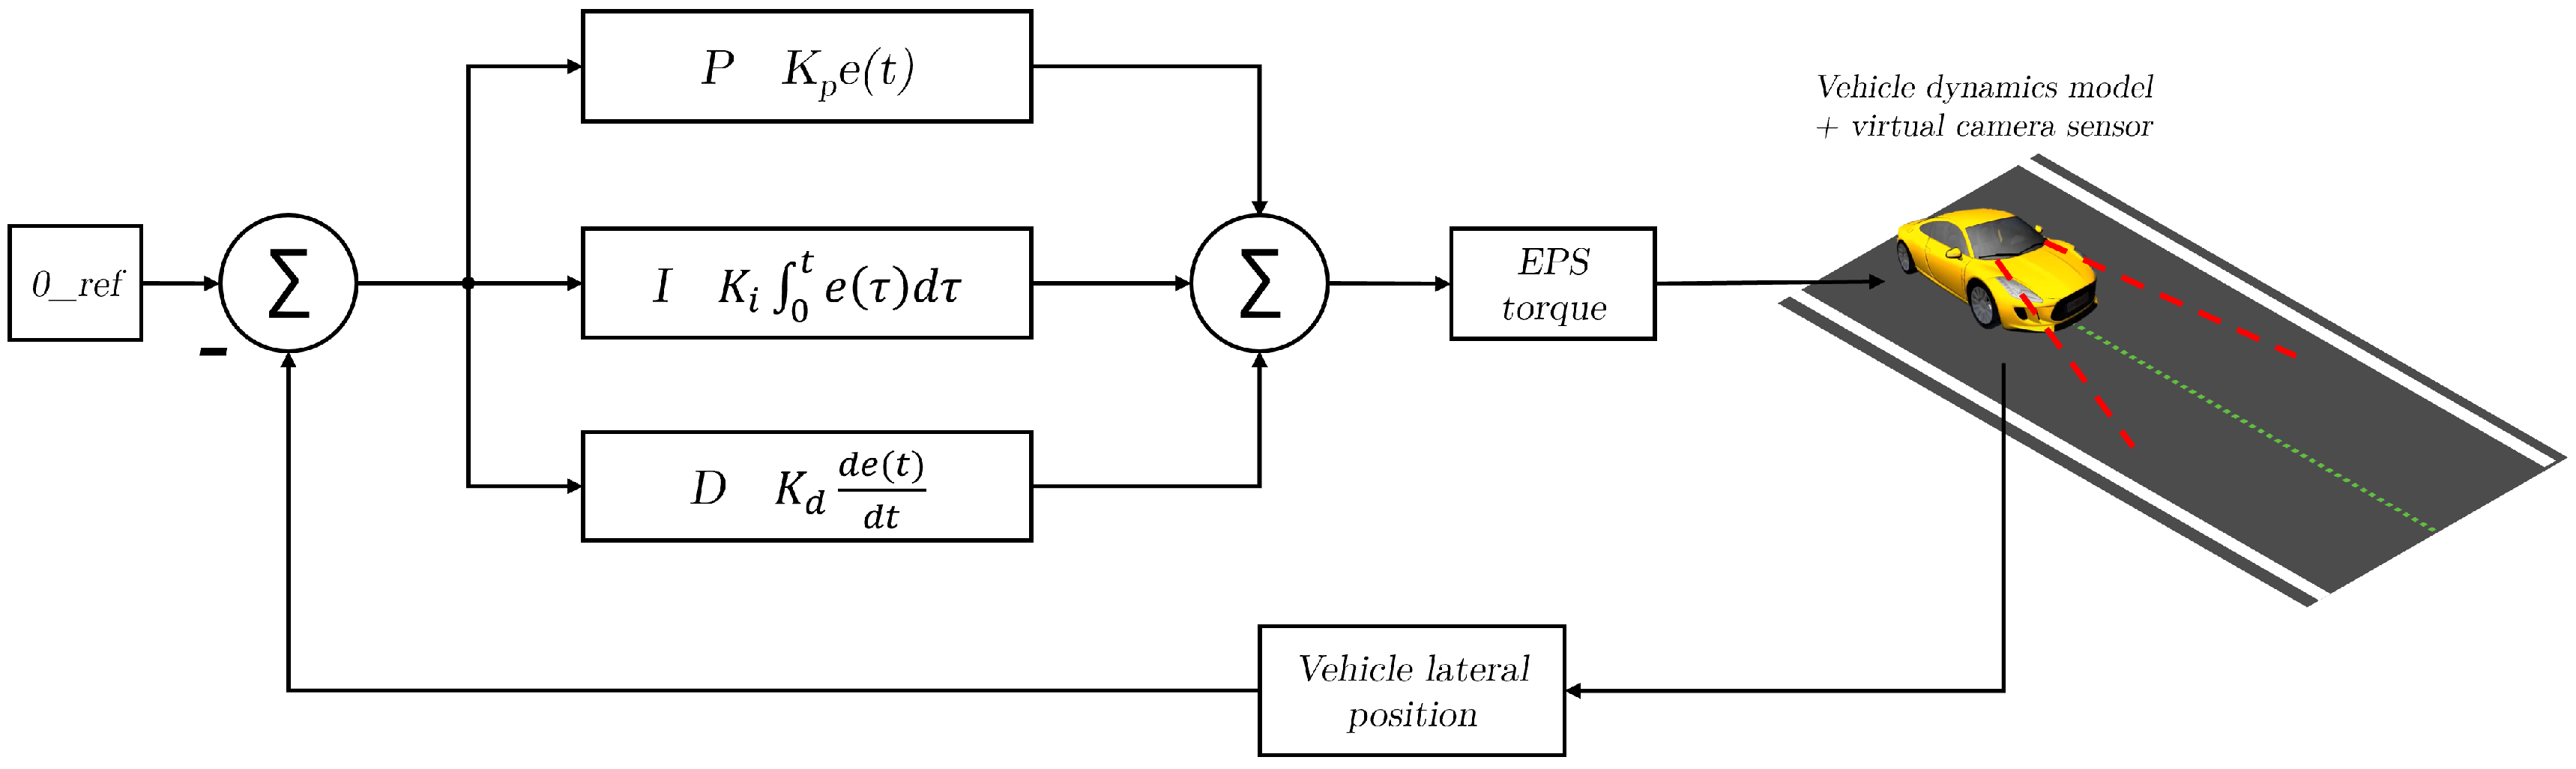
In this case, starting from experimental data collected through track tests and reverse engineering techniques, it has been possible to reproduce a vehicle model equipped with an ADAS lane-keeping system (Lane Centering) in the VI-Grade CarRealTime environment. This tool enables high-fidelity simulation of vehicle dynamics, accurately reproducing its behavior in real scenarios. For the lane-keeping functionality, a model in Matlab Simulink based on a PID control has been developed that corrects the position error with respect to the lane center. The system acts by modifying the steering torque provided by the EPS in the CarRealTime vehicle model to make the necessary correction to center the vehicle inside the lane.
One of the key aspects of this technology is determining the car’s position within the lane, which in real cars is achieved by a camera that detects lane lines and calculates the vehicle’s position error relative to the lane center [
6,
9,
10]. To simulate this function realistically, the Vi-Grade WorldSim suite was used, which allows virtual sensors, such as radars and cameras, to be modeled. In particular, the “Virtual Camera” module was exploited to achieve this purpose, which also offers the possibility of varying the performance of the modeled camera.
Figure 4 illustrates the interactions between the various tools mentioned, while
Figure 5 shows the implemented trajectory control logic.
Thanks to the integration between the CarRealTime, WorldSim, and Matlab Simulink suites, it was possible to create a tool that reproduces the real behavior of the vehicle-tested lane-keeping system in an off-line simulation environment. This synergy allows the functionality of ADAS to be tested in a virtual environment in which it is possible to vary the environmental conditions, the characteristics of the vehicle itself, and the performance of the simulated sensors, without the need for any hardware components at this stage.
3. KPIs Overview
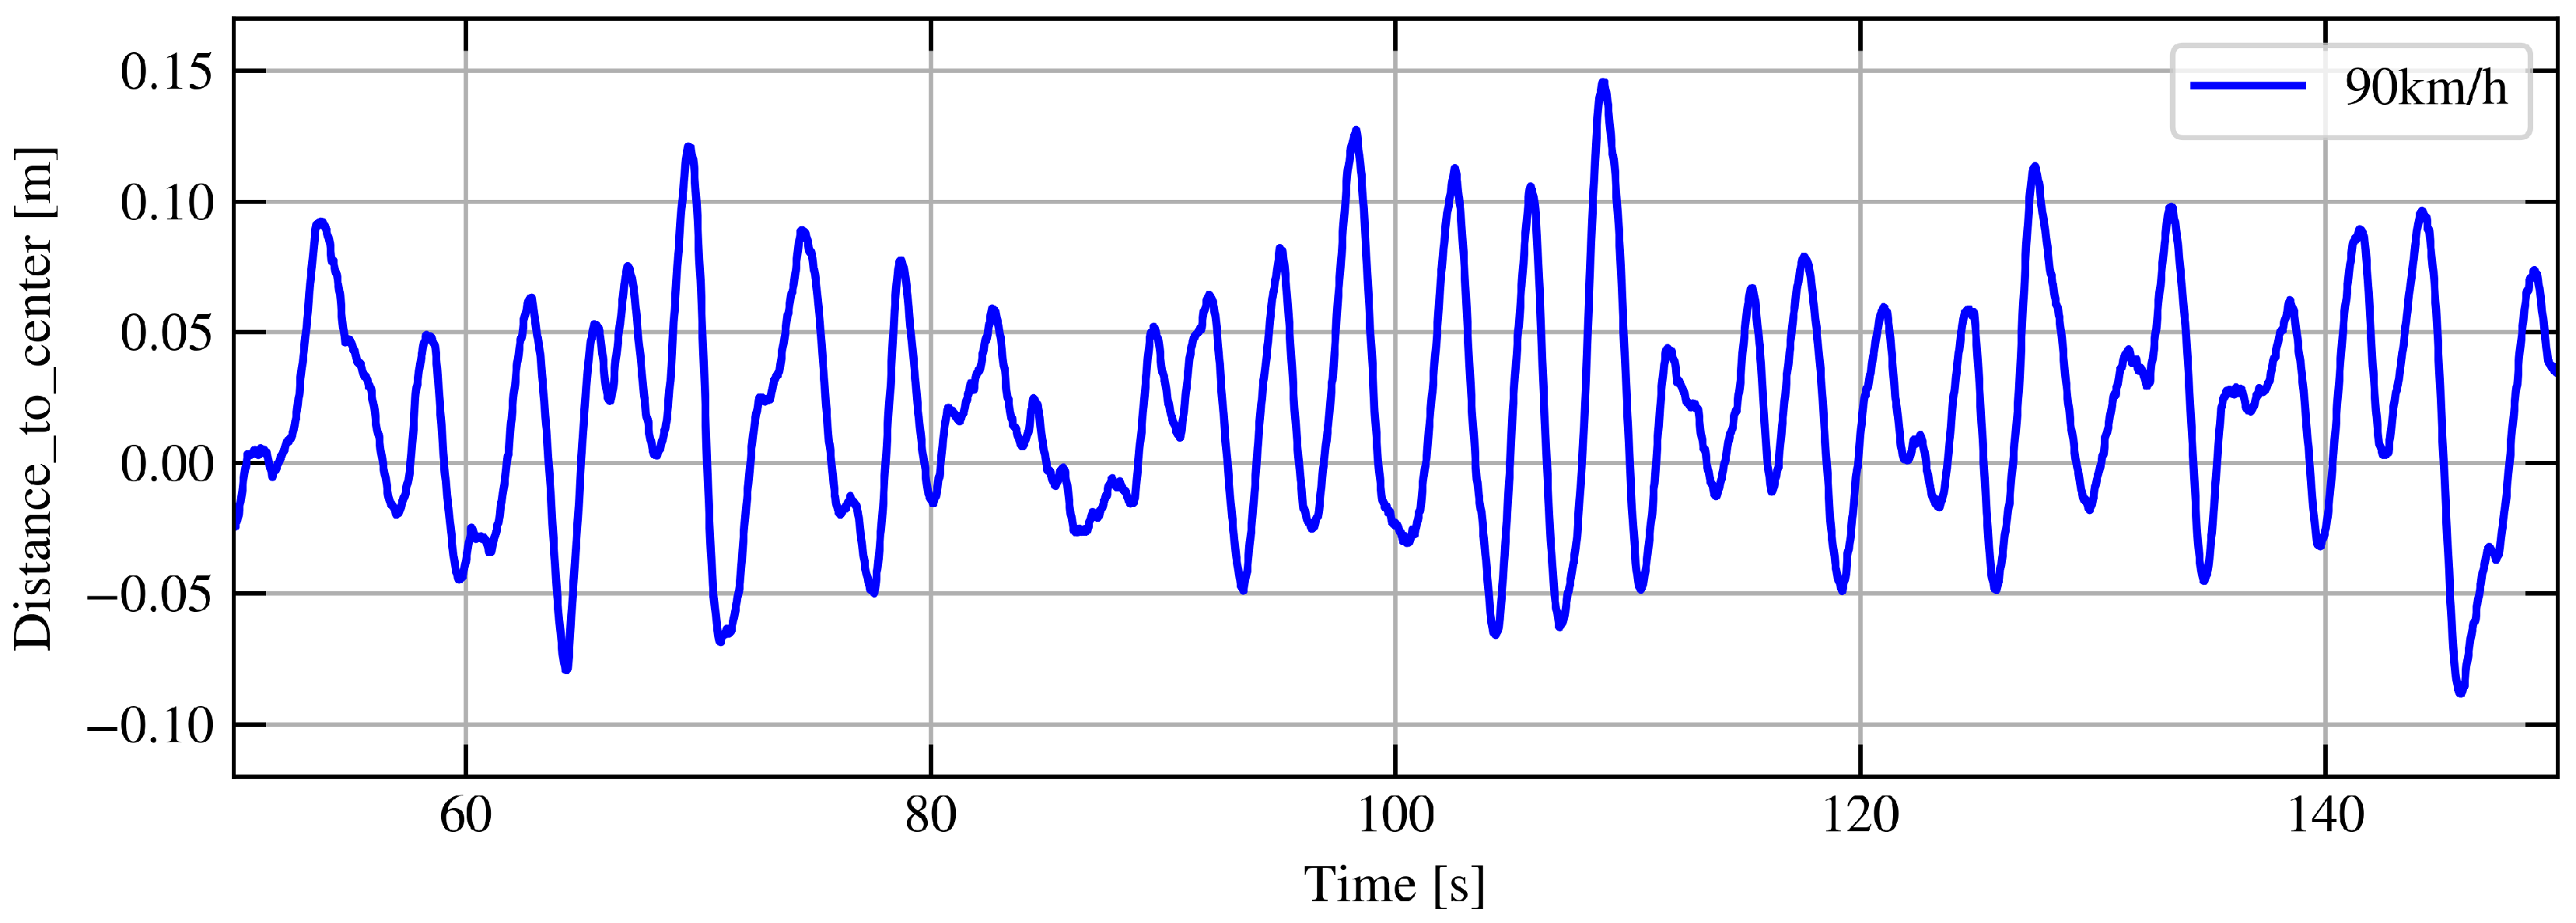
Using the tool combinations explained in the previous section, it was possible to test the behavior of the system in a straight-line scenario by identifying and selecting some KPIs to summarize specific aspects of the system performance. Among these, a greater focus was placed on the lateral oscillation frequency, the standard deviation of the lateral position, and the offset from the center of the lane as a function of vehicle speed.
Figure 6 displays the lateral displacement of the vehicle, as observed in a simulation performed at 90 km/h on a straight road without lateral inclination.
The lateral oscillation frequency has been used in the literature as an indicator to assess the annoyance that certain induced movements on people can cause [
11,
12]. In this case, it can be used in the same way to evaluate the performance of the system in relation to driving comfort, as passengers are subject to these movements for non-negligible times.
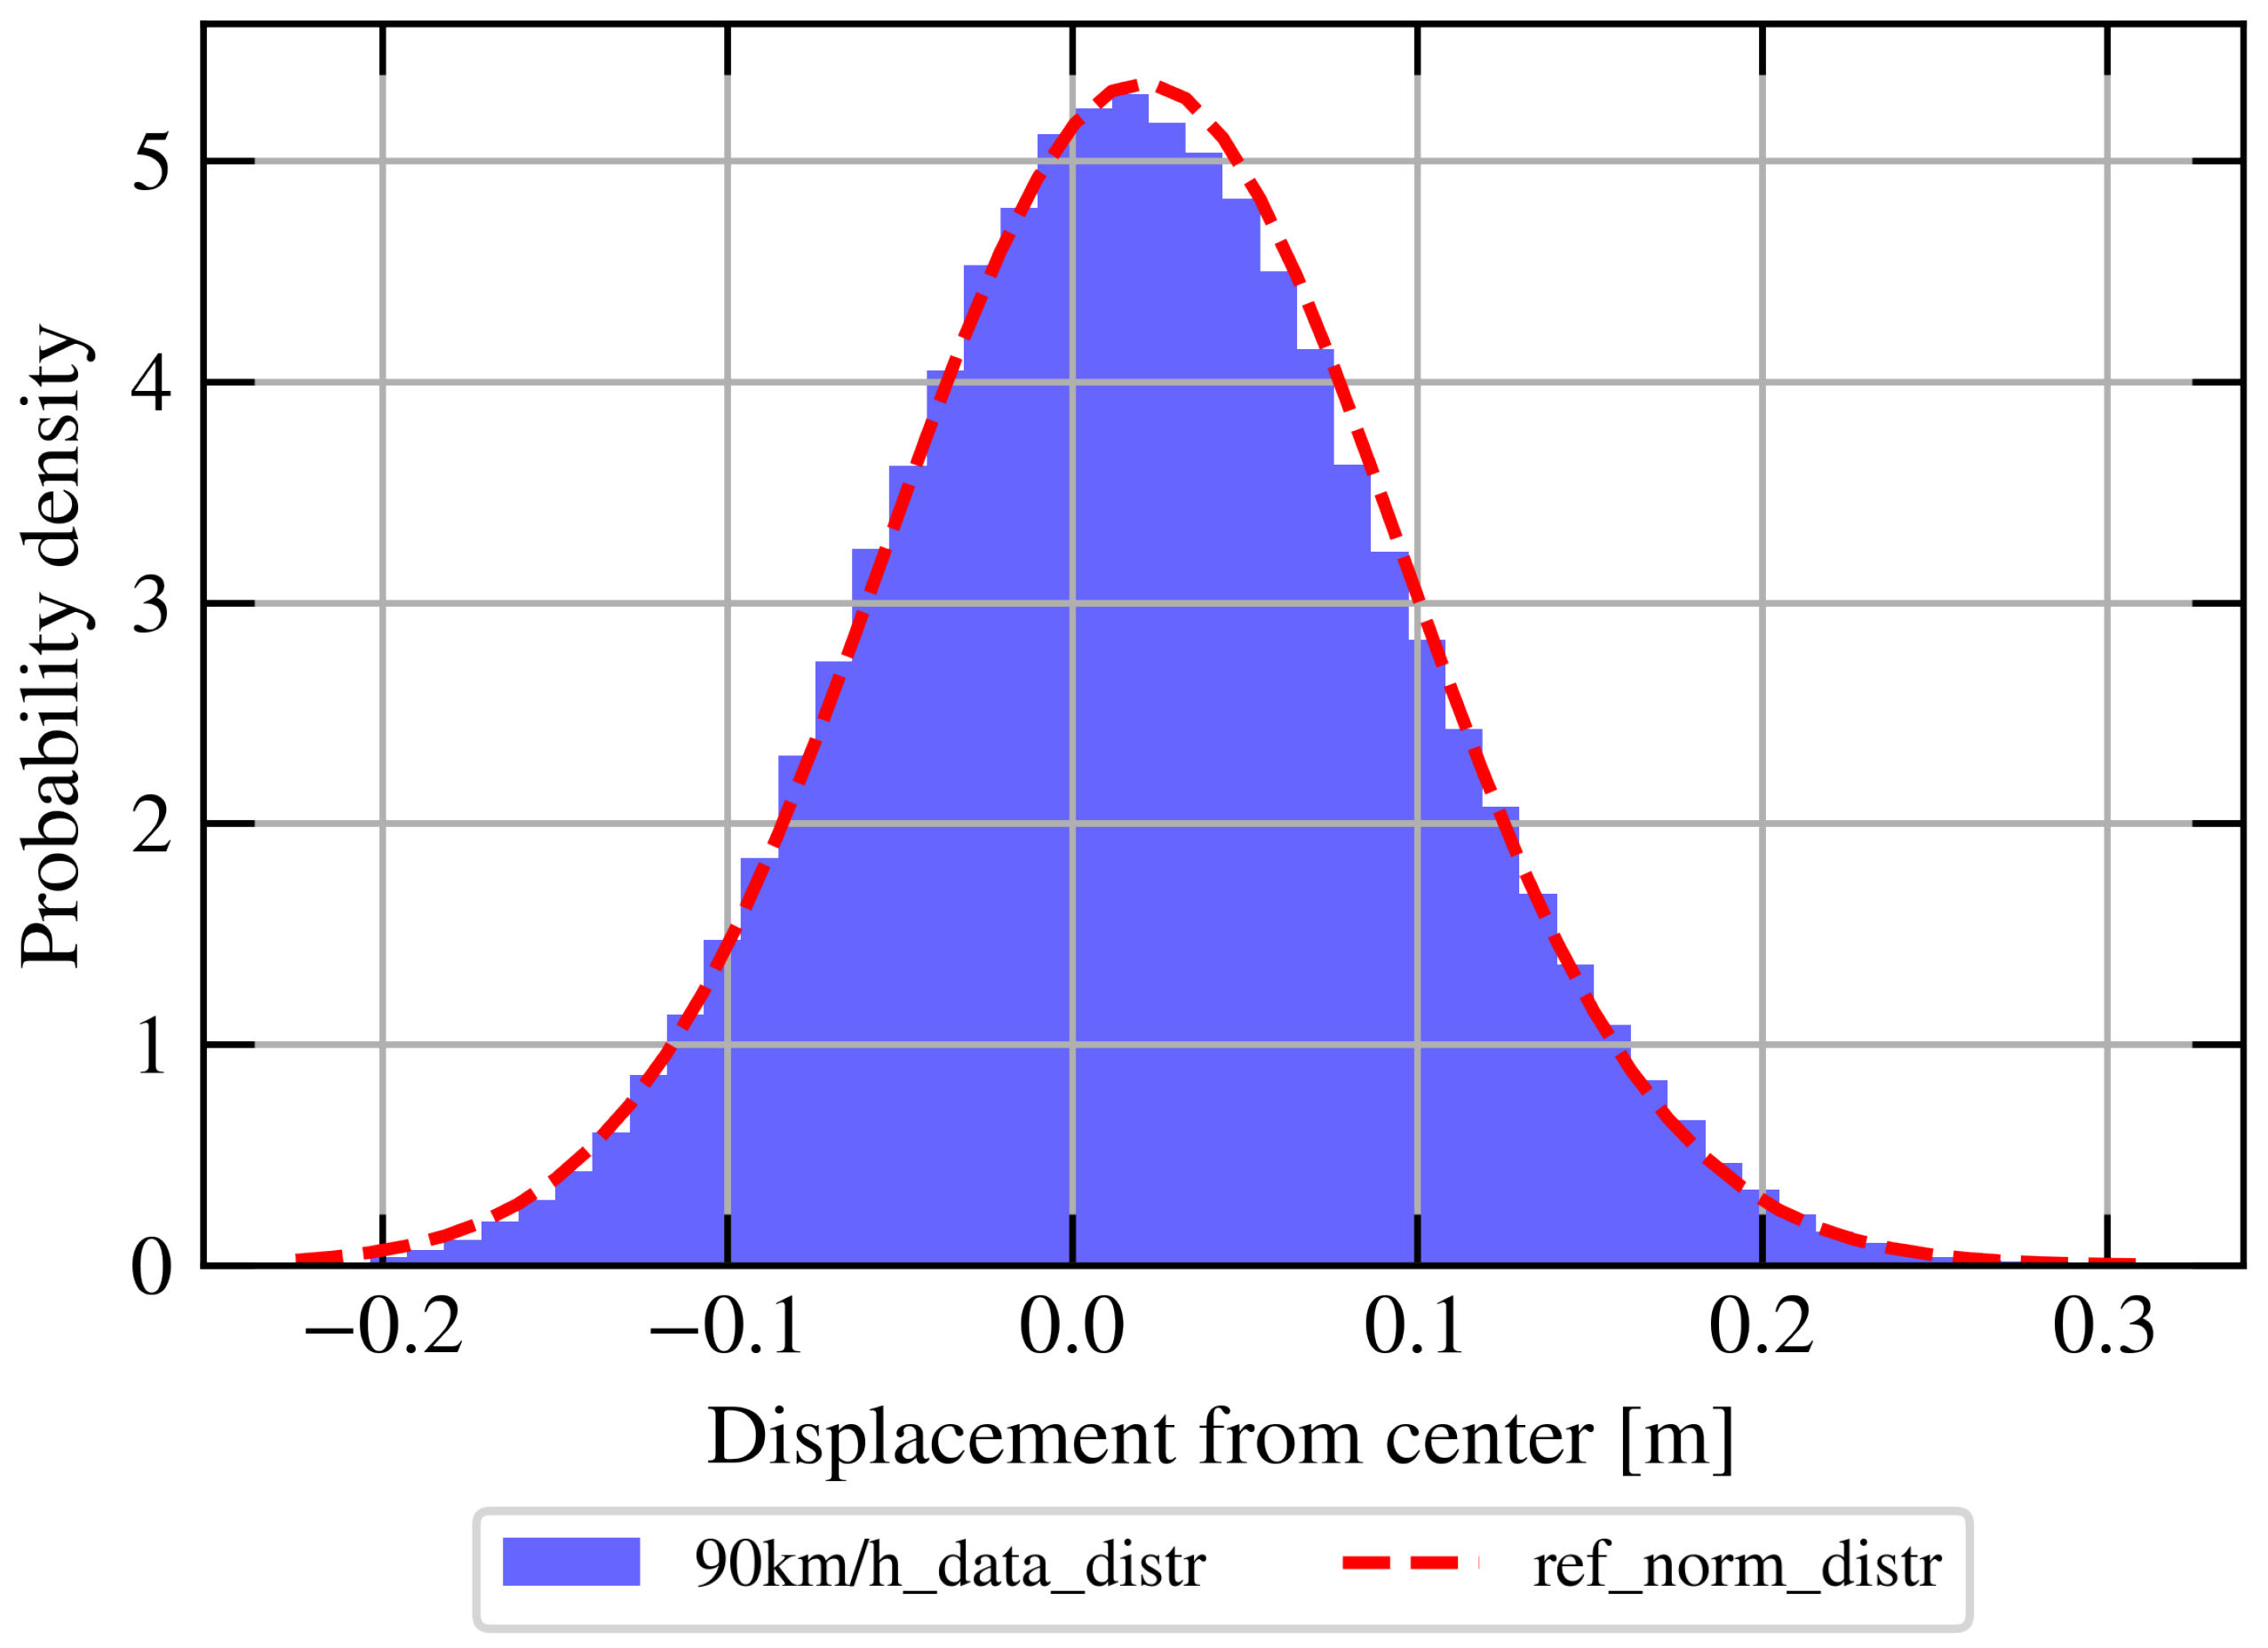
The standard deviation is applicable to lane-center deviation data obtained through straight-line simulations because, although the distribution of displacements does not represent a perfect Gaussian, it comes very close. As shown in
Figure 7, it can be seen that the distribution of the data overlaps almost perfectly with a reference normal Gaussian distribution. Analyzing the differences in detail, it is possible to use the Q–Q plot, which is widely used to analyze distributions [
13,
14]. It can be observed, as shown in
Figure 8, that for most data, those with higher probability density lie along the reference line while only the tails part diverge from the line. This particular distribution is called the light-tailed distribution, a probability distribution in which the tails decrease rapidly, meaning that it has fewer extreme values or outliers than a normal distribution. In statistical terms, light-tailed distributions have thinner tails, indicating that the probability of observing values far from the mean is lower. This also indicates that the analyzed system tends to be predictable, reducing the probability of high lane center deviation values compared to a system characterized by a normal Gaussian distribution. In the end, although these analyzed differences from a normal Gaussian distribution result in lower standard deviation values, the standard deviation turns out to be an excellent indicator to immediately visualize how much the ADAS system is able to not deviate from the straight-line trajectory traveled.
Instead, the offset from the center of the lane indicates how much the system is able to deviate from the ideal value on average; thus, how close its straight line trajectory in the lane is to the center of the lane [
15].
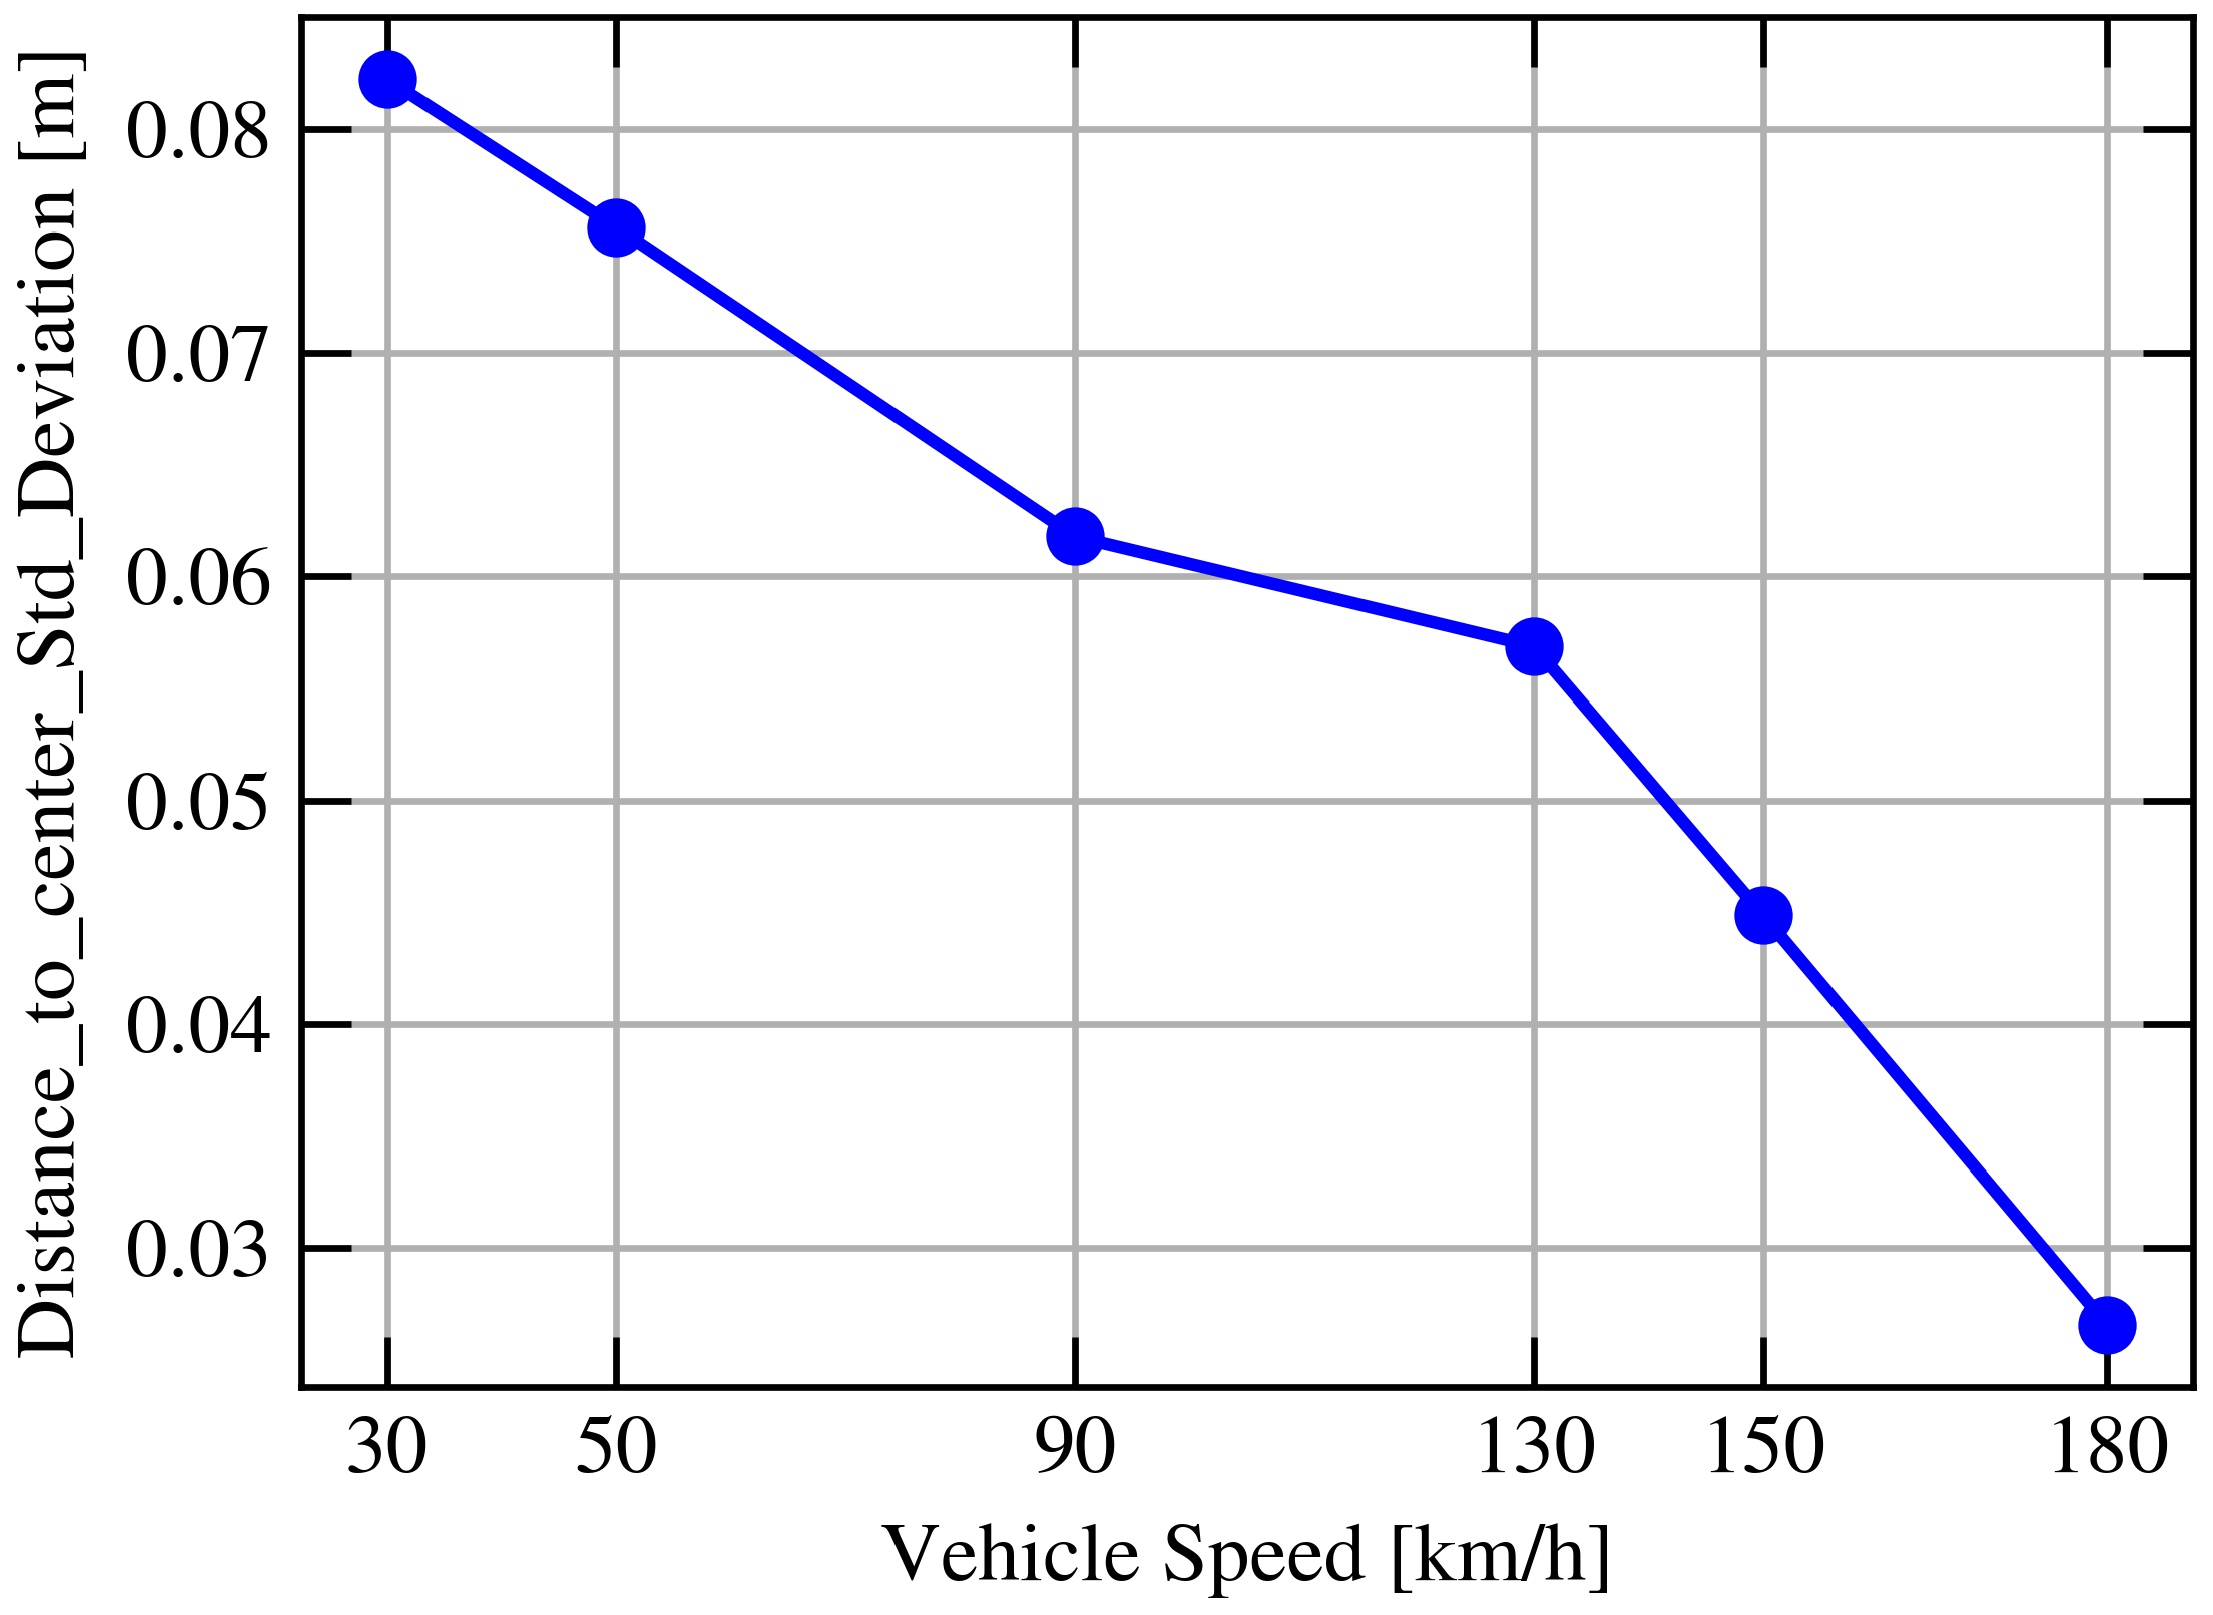
Figure 9,
Figure 10 and
Figure 11 show a trivial example of how KPIs behave in action. As speed increases, the frequency of lateral oscillations increases, while the standard deviation and offset decrease. This suggests better trajectory control and more accurate centering at higher speeds. By observing the behavior of the lateral oscillation frequency, standard deviation, and offset from the lane center with respect to changing speed, it is possible to guess not only that the ADAS system performs better at higher speeds, but also provides an indication of where to invest more development resources, namely, on system performance at low speeds.
These indications become more interesting when KPIs can be monitored as certain elements within and outside the system change, more realistically simulating a true scenario.
In fact, the usefulness of a simulation tool structured in this way lies in the ability to perform sensitivity analyses of the ADAS system performance by varying multiple conditions and parameters. For example, it is possible to test the system:
on different vehicle models;
by varying vehicle parameters such as camber, toe, and wheelbase;
by changing road conditions such as lateral road inclination;
or by altering the position and performance of the virtual camera used.
This approach allows for verifying the robustness of the system in different scenarios, thereby making timely corrections. In addition, identifying the most relevant KPIs for characterizing the expected performance of the system from the earliest stages makes it possible to identify the most meaningful and repeatable test scenarios in subsequent development phases, such as hardware in-the-loop tests or road validation tests.
4. Results
Many scenarios were simulated by changing the internal and external system parameters mentioned in the previous section. For the purpose of this paper, two specific cases will be shown that represent very common scenarios that can cause a significant reduction in system performance.
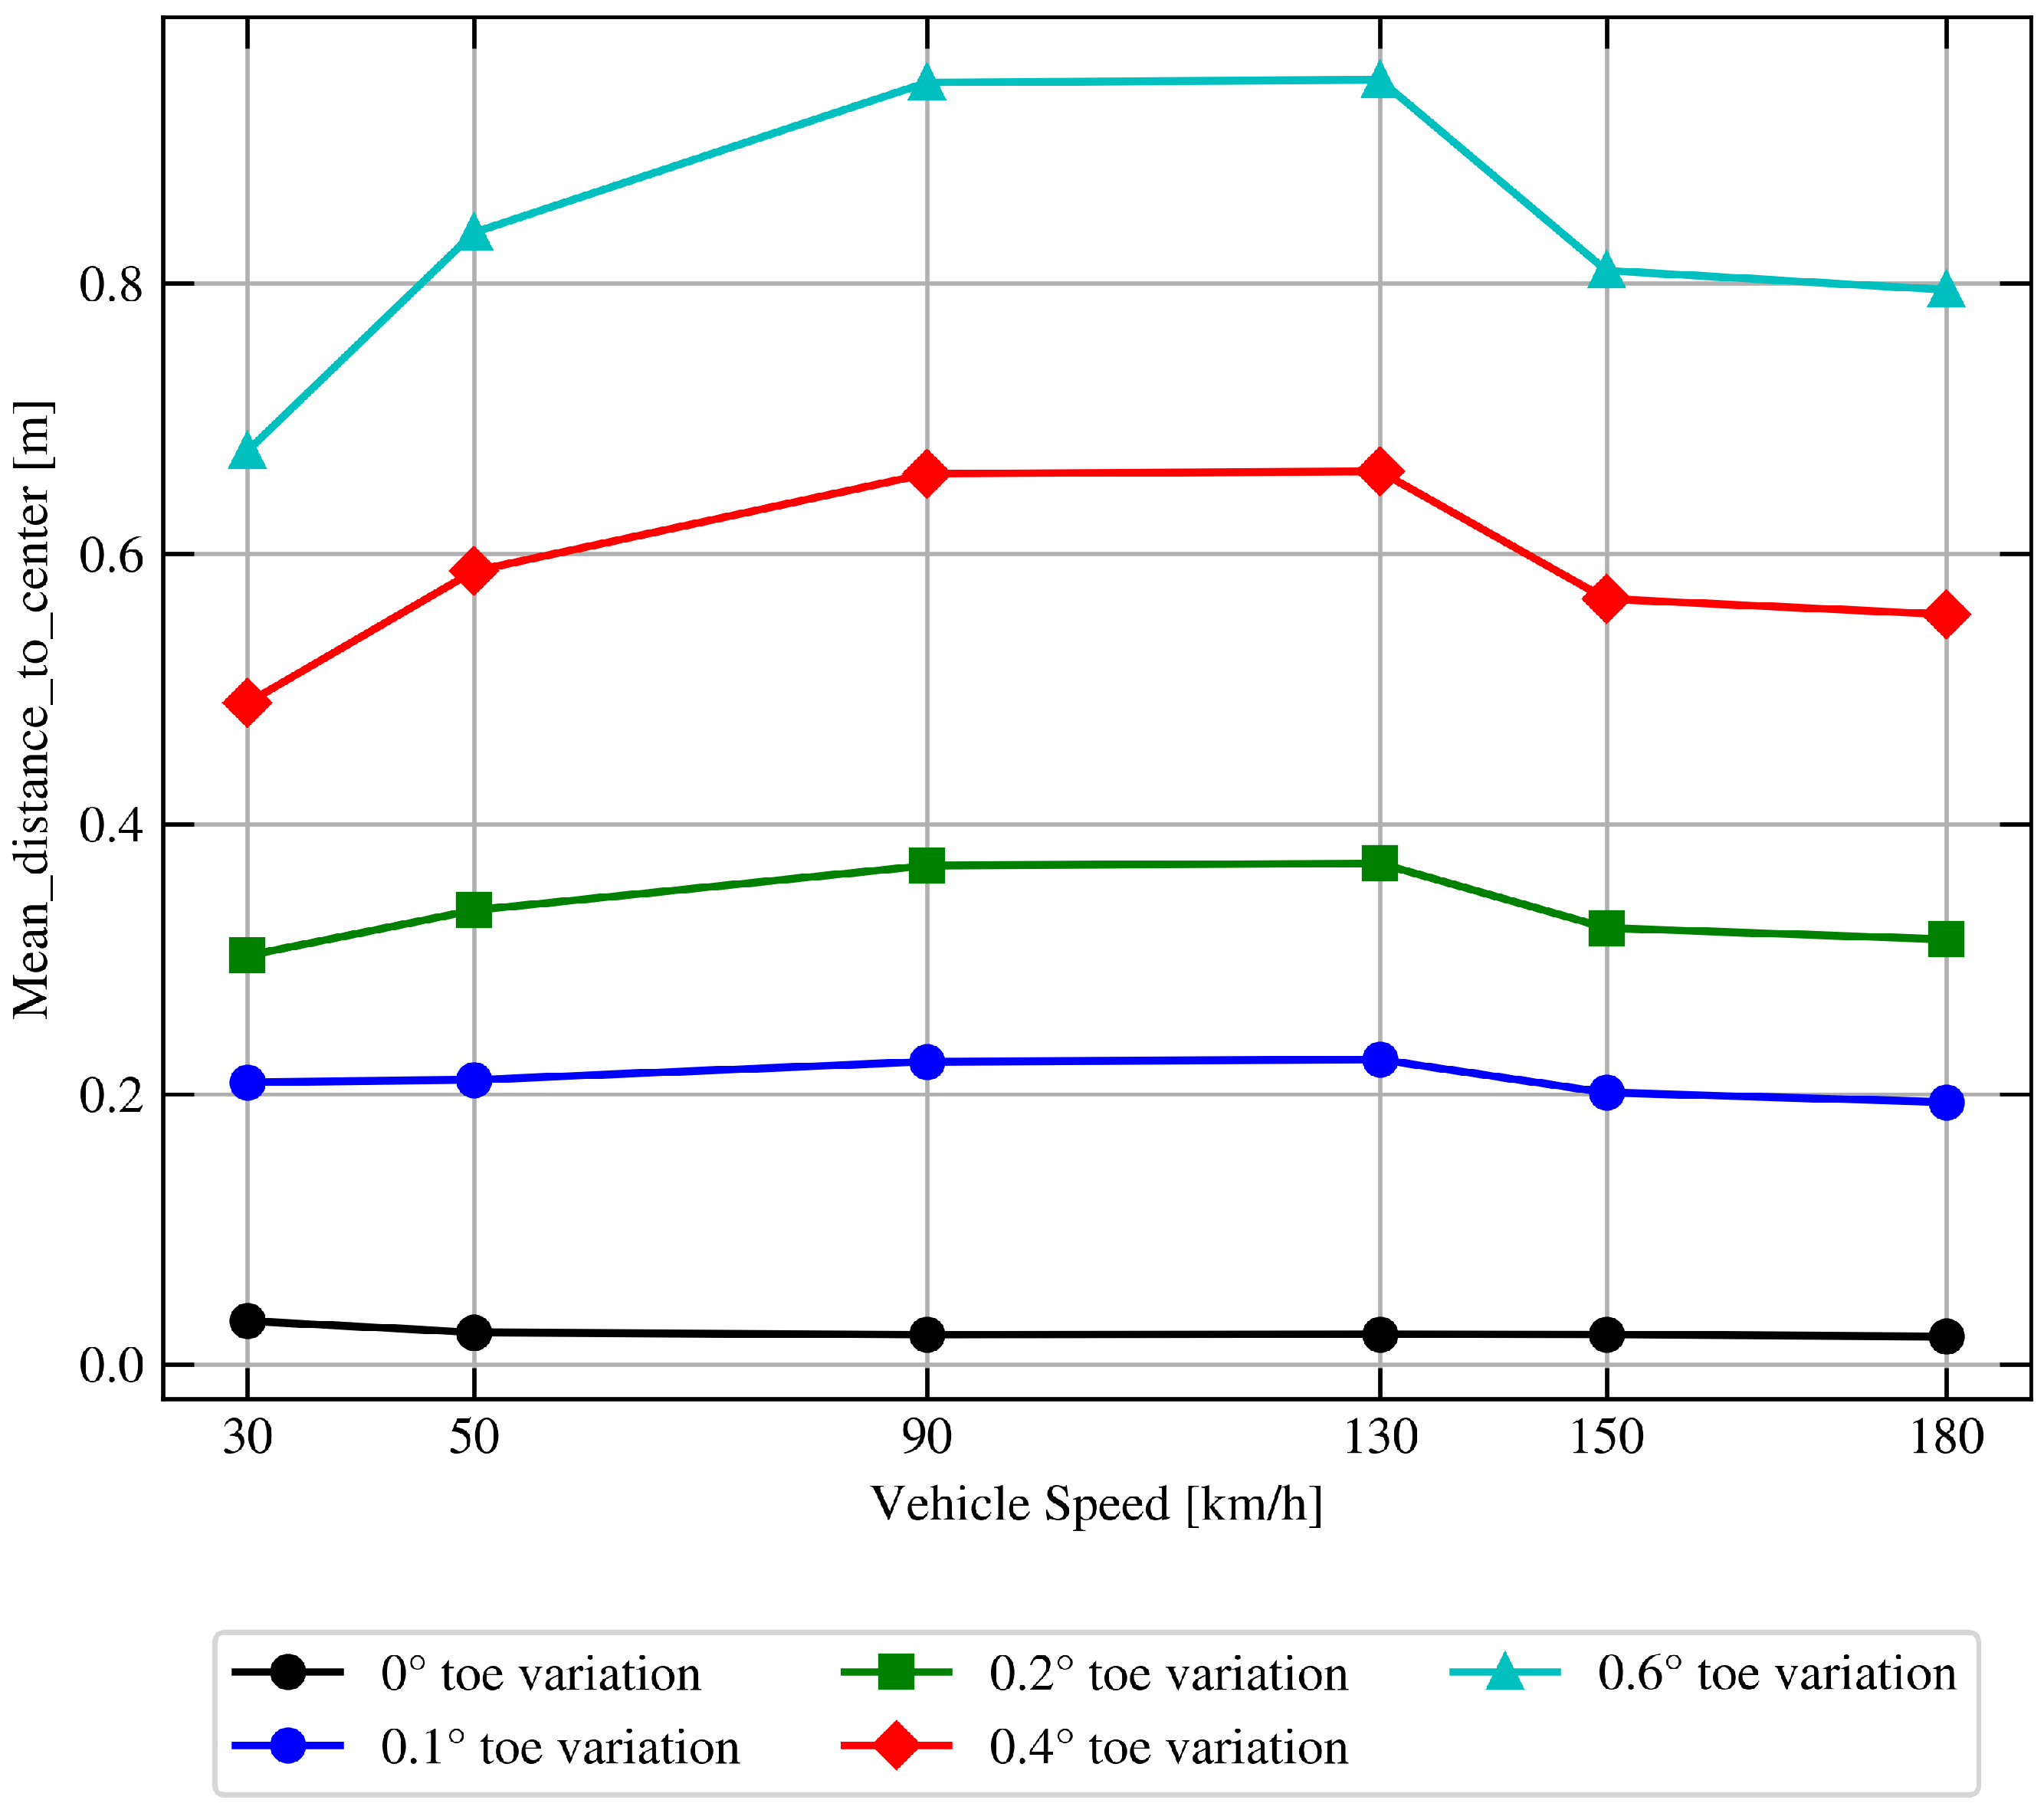
In these cases, for simplicity of comparison, the only change in the KPI offset at varying speed due to a change in the toe of the front axle and a change in the lateral inclination of the road is reported.
In the first case, a toe-in variation was simulated on one wheel of the front axle, thus reproducing a toe-in loss, an undesirable event often encountered in typical vehicle use. As shown in
Figure 12, it has already been observed that for typical values close to the maximum tolerance limits for proper car setup, which is about 0.1–0.2°, the considered ADAS system begins to have difficulty keeping the vehicle in the center of the lane, causing offsets of a magnitude perceptible to the driver.
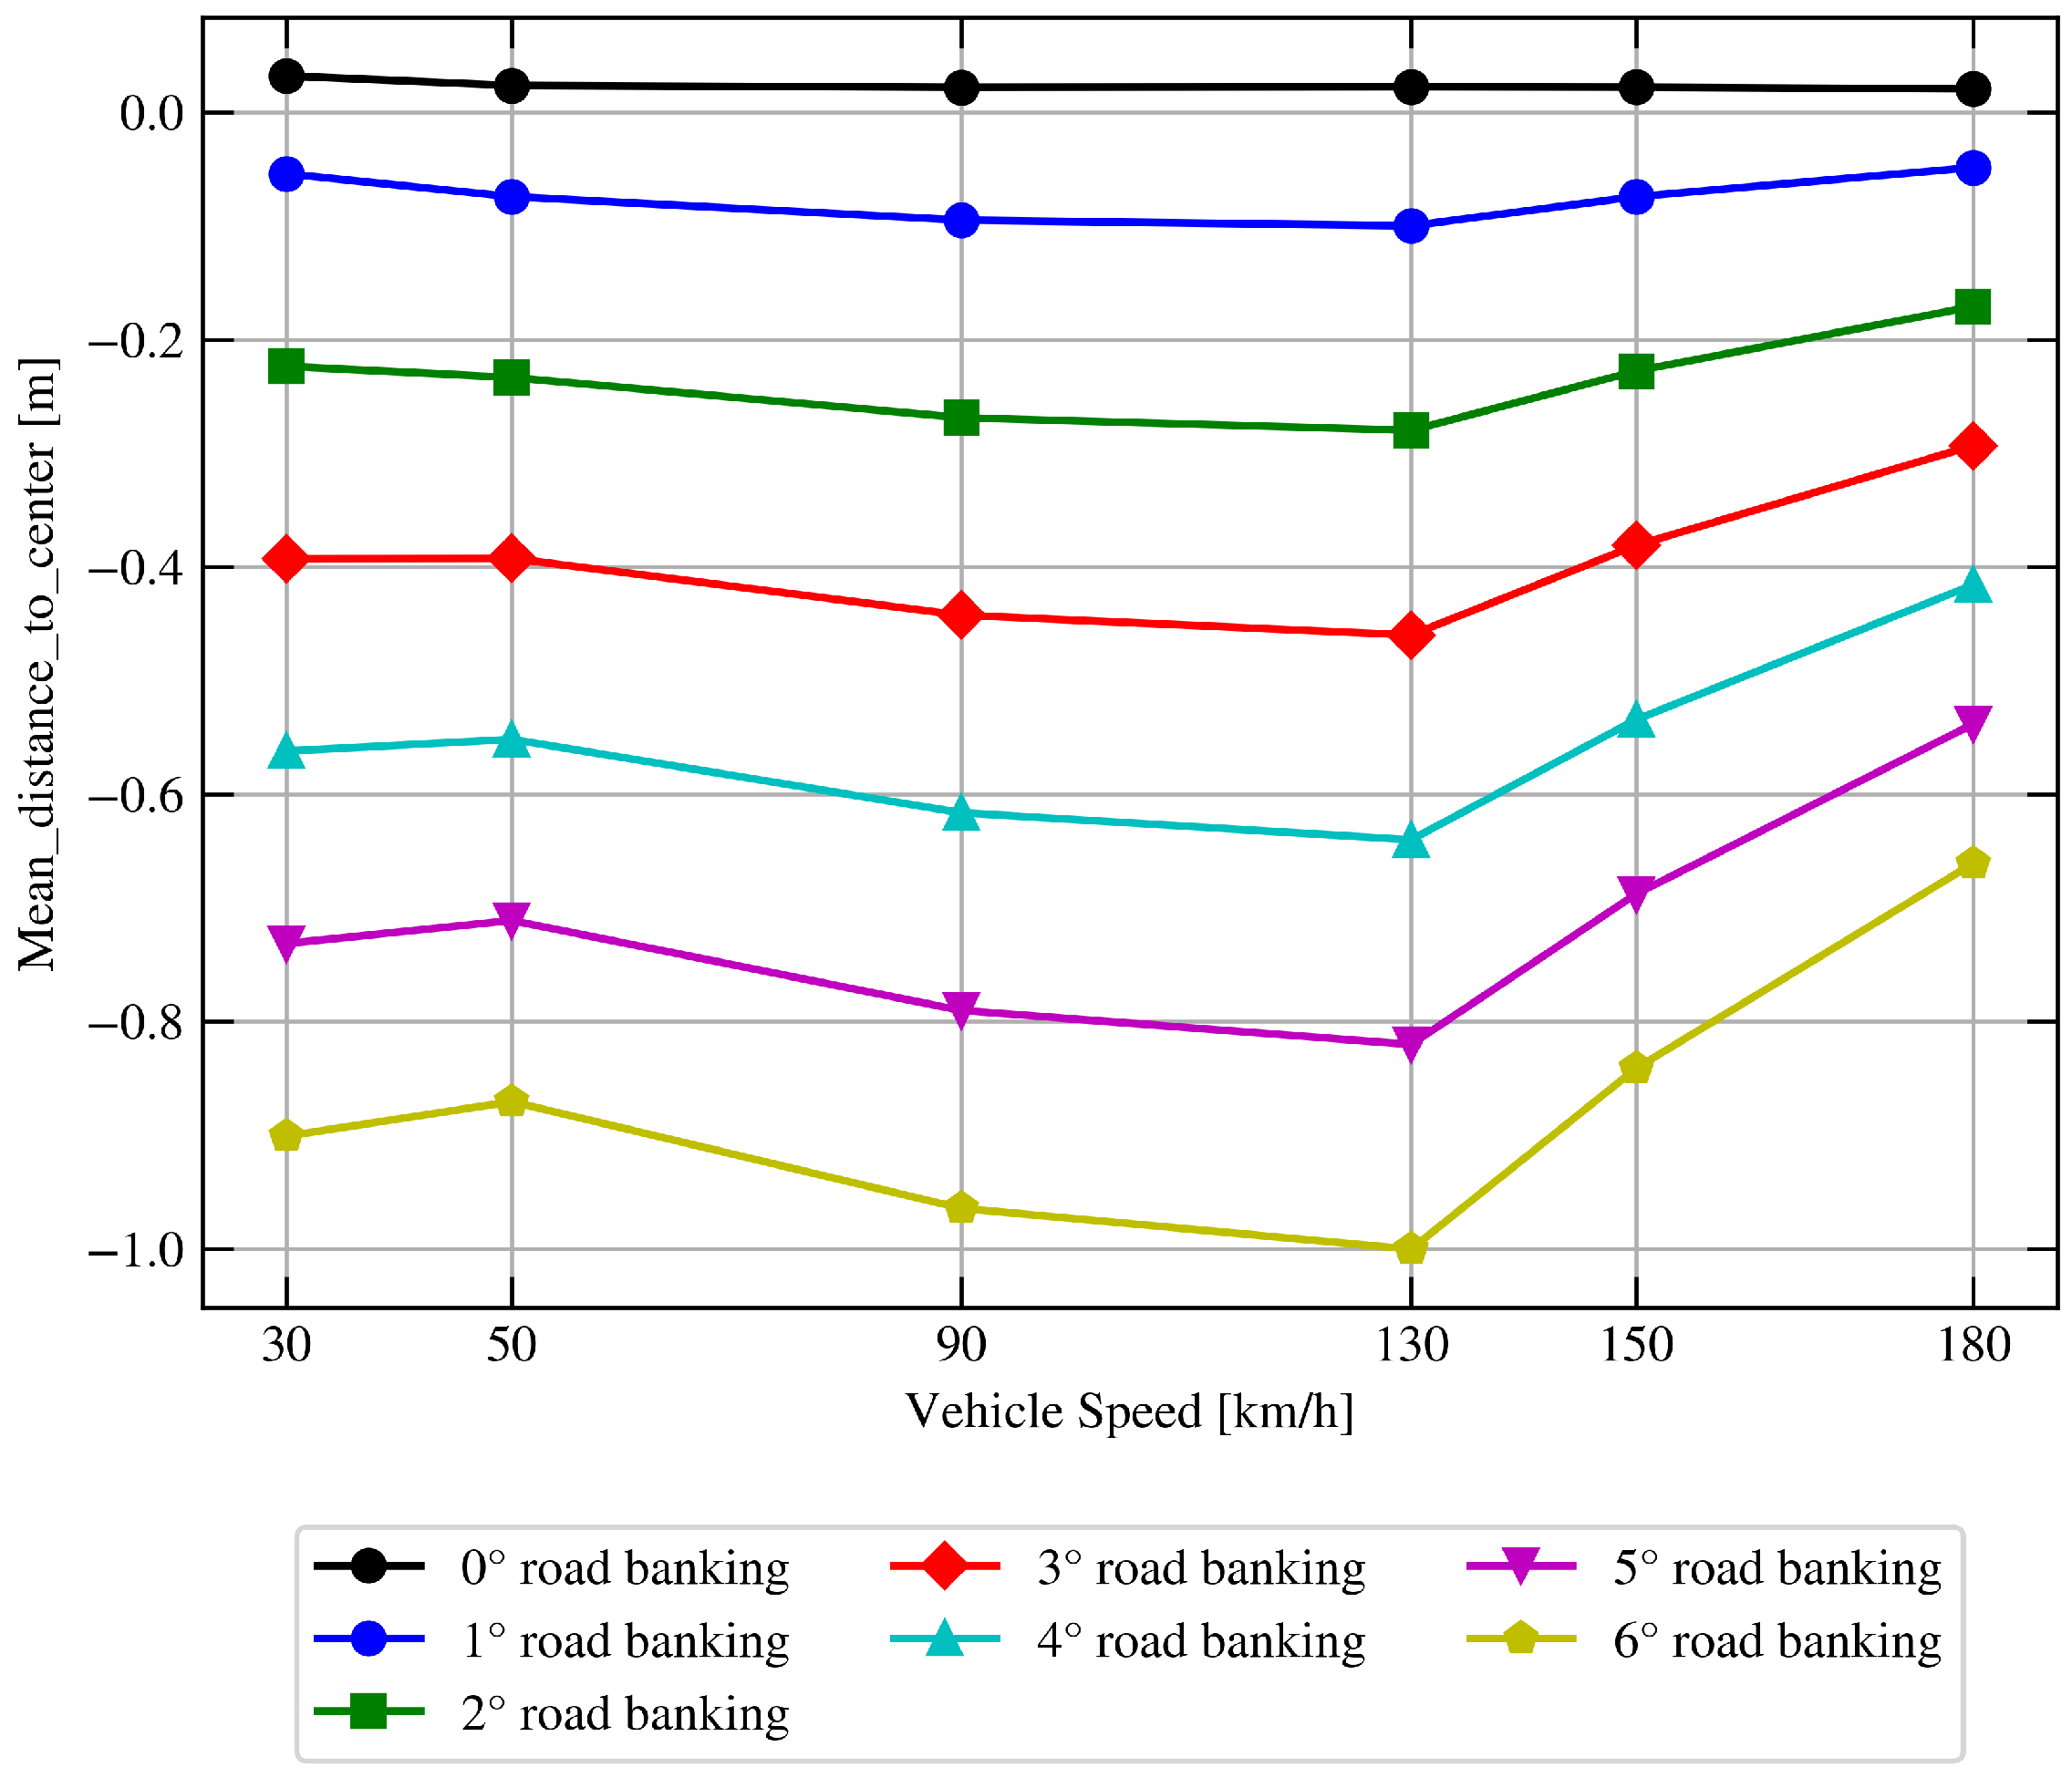
In contrast to the first case, where an internal variation in the system was considered, in the second case, a variation in the road condition was imposed and simulated, which represented an external variation in the system. In the simulation, therefore, the lateral inclination of the road was varied and, as shown in
Figure 13, it was observed that for a lateral road inclination of 3° representing a slope of 5%, a constant deviation from the center of the lane of more than 0.4 m was observed.
This example practically shows us that the use of a KPI-based methodology not only improves the development of the system by making it more robust but also allows for the identification of areas where it is appropriate to allocate more of the development budget. In fact, as we have just seen, to minimize variability in the expected final performance, it might be advantageous to invest more in a system where the risk of undesirable toe variations is greatly reduced or in a system capable of compensating for lateral road inclination.
Taking proactive measures in the early stages of development to ensure that the system meets performance expectations can offer several advantages.
reduced time and cost for final validation testing on track or road, and, consequently, a decrease in the associated risks
lower expenses associated with making modifications late in the development process
development time overall reduction
In any case, as we have already mentioned, this is not the end point of the work.
New possibilities and challenges are built on this foundation. In particular, considering objective criteria alone may not be the strategy to encourage the use of these systems. In fact, to increase their use, it is important that the driver, the end user of the tools, has a pleasant driving experience and gains confidence in the new features. Relying, however, on the subjective opinion of one or more users who, however experienced, represent a small sample of the population that will have to use them, could in a sense compromise the rigor of this development framework.
In this direction goes the idea of extending the KPI system presented here to the HiL environment as well. In fact, not only would the presence of KPIs defined and validated in other environments standardize the testing activity as much as possible, but by not including the risks associated with testing on the road, it would allow a wider group of users, particularly simple drivers, rather than experts, to express their opinions, thus making the testing criteria more popular and effective.
In addition, we do not expect only to extend the KPIs we have already presented in the virtual environment, but by exploiting the possibilities of HiL, we also expect to be able to expand this collection of KPIs to include some that reflect human perception when driving. Only by identifying KPIs that encapsulate subjective considerations can we aim to bridge the gap between objective and subjective that would lead to a complete and satisfactory view of the system’s potential and performance during the development stages.
5. Conclusions
This study presented a methodology for the testing and validation of ADAS L2/L3 systems based on the adoption of a KPI framework in a virtual environment, expandable to HiL and road testing, and showed some of the achievable benefits. The use of a KPI-based methodology improves system robustness, streamlines development, and reduces the risks and costs associated with late-stage changes. By proactively addressing performance variability in a timely manner, development becomes more efficient and cost-effective. However, to ensure wider adoption, subjective user experience must complement objective criteria. The extension of KPI assessments to HiL environments introduces standardized and inclusive user testing, integrating human perception into the framework. This approach bridges the gap between technical performance and user satisfaction, offering a well-rounded development strategy.


