
Risk Analysis on FGH Terminal Using Importance Index and Bowtie Analysis Methods †

 ,
,
Abstract
1. Introduction
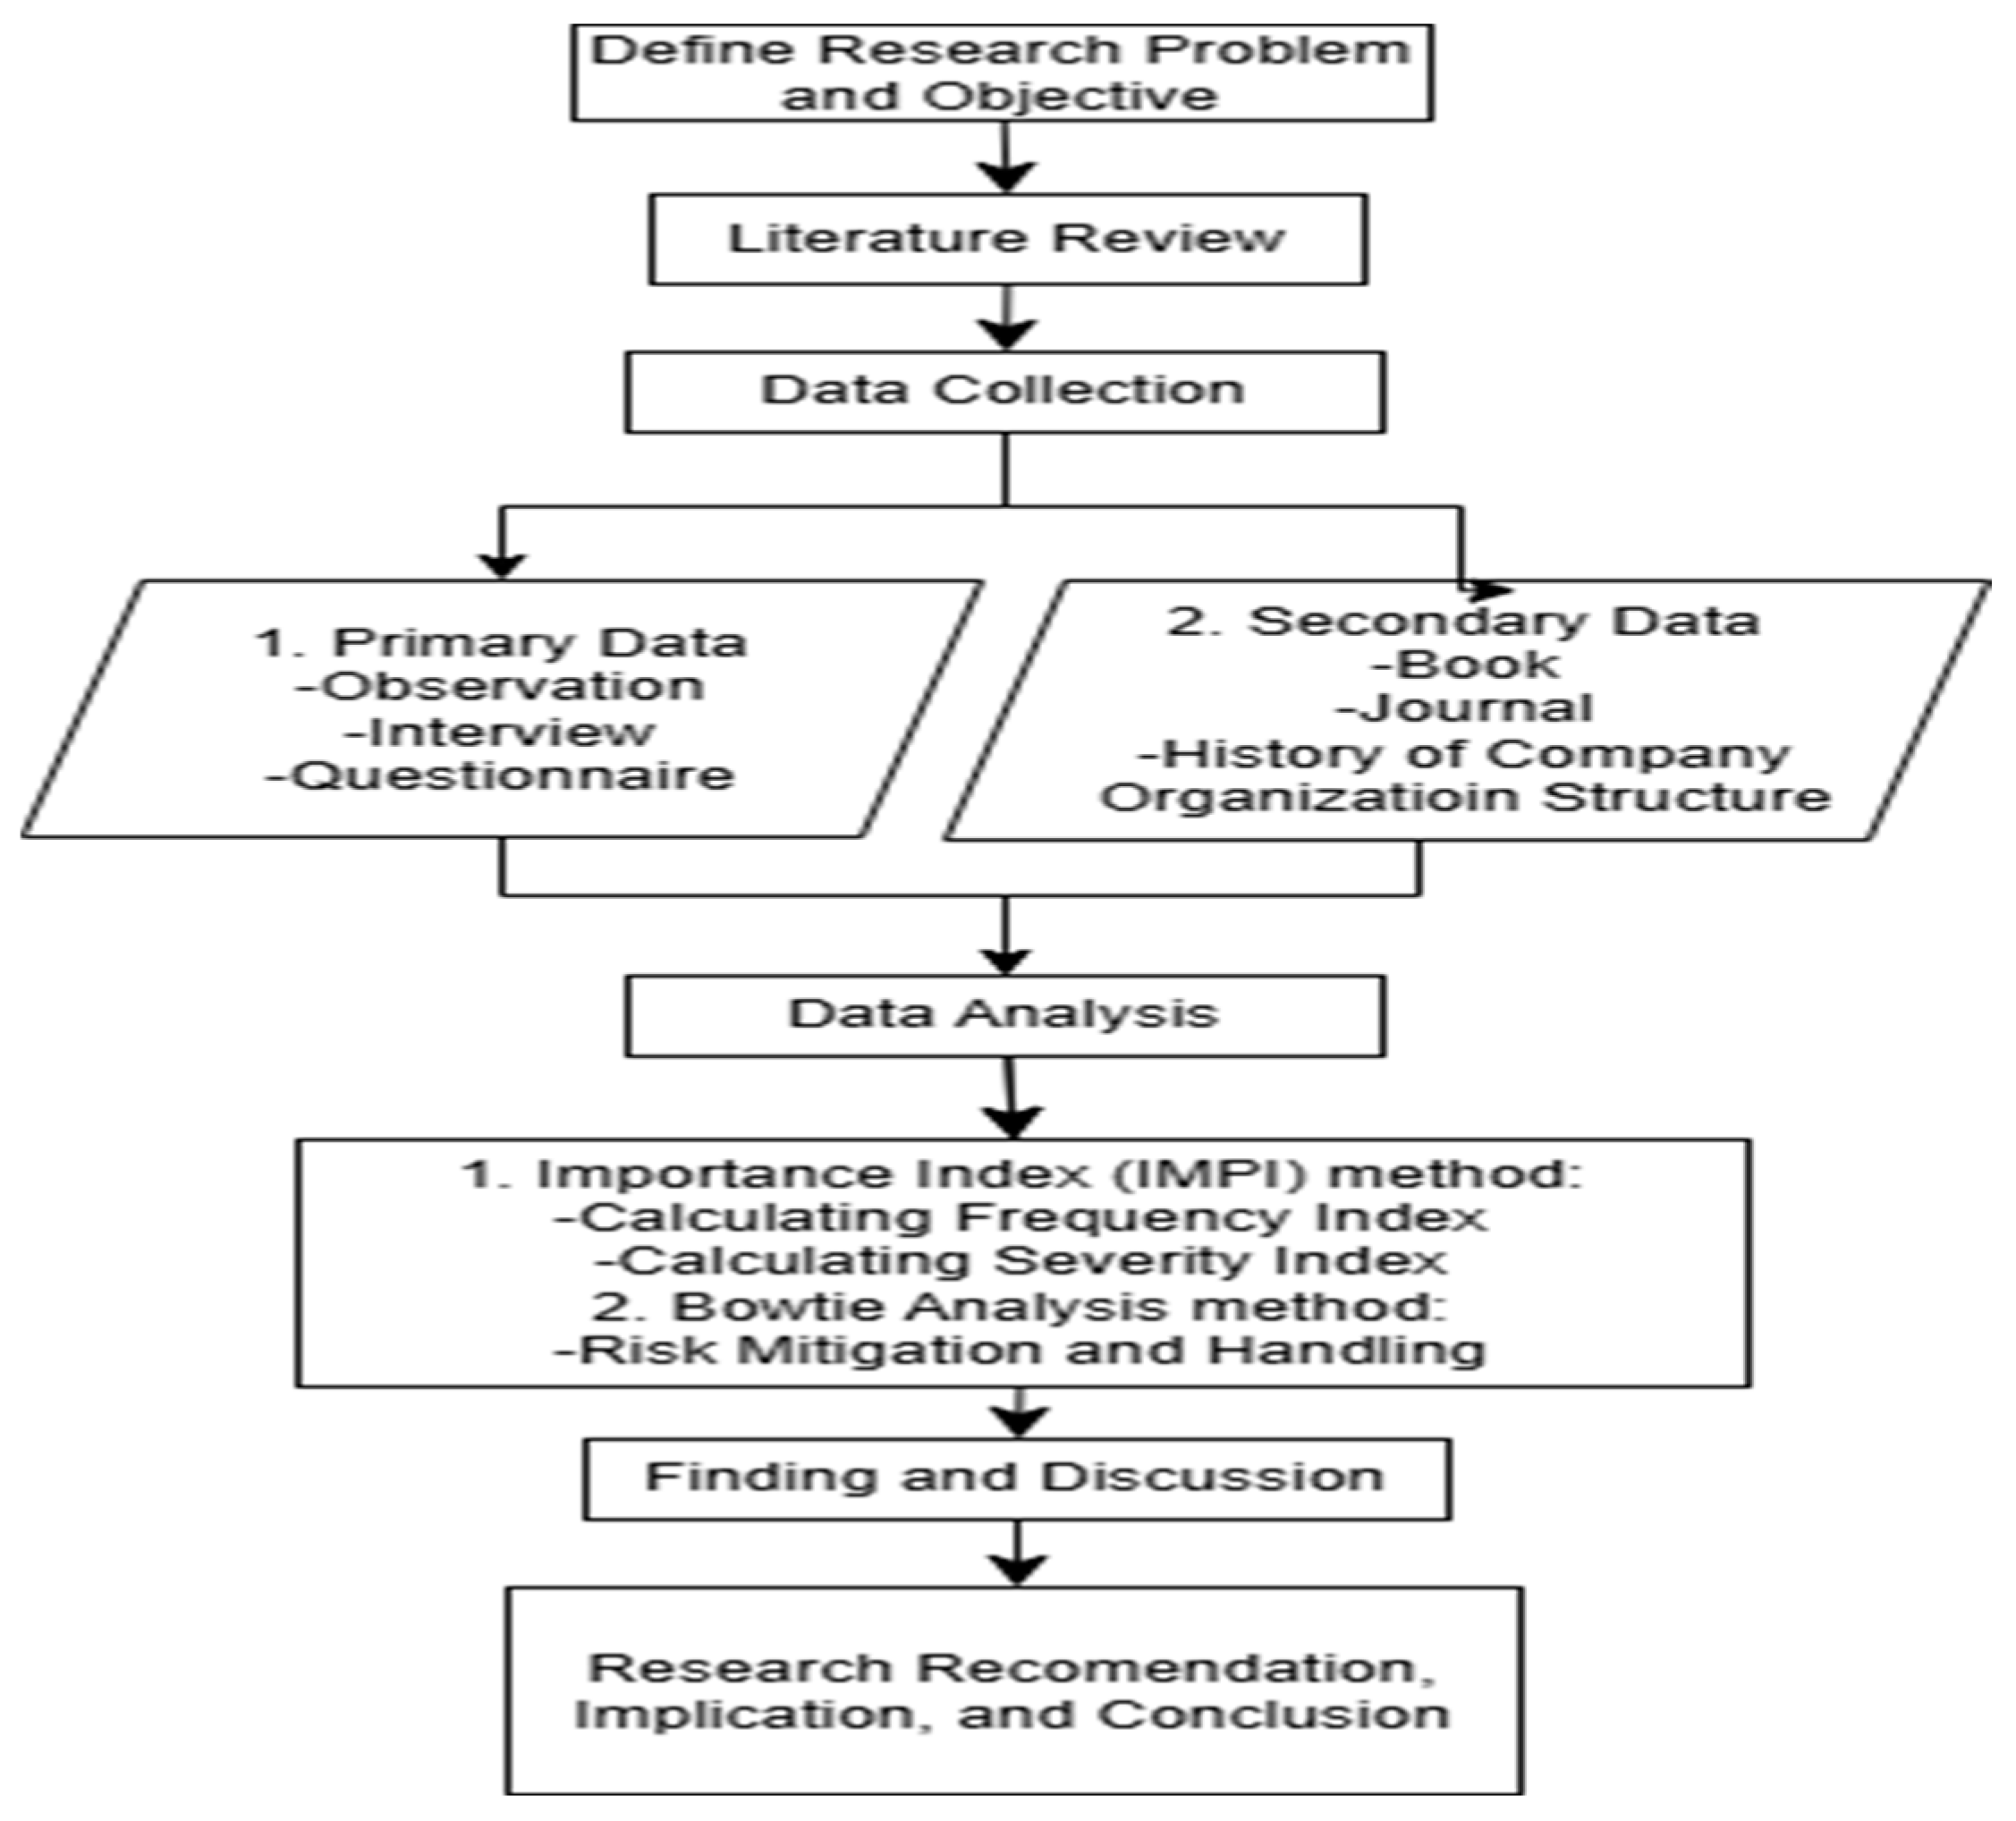
2. Method
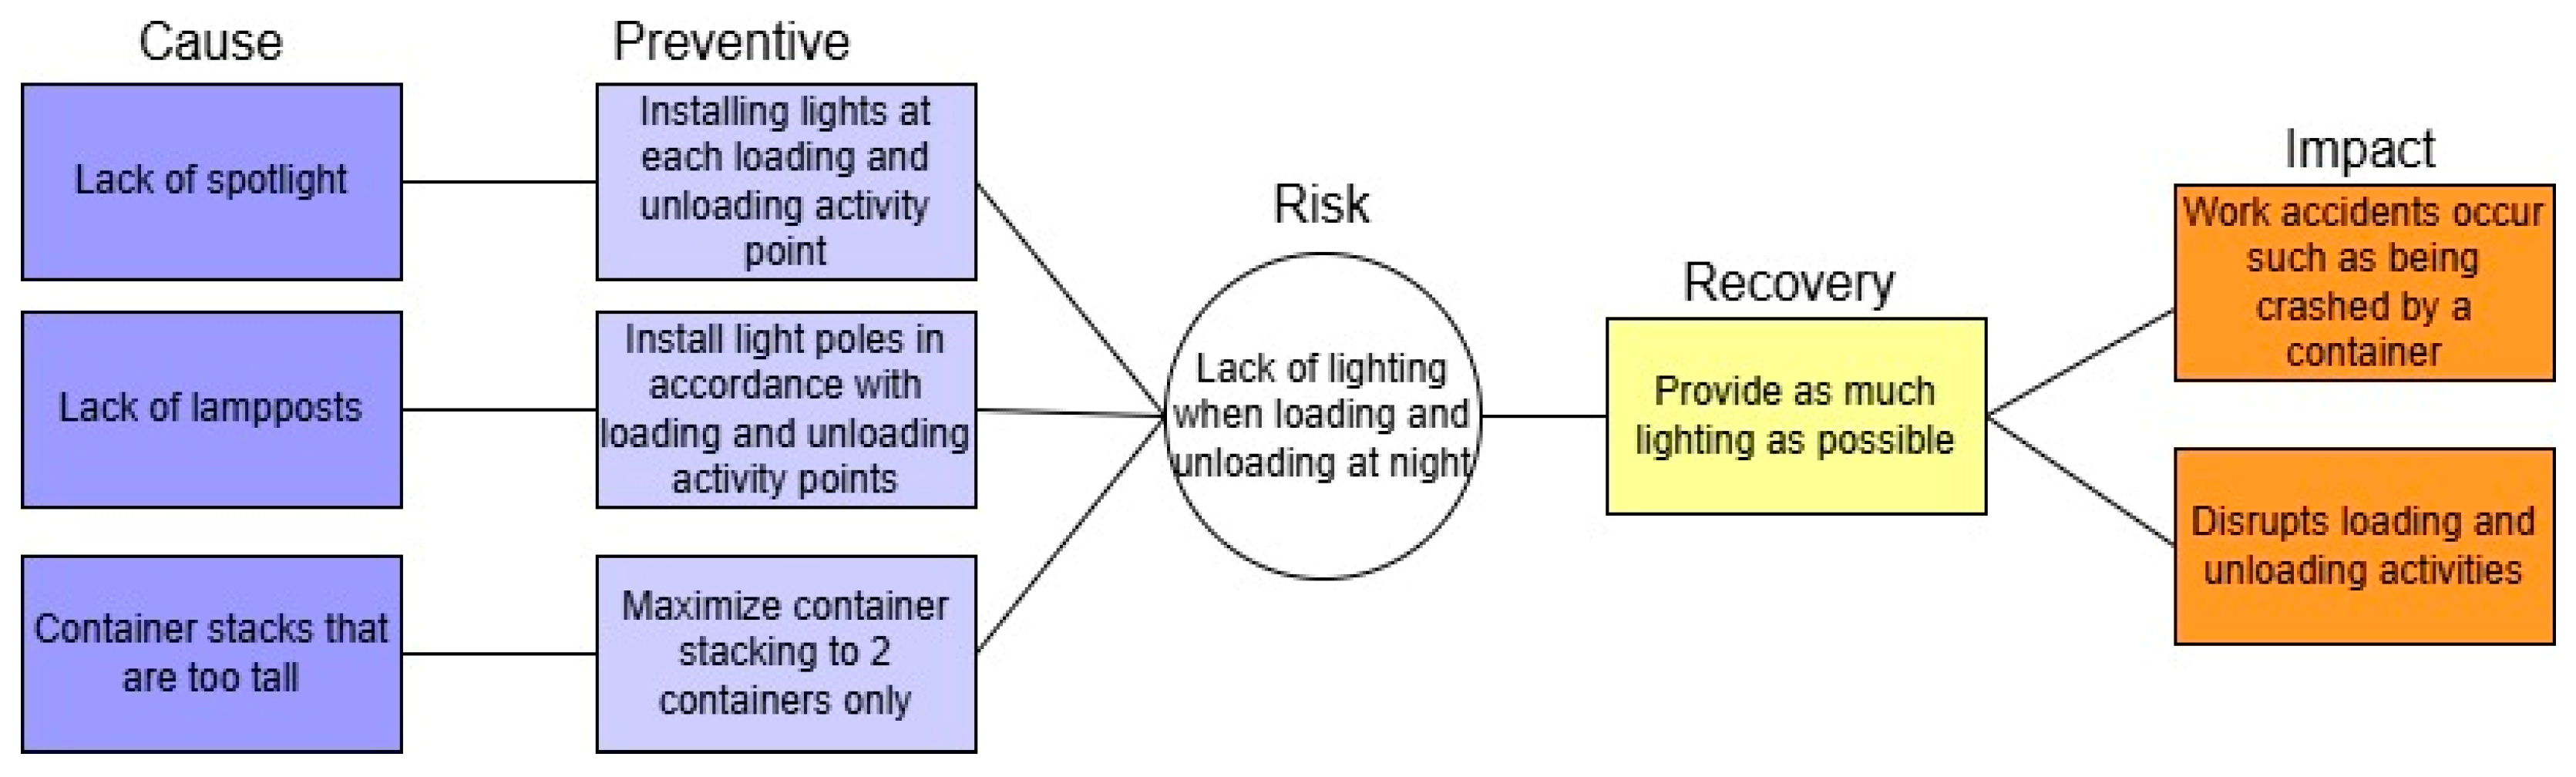
3. Findings and Discussion
- Calculation of Frequency Index code F1:
- Calculation of Severity Index code F1:
- Calculation of Importance Index code F1:
4. Conclusions
Author Contributions
Funding
Institutional Review Board Statement
Informed Consent Statement
Data Availability Statement
Acknowledgments
Conflicts of Interest
References
- Utamajaya, J.N.; Afrina, A.; Fitriah, N. Analisis manajemen risiko teknologi informasi pada perusahaan toko ujung pandang grosir penajam paser utara menggunakan framework iso 31000:2018. J. Sebatik 2021, 25, 326–334. [Google Scholar] [CrossRef]
- Sahraen, A.N.; Andri, A.J.; Sundari, S. Analisis risiko pada supply chain management menggunakan framework iso 31000: 2009 (studi kasus: PT. XYZ). J. Ilm. Tek. Ind. 2020, 4, 106–113. [Google Scholar] [CrossRef]
- MRachmadhani, M.; Immawan, T.; Mansur, A.; Choi, W. Risk management framework design based on iso 31000 and scor model. Spektrum Ind. 2023, 21, 41–51. [Google Scholar] [CrossRef]
- Kanantyo, P.; Papilaya, F.S. Analisis risiko teknologi informasi menggunakan iso 31000 (learning management system smpn 6 salatiga). J. Tek. Inform. Sist. Inf. 2021, 8, 1896–1908. [Google Scholar] [CrossRef]
- Ramisdar, I.O. Analisis Risiko Kecelakaan Kerja pada Proses Bongkar Muat Dengan Metode Job Safety Analysis (JSA) dan Hazard and Operability Study (HAZOPs) di PT. Pelindo IV (Persero) Terminal Petikemas Makassar. 2019. Available online: http://repositori.uin-alauddin.ac.id/id/eprint/16370 (accessed on 21 March 2024).
- Hotmauly, H. Gambaran Pelaksanaan Manajemen Risiko Keselamatan Terminal Peti Kemas Koja (TPK Koja), Tanjung Priuk, Jakarta Periode Juni 2012. Depok. 2012. Available online: https://lib.ui.ac.id/detail?id=20319795&lokasi=lokal (accessed on 21 March 2024).
- Permata, E.G.; Hamdy, M.I.; Ardi, M.F. Analisis risiko keselamatan dan kesehatan kerja menggunakan metode bow tie di pt. x. Identifikasi J. Keselam. Kesehat. Kerja Lindungan Lingkung. 2021, 7, 455–464. [Google Scholar] [CrossRef]
- Astuti, F.W.D. Analisis Risiko Kecelakaan Kerja Menggunakan Metode Bowtie pada Proyek One Galaxy Surabaya. 2017. Available online: http://repository.its.ac.id/id/eprint/44441 (accessed on 21 March 2024).
- Tobing, Y.O.L.; Sari, D.P.; Wicaksono, P.A. Analisis risiko proyek konstruksi dengan importance index dan bow tie analysis. Ind. Eng. Online J. 2018, 7, 1–8. [Google Scholar]
- Hermawansyah, A.; Tristiyanto, T.; Prabowo, R. Aplikasi multi bank sampah berbasis web. J. Pepadun 2022, 4, 64–73. [Google Scholar] [CrossRef]
- Buganová, K.; Šimíčková, J. Risk management in traditional and agile project management. Transp. Res. Procedia 2019, 40, 986–993. [Google Scholar] [CrossRef]
- Ariyanto, N.T. Analisis Mitigasi Risiko pada Rantai Pasok Perusahaan Kayu Lapis Dengn Metode House of Risk (HOR). 2018. Available online: https://dspace.uii.ac.id/handle/123456789/12392 (accessed on 21 March 2024).
- Afifah, L.; Adji, S.; Farida, U. Analisis dan perbaikan manajemen risiko pada rantai pasok produk tepung tapioka PT. Budi Starch & Sweetener. TBK Ponorogo dengan menggunakan metode house of risk (HOR). J. Ekon. Manaj. Akunt. 2021, 5, 92–107. [Google Scholar] [CrossRef]
- Putra, M.R. Analisis Keselamatan dan Kesehatan Kerja Menggunakan Metode Importance Index dan Bowtie pada Proyek Pembangunan Al-Fatih Islamic Center. 2021. Available online: https://repository.uin-suska.ac.id/57708/ (accessed on 21 March 2024).
- Shah, Z.P.; Sharma, N.D.; Rathod, H.A. Risk assessment for ppp based road infrastructure projects. Int. J. Res. Appl. Sci. Eng. Technol. 2018, 6, 774–779. [Google Scholar] [CrossRef]
- Alijoyo, A.; Wijaya, B.; Jacob, I. Bow Tie Analysis; CRMS: Carbondale, CO, USA, 2021; Available online: https://webdev.lspmks.co.id/wp-content/uploads/2021/08/Bow-Tie-Analysis.pdf (accessed on 21 March 2024).
- Fajrisa, D.; Hariyono, W.; Sulistyawati, S. Workplace accident risk analysis using the bowtie method in the construction industry: A literature review. J. EduHealth 2024, 15, 546–556. [Google Scholar]
- Alizadeh, S.; Moshashaei, P. The bowtie method in safety management system: A literature review. Sci. J. Rev. 2015, 4, 133–138. [Google Scholar]
- Sumarsono, N.P.R.; Saptadi, S. Metode failure mode and effect analysis (fmea) dan bow tie analysis untuk mengetahui risiko pada program pesawat n219 (Studi kasus pt. dirgantara indonesia). Ind. Eng. Online J. 2019, 8, 1–7. [Google Scholar]


| Scale | Category | Criteria |
|---|---|---|
| 1 | Extremely rare | Occurs <2 times |
| 2 | Rare | Occurs 2–3 times |
| 3 | Sometime | Occurs 3–4 times |
| 4 | Often | Occurs 4–5 times |
| 5 | Frequent | Occurs >5 times |
| Scale | Description | Mean |
|---|---|---|
| 1 | Insignificant | No injury, little financial loss |
| 2 | Minor | Minor injury, little financial loss, disruptive to health |
| 3 | Moderate | Moderate injury, medical treatment required moderate financial loss |
| 4 | Major | Severe injury, major loss, production interruption |
| 5 | Catastrophic | Fatal, huge losses and far-reaching impacts, cessation of all activities |
| No. | Category | Criteria |
|---|---|---|
| 1 | Low | 0–20 |
| 2 | Moderate | 21–40 |
| 3 | Significant | 41–60 |
| 4 | High | 61–100 |
| Variable | Code | Indicator |
|---|---|---|
| Machine/Equipment | F1 | Container damage during unloading, stacking, or transfer to truck |
| F2 | Container contents fall or spill during the transfer process | |
| F3 | Refer container damaged by electrical short circuit | |
| F4 | Loading and unloading equipment damaged (broken, scratched, bent, etc.) | |
| F5 | Uncontrolled loading and unloading equipment when lifting containers | |
| F6 | RTG sling broke | |
| F7 | Sling CC (container crain) broke | |
| F8 | Truck crashes guardrail | |
| F9 | Truck crashes container | |
| F10 | Truck crashes into electricity pole | |
| F11 | Truck crashes into the entrance/exit gate | |
| F12 | Truck/other equipment fell into the sea | |
| F13 | Truck/other equipment overturned while loading and unloading | |
| F14 | Reach stacker crashes the container | |
| F15 | Reach stacker crashes into an electricity pole | |
| F16 | Reach stacker crashes into a guardrail | |
| F17 | Forklift crashes into road divider | |
| F18 | Forklift crashes container | |
| F19 | Forklift crashes electricity pole | |
| F20 | Fire due to an electrical short circuit | |
| F21 | Inadequate RTG that slows down loading and unloading activities | |
| F22 | Inadequate CC that slows down loading and unloading activities | |
| F23 | Inadequate head trucks that slow down loading and unloading activities | |
| F24 | Inadequate reach stacker that slows down loading and unloading activities | |
| F25 | Inadequate forklifts that slow down loading and unloading activities | |
| F26 | Machine capacity that does not match the workload | |
| F27 | Inadequate machine maintenance, thus the tools used experience a decrease in performance | |
| F28 | Inadequate fuel for loading and unloading machinery/equipment | |
| F29 | Lack of lighting when loading and unloading at night | |
| Human | G1 | Worker falls from the CC (container crain) |
| G2 | Worker falls from t the top of container | |
| G3 | Worker crushed by a container | |
| G4 | Worker crushed by equipment | |
| G5 | Worker hit by a forklift | |
| G6 | Worker crushed by the truck | |
| G7 | Worker crushed by reach stacker | |
| G8 | Worker crushed by RTG | |
| G9 | Worker crushed by CC | |
| G10 | Worker electrocuted due to short circuit | |
| G11 | Worker behavior is not following existing SOPs | |
| G12 | Worker hit by equipment falling from a top | |
| G13 | lack of manpower | |
| Environment | H1 | Docks that are dirty or cause environmental pollution from container contents |
| H2 | A dusty loading and unloading yard | |
| H3 | Potholed and muddy loading and unloading yards |
| Code | FI | SI | ||||
|---|---|---|---|---|---|---|
| X1 | X2 | X3 | X1 | X2 | X3 | |
| F1 | 3 | 4 | 3 | 4 | 3 | 3 |
| F2 | 1 | 1 | 1 | 3 | 1 | 3 |
| F3 | 1 | 1 | 1 | 3 | 2 | 2 |
| F4 | 3 | 3 | 4 | 4 | 3 | 3 |
| F5 | 2 | 1 | 1 | 2 | 2 | 1 |
| F6 | 1 | 1 | 1 | 2 | 3 | 2 |
| F7 | 1 | 1 | 1 | 3 | 2 | 3 |
| F8 | 3 | 2 | 3 | 2 | 2 | 2 |
| F9 | 3 | 2 | 3 | 3 | 2 | 2 |
| F10 | 3 | 2 | 3 | 3 | 3 | 3 |
| F11 | 3 | 3 | 3 | 3 | 3 | 2 |
| F12 | 1 | 1 | 1 | 3 | 3 | 2 |
| F13 | 1 | 1 | 1 | 3 | 3 | 2 |
| F14 | 1 | 1 | 1 | 2 | 3 | 3 |
| F15 | 3 | 3 | 2 | 2 | 3 | 2 |
| F16 | 2 | 3 | 2 | 3 | 4 | 2 |
| F17 | 2 | 3 | 2 | 2 | 2 | 2 |
| F18 | 1 | 1 | 1 | 2 | 2 | 2 |
| F19 | 1 | 1 | 1 | 2 | 3 | 1 |
| F20 | 2 | 3 | 3 | 3 | 2 | 3 |
| F21 | 3 | 2 | 2 | 4 | 3 | 4 |
| F22 | 1 | 1 | 1 | 2 | 2 | 2 |
| F23 | 2 | 1 | 2 | 2 | 2 | 3 |
| F24 | 1 | 1 | 1 | 2 | 2 | 2 |
| F25 | 1 | 1 | 1 | 3 | 3 | 3 |
| F26 | 1 | 1 | 2 | 2 | 3 | 2 |
| F27 | 1 | 2 | 2 | 2 | 3 | 3 |
| F28 | 1 | 1 | 2 | 3 | 3 | 3 |
| F29 | 1 | 1 | 2 | 4 | 3 | 2 |
| G1 | 3 | 3 | 3 | 4 | 3 | 4 |
| G2 | 1 | 1 | 1 | 3 | 4 | 3 |
| G3 | 1 | 1 | 1 | 4 | 3 | 4 |
| G4 | 1 | 1 | 1 | 4 | 4 | 4 |
| G5 | 2 | 1 | 1 | 4 | 4 | 4 |
| G6 | 1 | 1 | 1 | 3 | 3 | 3 |
| G7 | 1 | 1 | 1 | 3 | 3 | 4 |
| G8 | 1 | 1 | 1 | 4 | 3 | 4 |
| G9 | 1 | 1 | 1 | 3 | 3 | 4 |
| G10 | 1 | 1 | 1 | 3 | 3 | 4 |
| G11 | 1 | 1 | 1 | 4 | 3 | 4 |
| G12 | 4 | 3 | 4 | 2 | 3 | 2 |
| G13 | 1 | 1 | 1 | 3 | 3 | 3 |
| H1 | 2 | 2 | 3 | 3 | 2 | 2 |
| H2 | 2 | 2 | 2 | 1 | 2 | 2 |
| H3 | 3 | 4 | 4 | 3 | 3 | 3 |
| Code | FI (%) | SI (%) | IMPI | Description |
|---|---|---|---|---|
| F1 | 66.67 | 66.67 | 44.44 | Significant |
| F2 | 20.00 | 46.67 | 9.33 | Low |
| F3 | 20.00 | 46.67 | 9.33 | Low |
| F4 | 66.67 | 66.67 | 44.44 | Significant |
| F5 | 26.67 | 33.33 | 8.89 | Low |
| F6 | 20.00 | 46.67 | 9.33 | Low |
| F7 | 20.00 | 53.33 | 10.67 | Low |
| F8 | 53.33 | 40.00 | 21.33 | Moderate |
| F9 | 53.33 | 46.67 | 24.89 | Moderate |
| F10 | 53.33 | 60.00 | 32.00 | Moderate |
| F11 | 60.00 | 53.33 | 32.00 | Moderate |
| F12 | 20.00 | 53.33 | 10.67 | Low |
| F13 | 20.00 | 53.33 | 10.67 | Low |
| F14 | 53.33 | 46.67 | 24.89 | Moderate |
| F15 | 46.67 | 60.00 | 28.00 | Moderate |
| F16 | 46.67 | 40.00 | 18.67 | Low |
| F17 | 20.00 | 40.00 | 8.00 | Low |
| F18 | 20.00 | 40.00 | 8.00 | Low |
| F19 | 53.33 | 53.33 | 28.44 | Moderate |
| F20 | 46.67 | 73.33 | 34.22 | Moderate |
| F21 | 20.00 | 40.00 | 8.00 | Low |
| F22 | 33.33 | 46.67 | 15.56 | Low |
| F23 | 20.00 | 40.00 | 8.00 | Low |
| F24 | 20.00 | 60.00 | 12.00 | Low |
| F25 | 26.67 | 46.67 | 12.44 | Low |
| F26 | 33.33 | 53.33 | 17.78 | Low |
| F27 | 26.67 | 60.00 | 16.00 | Low |
| F28 | 26.67 | 60.00 | 16.00 | Low |
| F29 | 60.00 | 73.33 | 44.00 | Significant |
| G1 | 20.00 | 66.67 | 13.33 | Low |
| G2 | 20.00 | 73.33 | 14.67 | Low |
| G3 | 20.00 | 80.00 | 16.00 | Low |
| G4 | 26.67 | 80.00 | 21.33 | Moderate |
| G5 | 20.00 | 60.00 | 12.00 | Low |
| G6 | 20.00 | 66.67 | 13.33 | Low |
| G7 | 20.00 | 73.33 | 14.67 | Low |
| G8 | 20.00 | 66.67 | 13.33 | Low |
| G9 | 20.00 | 66.67 | 13.33 | Low |
| G10 | 20.00 | 73.33 | 14.67 | Low |
| G11 | 73.33 | 46.67 | 34.22 | Moderate |
| G12 | 20.00 | 60.00 | 12.00 | Low |
| G13 | 46.67 | 46.67 | 21.78 | Moderate |
| H1 | 40.00 | 33.33 | 13.33 | Low |
| H2 | 73.33 | 60.00 | 44.00 | Significant |
| H3 | 73.33 | 53.33 | 39.11 | Moderate |
Disclaimer/Publisher’s Note: The statements, opinions and data contained in all publications are solely those of the individual author(s) and contributor(s) and not of MDPI and/or the editor(s). MDPI and/or the editor(s) disclaim responsibility for any injury to people or property resulting from any ideas, methods, instructions or products referred to in the content. |
© 2025 by the authors. Licensee MDPI, Basel, Switzerland. This article is an open access article distributed under the terms and conditions of the Creative Commons Attribution (CC BY) license (https://creativecommons.org/licenses/by/4.0/).
Share and Cite
Rachmadhani, M.M.; Gani, M.; Histiarini, A.R.; Tuankotta, O.F.A. Risk Analysis on FGH Terminal Using Importance Index and Bowtie Analysis Methods. Eng. Proc. 2025, 84, 35. https://doi.org/10.3390/engproc2025084035
Rachmadhani MM, Gani M, Histiarini AR, Tuankotta OFA. Risk Analysis on FGH Terminal Using Importance Index and Bowtie Analysis Methods. Engineering Proceedings. 2025; 84(1):35. https://doi.org/10.3390/engproc2025084035
Chicago/Turabian StyleRachmadhani, Mirga Maulana, Mardhiah Gani, Aprisa Rian Histiarini, and Oki Febiyani Amalia Tuankotta. 2025. "Risk Analysis on FGH Terminal Using Importance Index and Bowtie Analysis Methods" Engineering Proceedings 84, no. 1: 35. https://doi.org/10.3390/engproc2025084035
APA StyleRachmadhani, M. M., Gani, M., Histiarini, A. R., & Tuankotta, O. F. A. (2025). Risk Analysis on FGH Terminal Using Importance Index and Bowtie Analysis Methods. Engineering Proceedings, 84(1), 35. https://doi.org/10.3390/engproc2025084035