1. Introduction
The constant advancements in technology have led to the development of new tools that enhance human performance in various activities. The implementation of Industry 4.0, which includes automation and digital tools, has significantly impacted agricultural productivity [
1]. In regions like La Libertad, Peru, major agricultural projects such as Chavimochic have enabled large-scale production of key export crops, including avocados and asparagus [
1].
Among these crops, blueberries have gained prominence due to their export potential and increasing global demand [
2,
3]. The expansion of blueberry cultivation has been influenced by factors such as market competitiveness, technological improvements, and economic incentives [
3]. However, challenges such as disease outbreaks remain a concern. For instance, Thekopsora minima, a fungal pathogen causing blueberry leaf rust, has been recently reported in Peru, posing risks to production [
4].
Agronomic management practices play a crucial role in mitigating these risks and ensuring sustainable production. Guidelines provided by institutions such as INIA (Instituto Nacional de Innovación Agraria) offer valuable insights into efficient cultivation techniques [
5]. Additionally, trade policies and economic strategies have positioned Peru as the world's leading exporter of blueberries for four consecutive years [
6,
7].
To monitor and optimize agricultural production, remote sensing technologies such as LandViewer are being utilized to assess vegetation health through indices like NDVI (Normalized Difference Vegetation Index) [
8,
9]. These advancements have facilitated precision agriculture, enhancing crop monitoring and decision-making.
Furthermore, artificial intelligence techniques, particularly deep learning models, are being applied to analyze satellite imagery and predict crop yields. Methods such as Convolutional Neural Networks (CNNs) and visualization techniques like Grad-CAM have demonstrated promising results in agricultural research [
10,
11].
Considering these aspects, this study aims to analyze the impact of technological advancements on blueberry production in Peru, evaluating key factors such as export growth, disease management, and the integration of AI-based monitoring systems.
2. Materials and Methods
For the development of the program in the Google Earth engine environment, we proceeded to investigate the programming language. The language used to interact with the platform is JavaScript, which uses simple functions that, in turn, can be related to an interpretation similar to that of Python. After looking for examples of programs used on the same platform, we proceeded to create a program from scratch.
The final satellite that we will choose to use is Sentinel-2, regarding which, thanks to its greater number of bands, we can obtain the desired combination of RGB and vegetative index, as well as others such as NIR, which allows us to visualize the surface with other colors that are related to the calculations of production and vegetation health. As show in the
Figure 1, the RGB image obtained from Sentinel-2
2.1. Data and Collected Images
The chosen platform for obtaining our entire database is “LandViewer.” It allows us to frame an image containing our study area and save it as a JPG file.
The images obtained from the areas do not solely belong to a single satellite but to several of them. This is because, at certain times, there were satellites that captured an incorrect or non-visible image, while others obtained better results depending on the day or month of the image capture.
On the same platform, it enables selecting the image within the desired month range. This feature makes it much easier to obtain images each month within a more precise date range considering that the month range can vary by 1 day to ensure that the image remains valid for use.
2.2. Variables from the Images
The study variables presented in the research are the health level, crop humidity, and production in relation to these factors. It can be understood that a healthy crop produces more, while a diseased crop produces less or delays production. In search of bands that presented these desired values, the RGB band and the NDWI were identified. The NDWI is an indicator that helps to identify the presence of water in the area. A high value or the presence of light blue in the image represents the presence of water, while a low value or the presence of dark green indicates a lack of water. Equation (1) visualizes NDWI band combination for water content assessment.
2.3. Classification
To classify each image, they need to be distributed into three defined folders: growing, ready for harvest, and recently harvested. After organizing each of these images into their respective folders, the neural network model can be configured. Proceed with the results.
3. Results
3.1. Model Performance
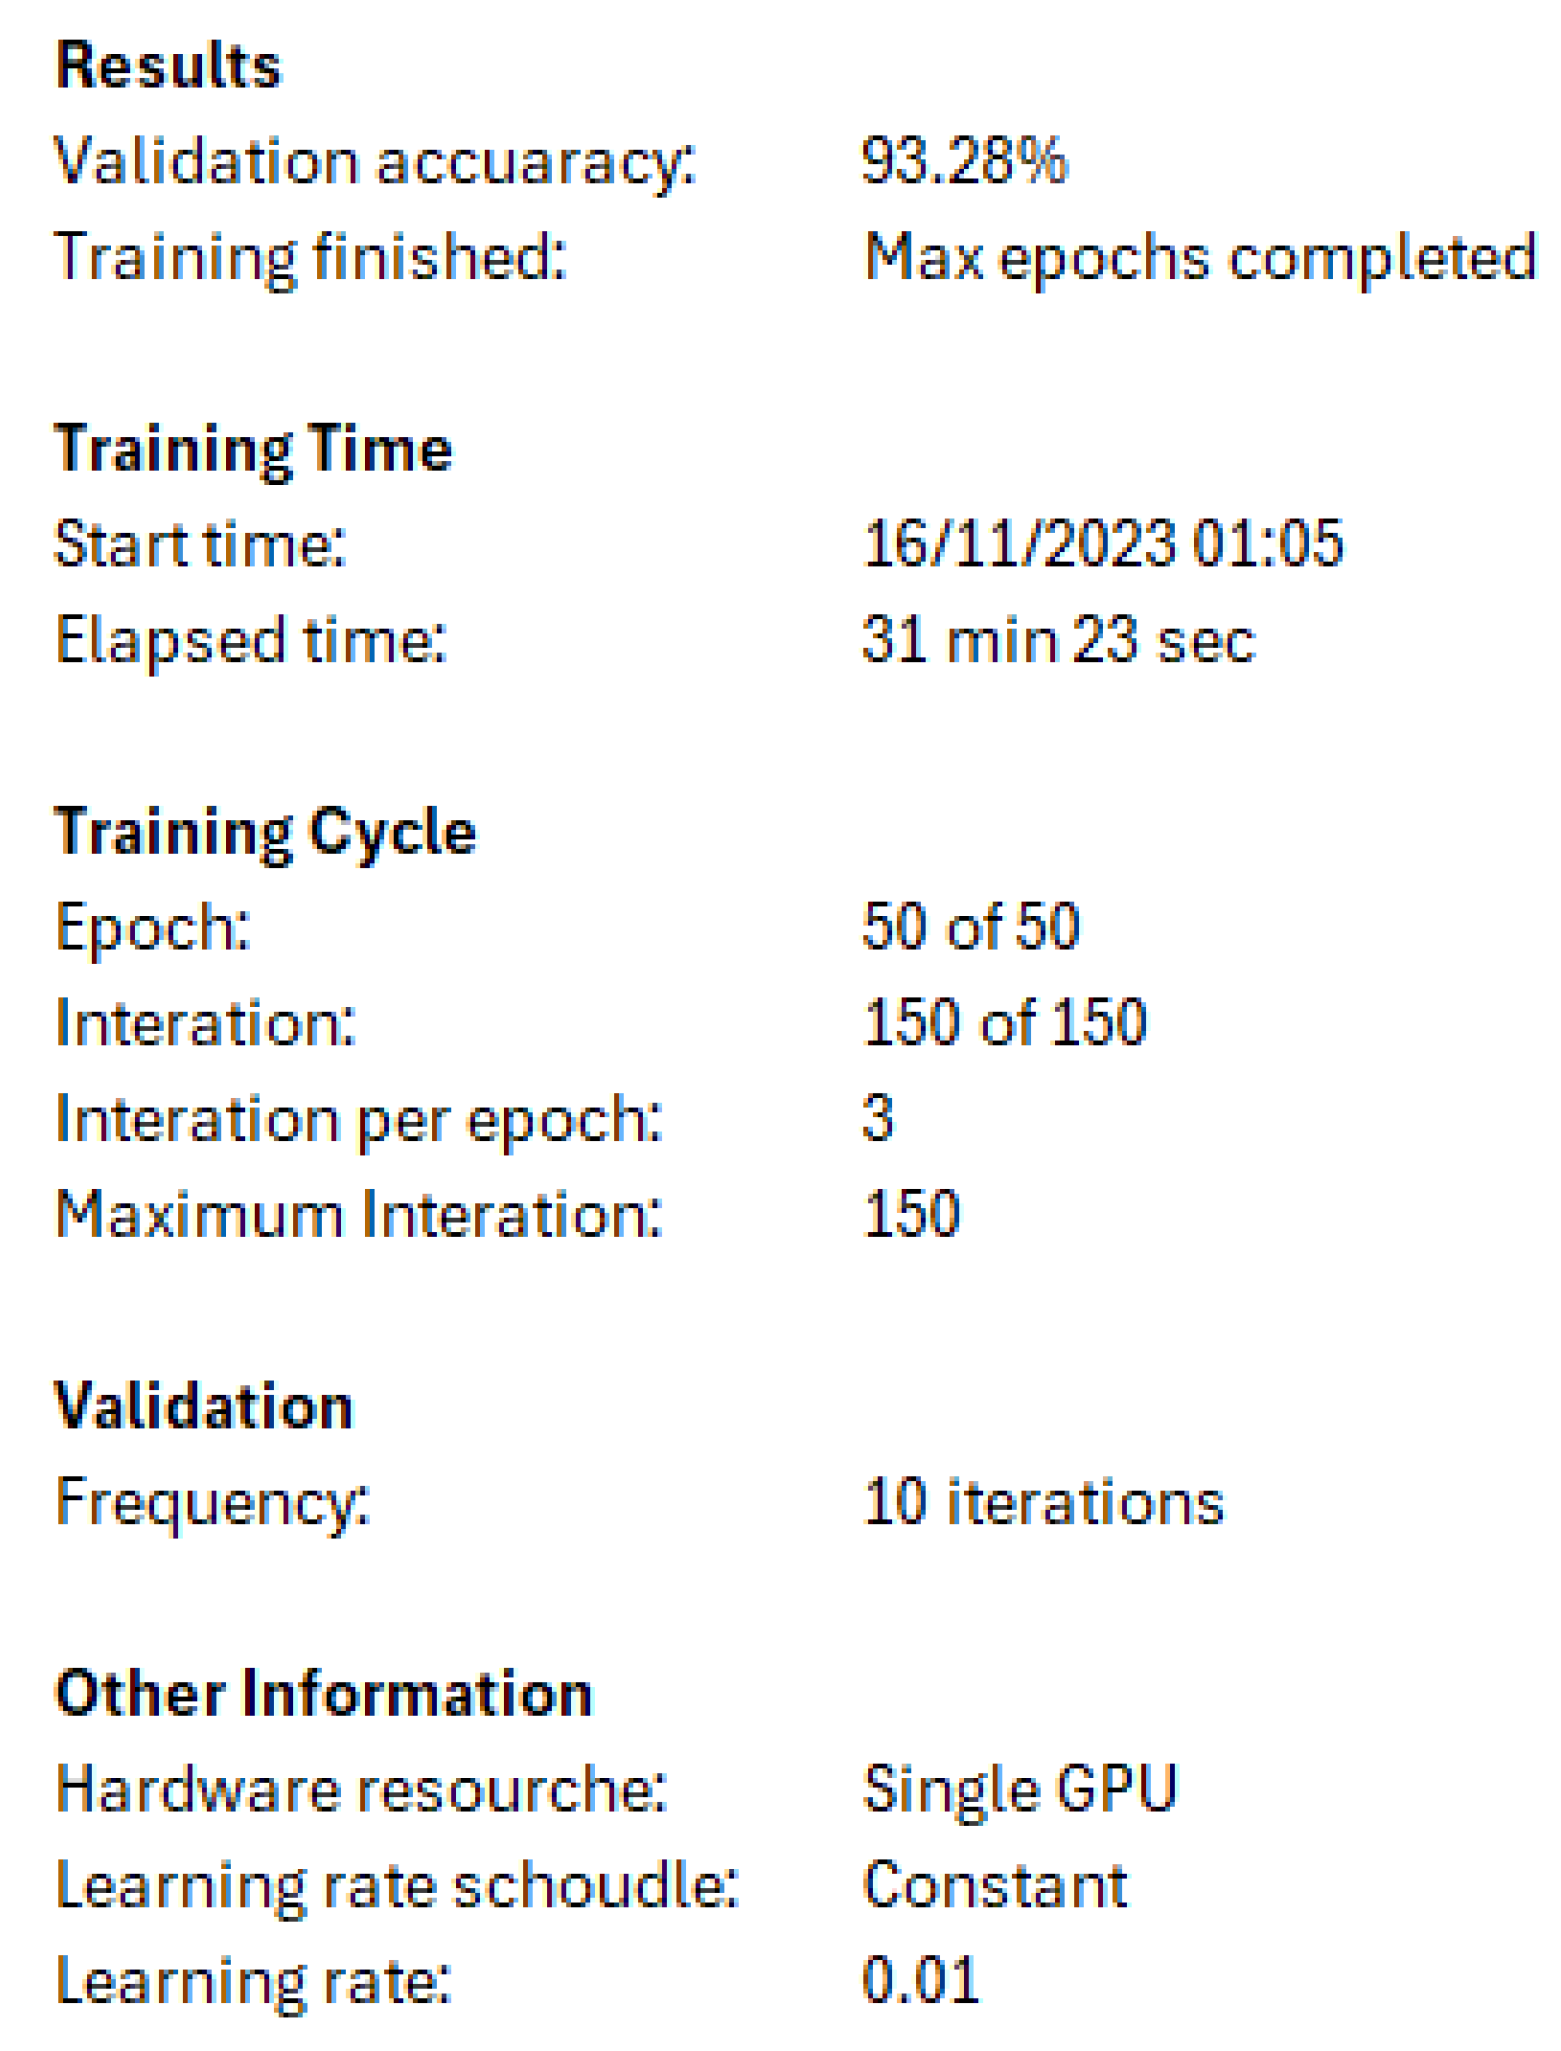
When running our program, we used an Nvidia 3050 RTX graphics card with four CUDA cores dedicated to image processing. Using neural network training tools, the program was started, and the following results were obtained.
In
Figure 2 and
Figure 3, the main tables can be observed, which are the precision with interactions table and the error and interactions table. The validation result of the neural network is 93%, indicating a favorable outcome in the development of the neural network. The configuration of our neural network is as follows:
Training parameter: 74 (80% of the total number of images).
Epochs parameter: 50.
Batch size parameter: 59.
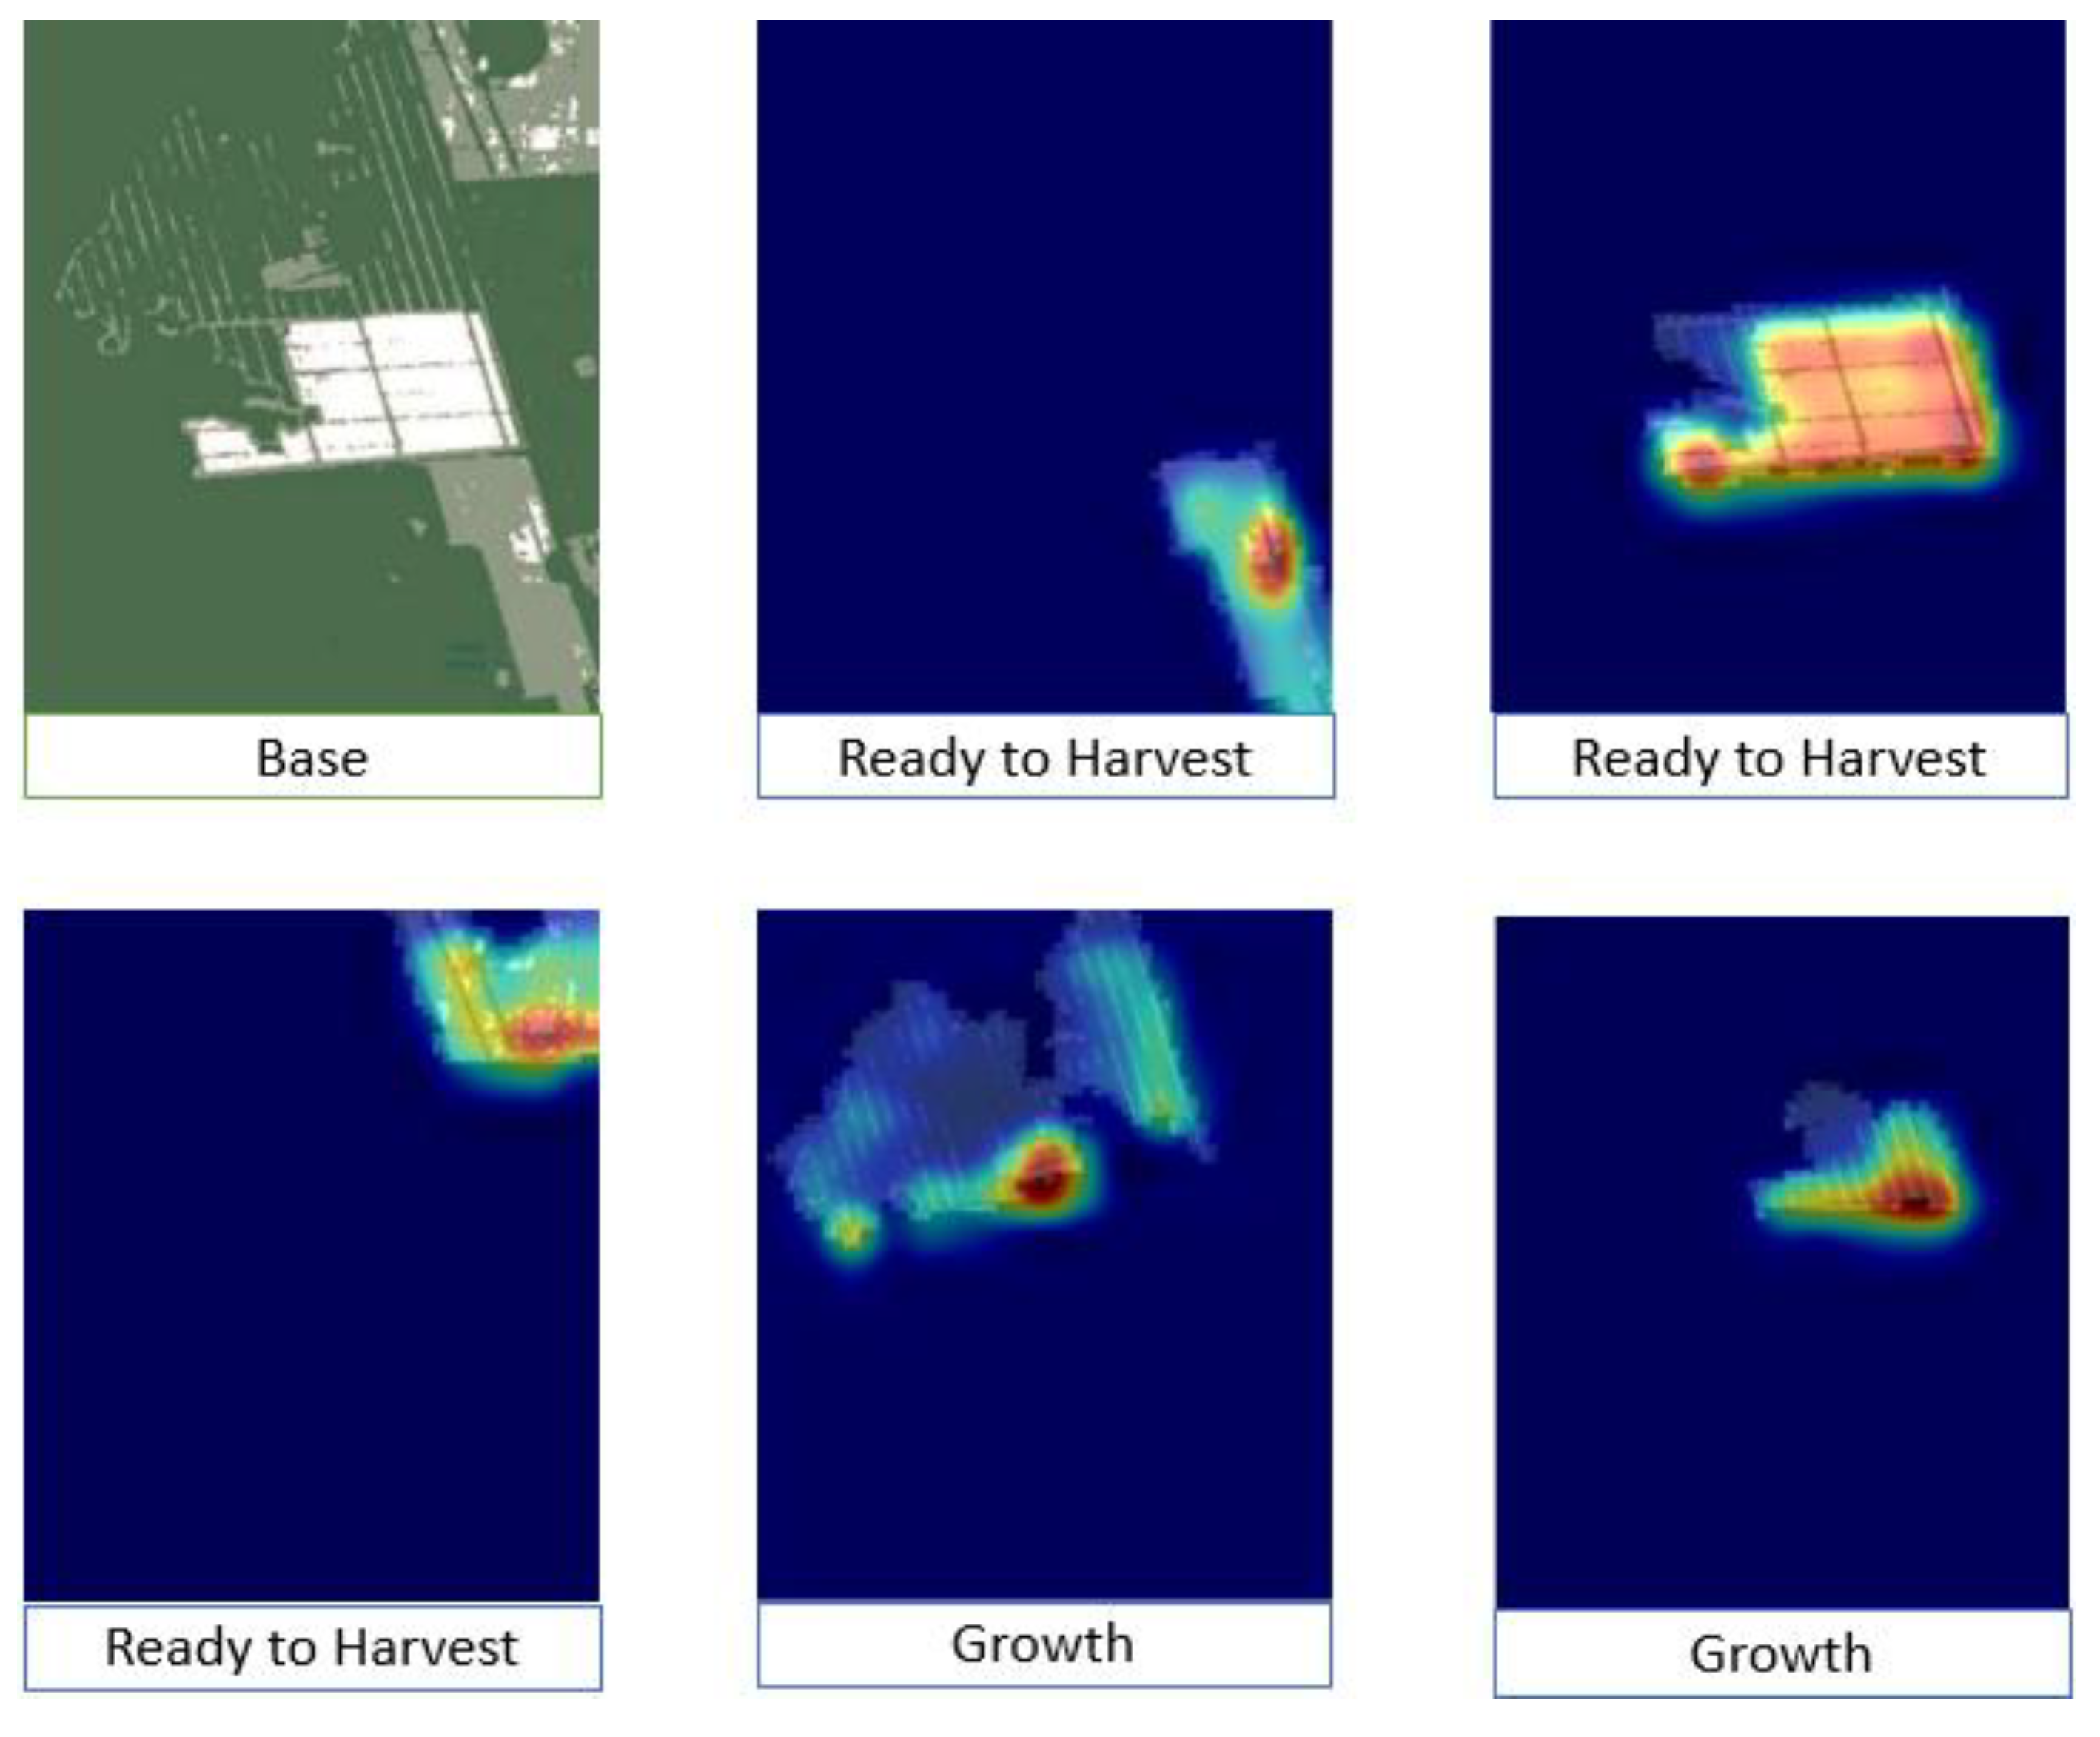
Interpretation of models (Grad-Cam).
The Grad-Cam tool enables running the resulting model on an image from the dataset, presenting the classification of each part of the image. The tool provides a color scheme indicating how the network classified each part.
The interpretation within each part of the crop reveals distinct characteristics corresponding to a field that is ready for harvest and one in the growth process. When a field is green, it can be understood that it is not ready or has recently been harvested, as shown in
Figure 4.
3.2. Analysis of Metrics (Confusion Matrices)
Within the MATLAB code, a section was added to visualize how the input images are detected and demonstrate how the 93% result was achieved. The confusion matrices divide among the existing groups within the training dataset.
The performance of the classification model can be analyzed through the confusion matrix (
Figure 5), which provides insights into the accuracy and misclassification rates within different growth stages.
In
Figure 5, the colors represent different levels of accuracy and misclassification: red squares indicate misclassification errors, green squares represent correct classifications with high precision, numbers in green indicate correctly identified percentages, and numbers in red indicate misclassified percentages. The yellow square represents the overall model accuracy.
Interpreting these results, it can be observed that, when verifying whether an image corresponds to the growth stage or the harvested stage, there is a higher probability of misclassification. This is because, during the harvest, not everything is collected at the same time, leading to the continued presence of white spots in the image, indicating that there are still plants in the field.
4. Discussion
As established by ref. [
1], the use of satellite images provides us multi-temporal images that are widely used to evaluate and monitor the status of a plantation, which in this case would be blueberry crops. Thus, the vigor index or vegetation index can be defined as a parameter determined through calculations obtained from the reflectance values at different wavelengths.
According to ref. [
4], zoning should be considered a fundamental pillar to understand the variability regarding the crop and its interaction with the environment. This aspect will serve as a foundation for agricultural planning by enabling segmentations derived from monitoring the vegetative states of plants. These segmentations are associated with the vigor index, photosynthetic activity, and soil, water, and climatic conditions, while also determining potential crop responses influenced by these interactions. This information is obtained from the analytical results of the Sentinel-2 technology. Crop fields are composed of hectares of land that are quite rustic and with access that is an encumbrance to human activity. Furthermore, in these types of places that are exposed to the environment, it is quite complicated to predict certain factors that are environmental in nature, such as water, air, and soil. These environmental criteria are of vital importance because they determine the time and quality of the product that will be obtained after harvesting [
11].
5. Conclusions
Regarding data collection, the variables are affected by weather conditions (presence of clouds), thus making image collection difficult. However, in the analysis of this project, the images were captured by the Sentinel-2 satellite, and those from the platform of the Ministry of Agrarian Development and Irrigation coincide with the production and harvest seasons. Additionally, Sentinel-2 has proven to offer significant benefits in cultivation processes..
Sentinel-2 is both effective and essential for assessing humidity and blueberry production in the Nuevo Chao area of La Libertad. Based on the findings mentioned above, this technology provides highly precise and detailed information about crop area conditions, enabling improvements and accelerating the cultivation and harvesting processes for the input. In order to obtain more accurate results, it was decided to implement this type of software to monitor the process efficiently.
Author Contributions
Conceptualization: C.R., V.M., S.M., S.H. and A.A.; Methodology: A.A., C.R. and S.H.; Validation: A.A.; Formal Analysis: S.H.; Investigation: A.A.; Resources: S.H.; Data curation: S.H. and A.A.; Writing Original Draft Preparation: C.R., V.M. and S.M.; Writing Review and Editing: S.H. and A.A.; Visualization: S.H.; Supervision: A.A.; Project Administration: C.R. All authors have read and agreed to the published version of the manuscript.
Funding
This research received no external funding.
Institutional Review Board Statement
Not applicable.
Informed Consent Statement
Not applicable.
Data Availability Statement
The data presented in this study were obtained from the LandViewer satellite image platform. Although the original images used in this study are no longer in our possession, they can be acquired through the platform. LandViewer allows users to obtain up to 10 images per day per account, enabling the reproduction of the dataset used in this research.
Conflicts of Interest
The authors declare no conflict of interest.
References
- Apaza, W.; Quiroz, P.; Julca-Otiniano, A. Characterisation of avocado and asparagus farms in the Chavimochic irrigation project in La Libertad, Peru. Peru. J. Agron. 2019, 3, 91–103. [Google Scholar] [CrossRef]
- Calderón, J.M.H. Producción, Comercio y Perspectivas. 2016. Available online: https://www.academia.edu/ (accessed on 10 March 2023).
- Carbonell Santillán, C.E. Análisis de los Factores de Crecimiento y Competitividad de las Exportaciones de Arándanos Frescos en Perú, 2011–2021; USIL: Lima, Peru, 2023. [Google Scholar]
- Huarhua, M.; Acuña, R.; Aragón, L.; Soto, J.; Landeo, S.; Martínez De La Parte, E.; Apaza, W. First Report of Blueberry Leaf Rust Caused by Thekopsora minima on Vaccinium corymbosum in Peru. Plant Dis. 2020, 104, 3077. [Google Scholar] [CrossRef]
- INIA. Manual de Manejo Agronómico del Arándano. 2017. Available online: https://biblioteca.inia.cl/bitstream/handle/20.500.14001/6673/NR40907.pdf?sequence=41 (accessed on 3 March 2023).
- Krishevsky, A.; Sutskever, I.; Hinton, G. ImagNet Classification with Deep Convolutional Neural Networks. Commun. ACM 2017, 60, 84–90. [Google Scholar] [CrossRef]
- LandViewer. Available online: https://eos.com/landviewer/?lat=-8.51601&lng=-78.67275&z=13 (accessed on 5 January 2023).
- Perú, por Cuarto Año Consecutivo, Vuelve a ser el Primer Exportador Mundial de Arándanos. Available online: https://www.gob.pe/institucion/embajada-del-peru-en-espana/noticias/737763-peru-por-cuarto-ano-consecutivo-vuelve-a-ser-el-primer-exportador-mundial-de-arandanos (accessed on 15 December 2023).
- Rodríguez Sosa, J.S.; Villafuerte Medina, F.G. Factores que Influyen en la Exportación de Arándanos Frescos en la Región de La Libertad 2015–2019; USIL: Lima, Peru, 2021. [Google Scholar]
- Selvaraju, R.; Cogswell, M.; Das, A.; Vedantam, R.; Parikh, D.; Batra, D. Grad-CAM: Visual Explanations from Deep Networks via Gradient-Based Localization. In Proceedings of the 35th IEEE International Conference on Computer Vision (ICCV), Venice, Italy, 22–29 October 2017. [Google Scholar]
- Wang, M.; Fu, J.; Wu, Z.; Pang, Z. Spatiotemporal Variation of NDVI in the Vegetation Growing Season in the Source Region of the Yellow River, China. ISPRS Int. J. Geo-Inf. 2020, 9, 282. [Google Scholar] [CrossRef]
| Disclaimer/Publisher’s Note: The statements, opinions and data contained in all publications are solely those of the individual author(s) and contributor(s) and not of MDPI and/or the editor(s). MDPI and/or the editor(s) disclaim responsibility for any injury to people or property resulting from any ideas, methods, instructions or products referred to in the content. |
© 2025 by the authors. Licensee MDPI, Basel, Switzerland. This article is an open access article distributed under the terms and conditions of the Creative Commons Attribution (CC BY) license (https://creativecommons.org/licenses/by/4.0/).


