
IoT-Enabled Intelligent Health Care Screen System for Long-Time Screen Users †


Abstract
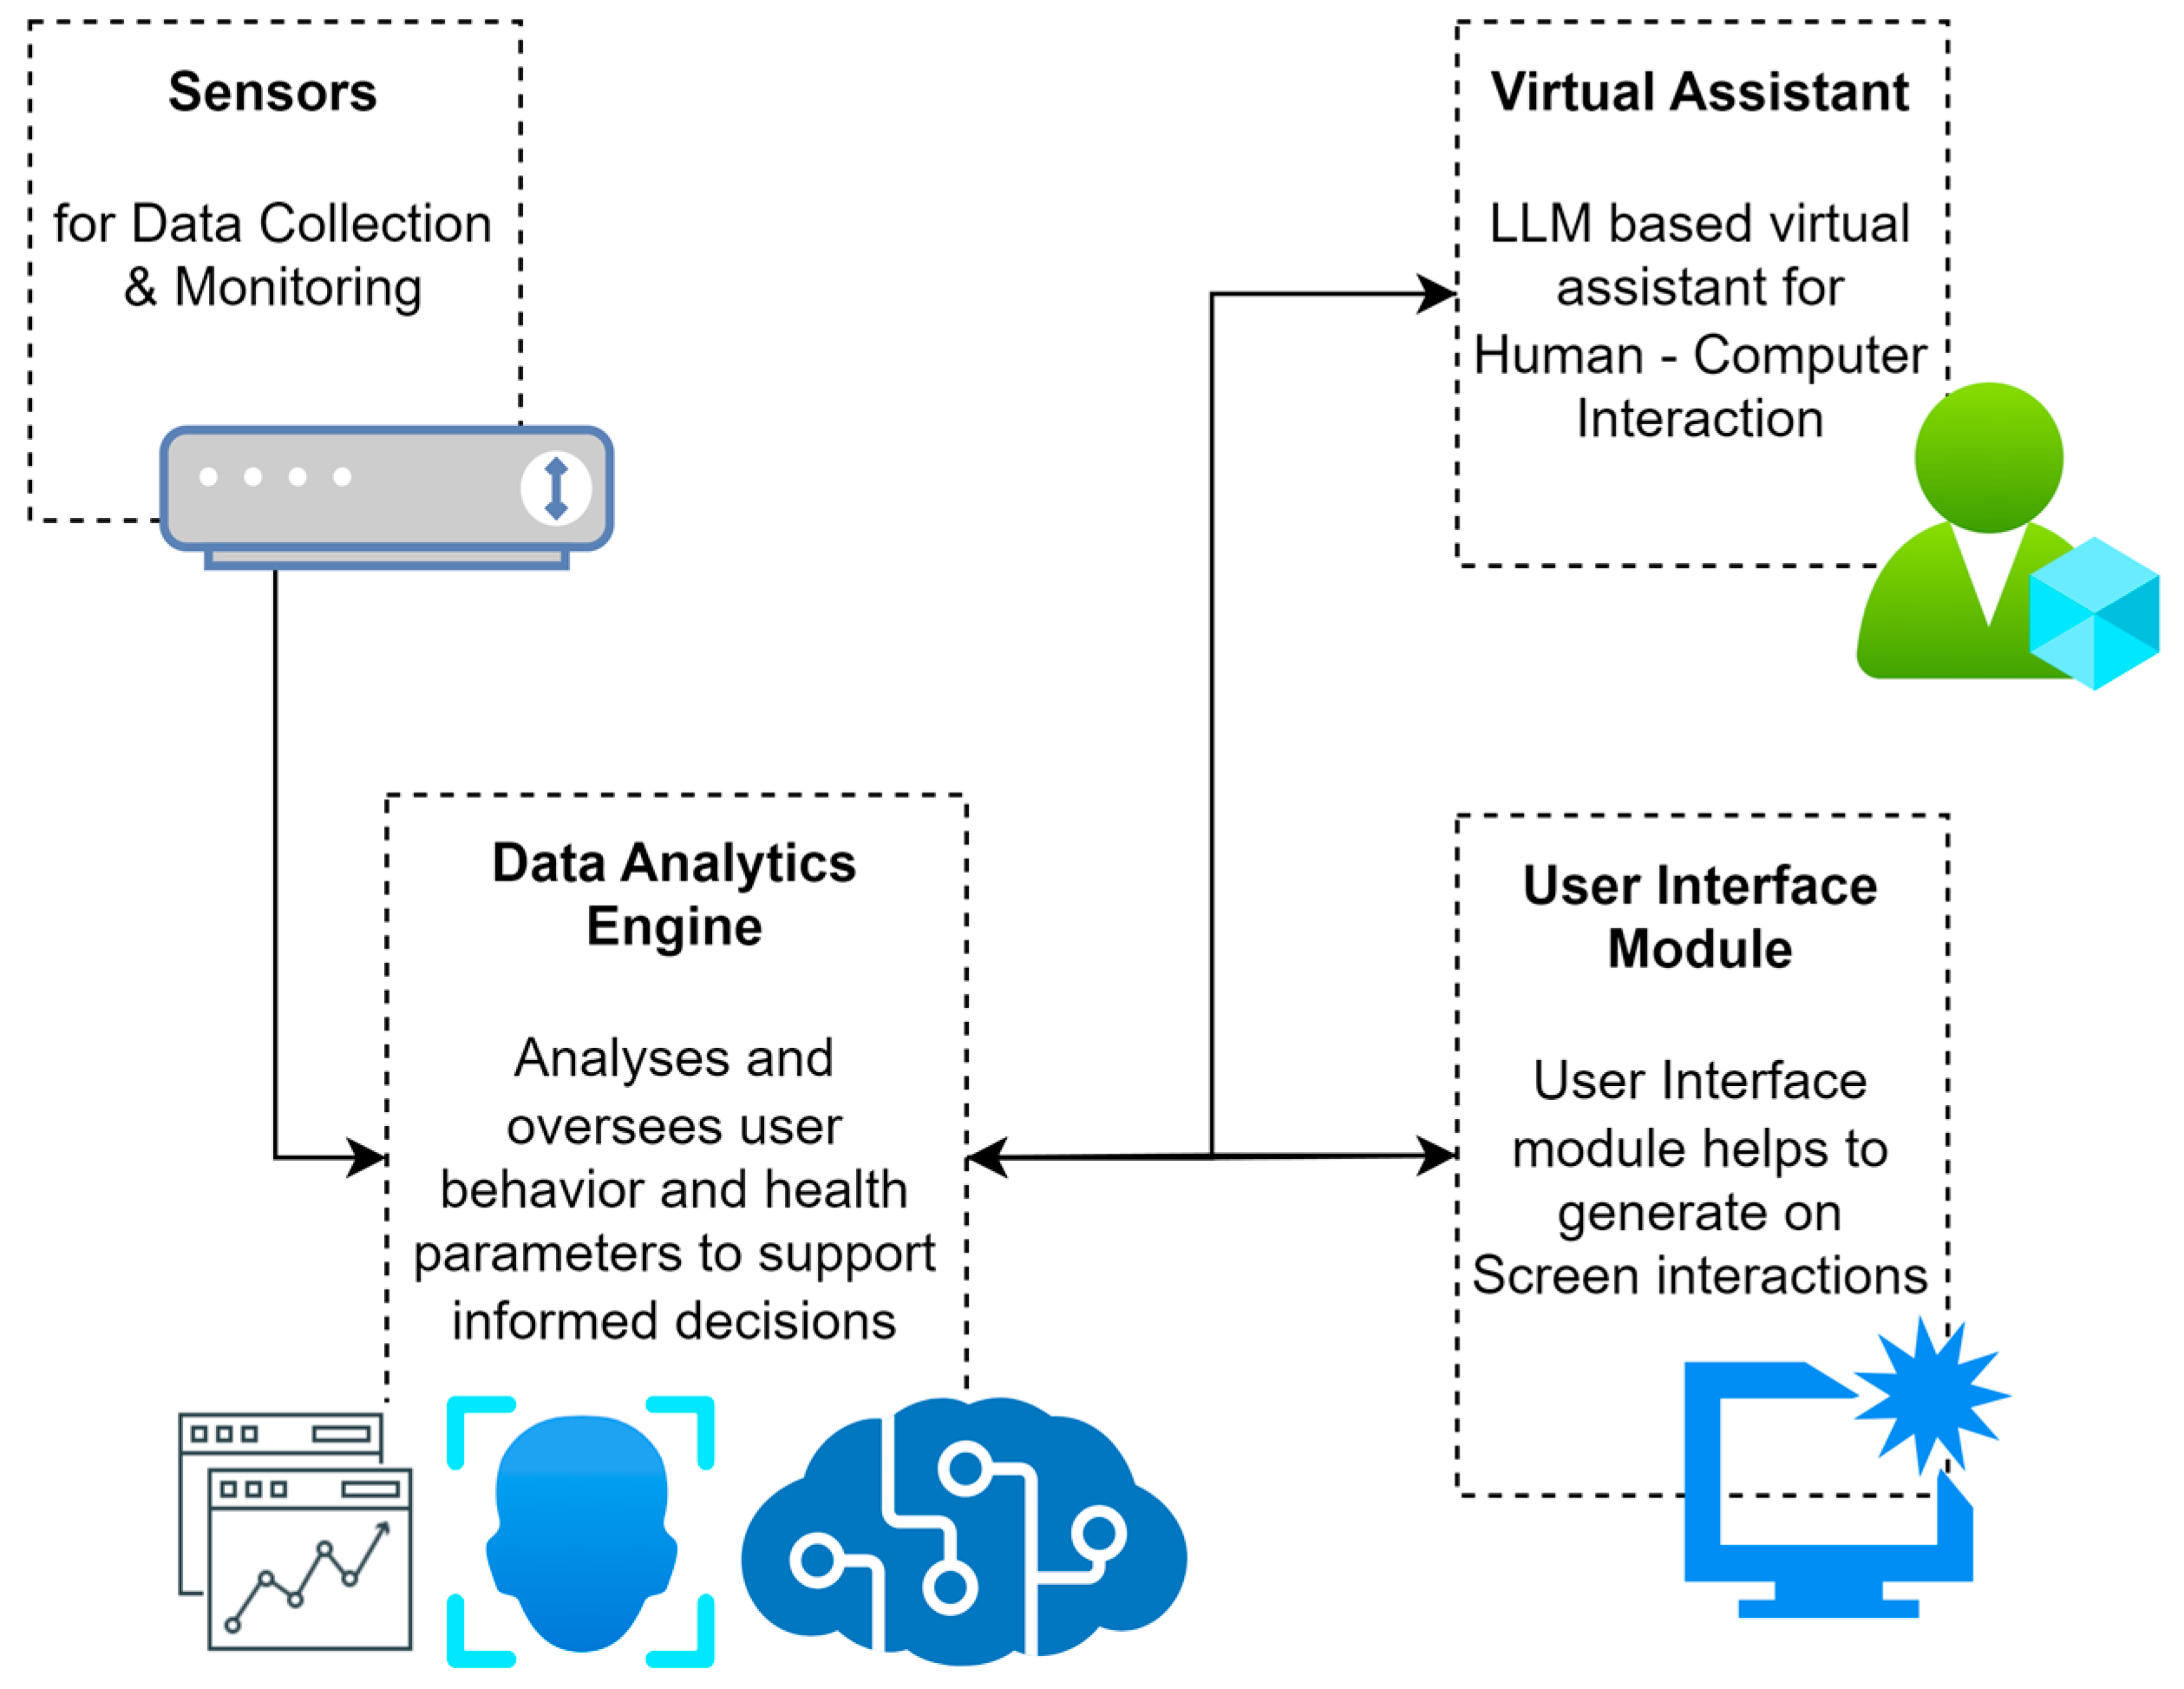
1. Introduction
2. Methods
2.1. Sensor Data Collection and Processing
- Interface between sensors for heart rate monitor, posture sensor, and eye tracker, etc.;
- Ensuring and aggregating real-time data acquisition and processing;
- Data filtering and noise reduction;
- User behaviour tracking and detection.
- Heart Rate Sensor (MAX30100, Shenzhen Electronics, Shenzhen, China)—Helps to track heart rate and its variation; monitoring heart rate and its variability will help to track stress levels and cardiovascular health. The sensor also helps to measure blood oxygen levels and identifies the freshness in the workspace.
- Posture Sensor—The posture sensor is a combination of multiple pressure sensors (FlexiForce A401, Sri Electronics & Embedded Solutions, Coimbatore, Tamil Nadu, India) and an Inertial Measurement Unit (IMU) (MPU-6050, RS Components Ltd., Corby, UK) to monitor head and shoulder angles. These sensors track the user’s sitting posture and identify the potential problems and risks associated with ergonomics. Posture sensors will combine pressure sensors and camera-based pose estimation techniques.
- Camera Feed—The live camera feed tracks the user’s emotional status, estimates their seating posture, and tracks their eye movement and time spent staring the screen. All these estimations and validations are conducted based on the images and video footage obtained from the camera and processed by CNN models to extract features.
- Eye Tracker (Tobii Eye Tracker 4C, Tobii, Stockholm, Sweden)—Tracks eye movements and detects signs of eye strain. It also monitors the user’s blinking rate, fixation duration, and pupil dilation, etc. This is also conducted with the support of the camera and ML models associated with the process.
- Temperature Sensor (DHT11, Bombay Electronics, Mumbai, India)—Measures workspace temperature, body temperature, and seat temperature to analyse the comfort level of the posture and the workspace balance.
- Face and Emotion Detector—The face of the user and their emotions while using the application or screens are tracked. Tracking the face, the time the face is in front of the screen, and the emotional status during this time is also conducted with the help of ML and DL algorithms from the video feed and processed with CNN models to extract relevant features.
- Electrodermal Activity Sensor (Shimmer3 GSR, Shimmer, Dublin, Ireland)—This sensor is used to measure skin conductance as an additional indicator of the stress and emotional status of the user.
- Ambient Light Sensor (TSL2561, Bytesware Electronics, Banglore, India)—This sensor measures the surrounding light levels, adjusts screen brightness, and reduces eye strain. The sensor will also help understand the change in eye movements and facial expressions based on the light intensity in the workspace.
- Motion Sensor (HC SR501, Sunrom Electronics, Gujarat, India)—This sensor detects and tracks the user’s movements, identifies their inactive time, and helps to remind the users to take breaks and change positions to have better body movements and enhance comfort and improve productivity.
- Heart Rate Sensor—Mounted on a wristband or something wearable that maintains direct skin contact. Positioned to avoid disruptions from wrist movements.
- Posture Sensors—Integrated into ergonomic seating arrangements, with pressure sensors distributed across the seat and backrest to detect weight shifts and slouching.
- Eye Tracker—Attached to the top bezel of the screen to ensure an unobstructed view of the user’s eyes. Positioned at a fixed distance to maintain accuracy across different users.
- Temperature Sensor—Embedded within the screen frame to measure ambient temperature and identify user comfort levels.
- EDA Sensor—Placed on the non-dominant wrist to reduce motion artefacts and interference during typing activities.
- Internet usage;
- Time spent on mobiles;
- The tone of communication;
- Login–logout time;
- Typing speed;
- Scrolling speed.
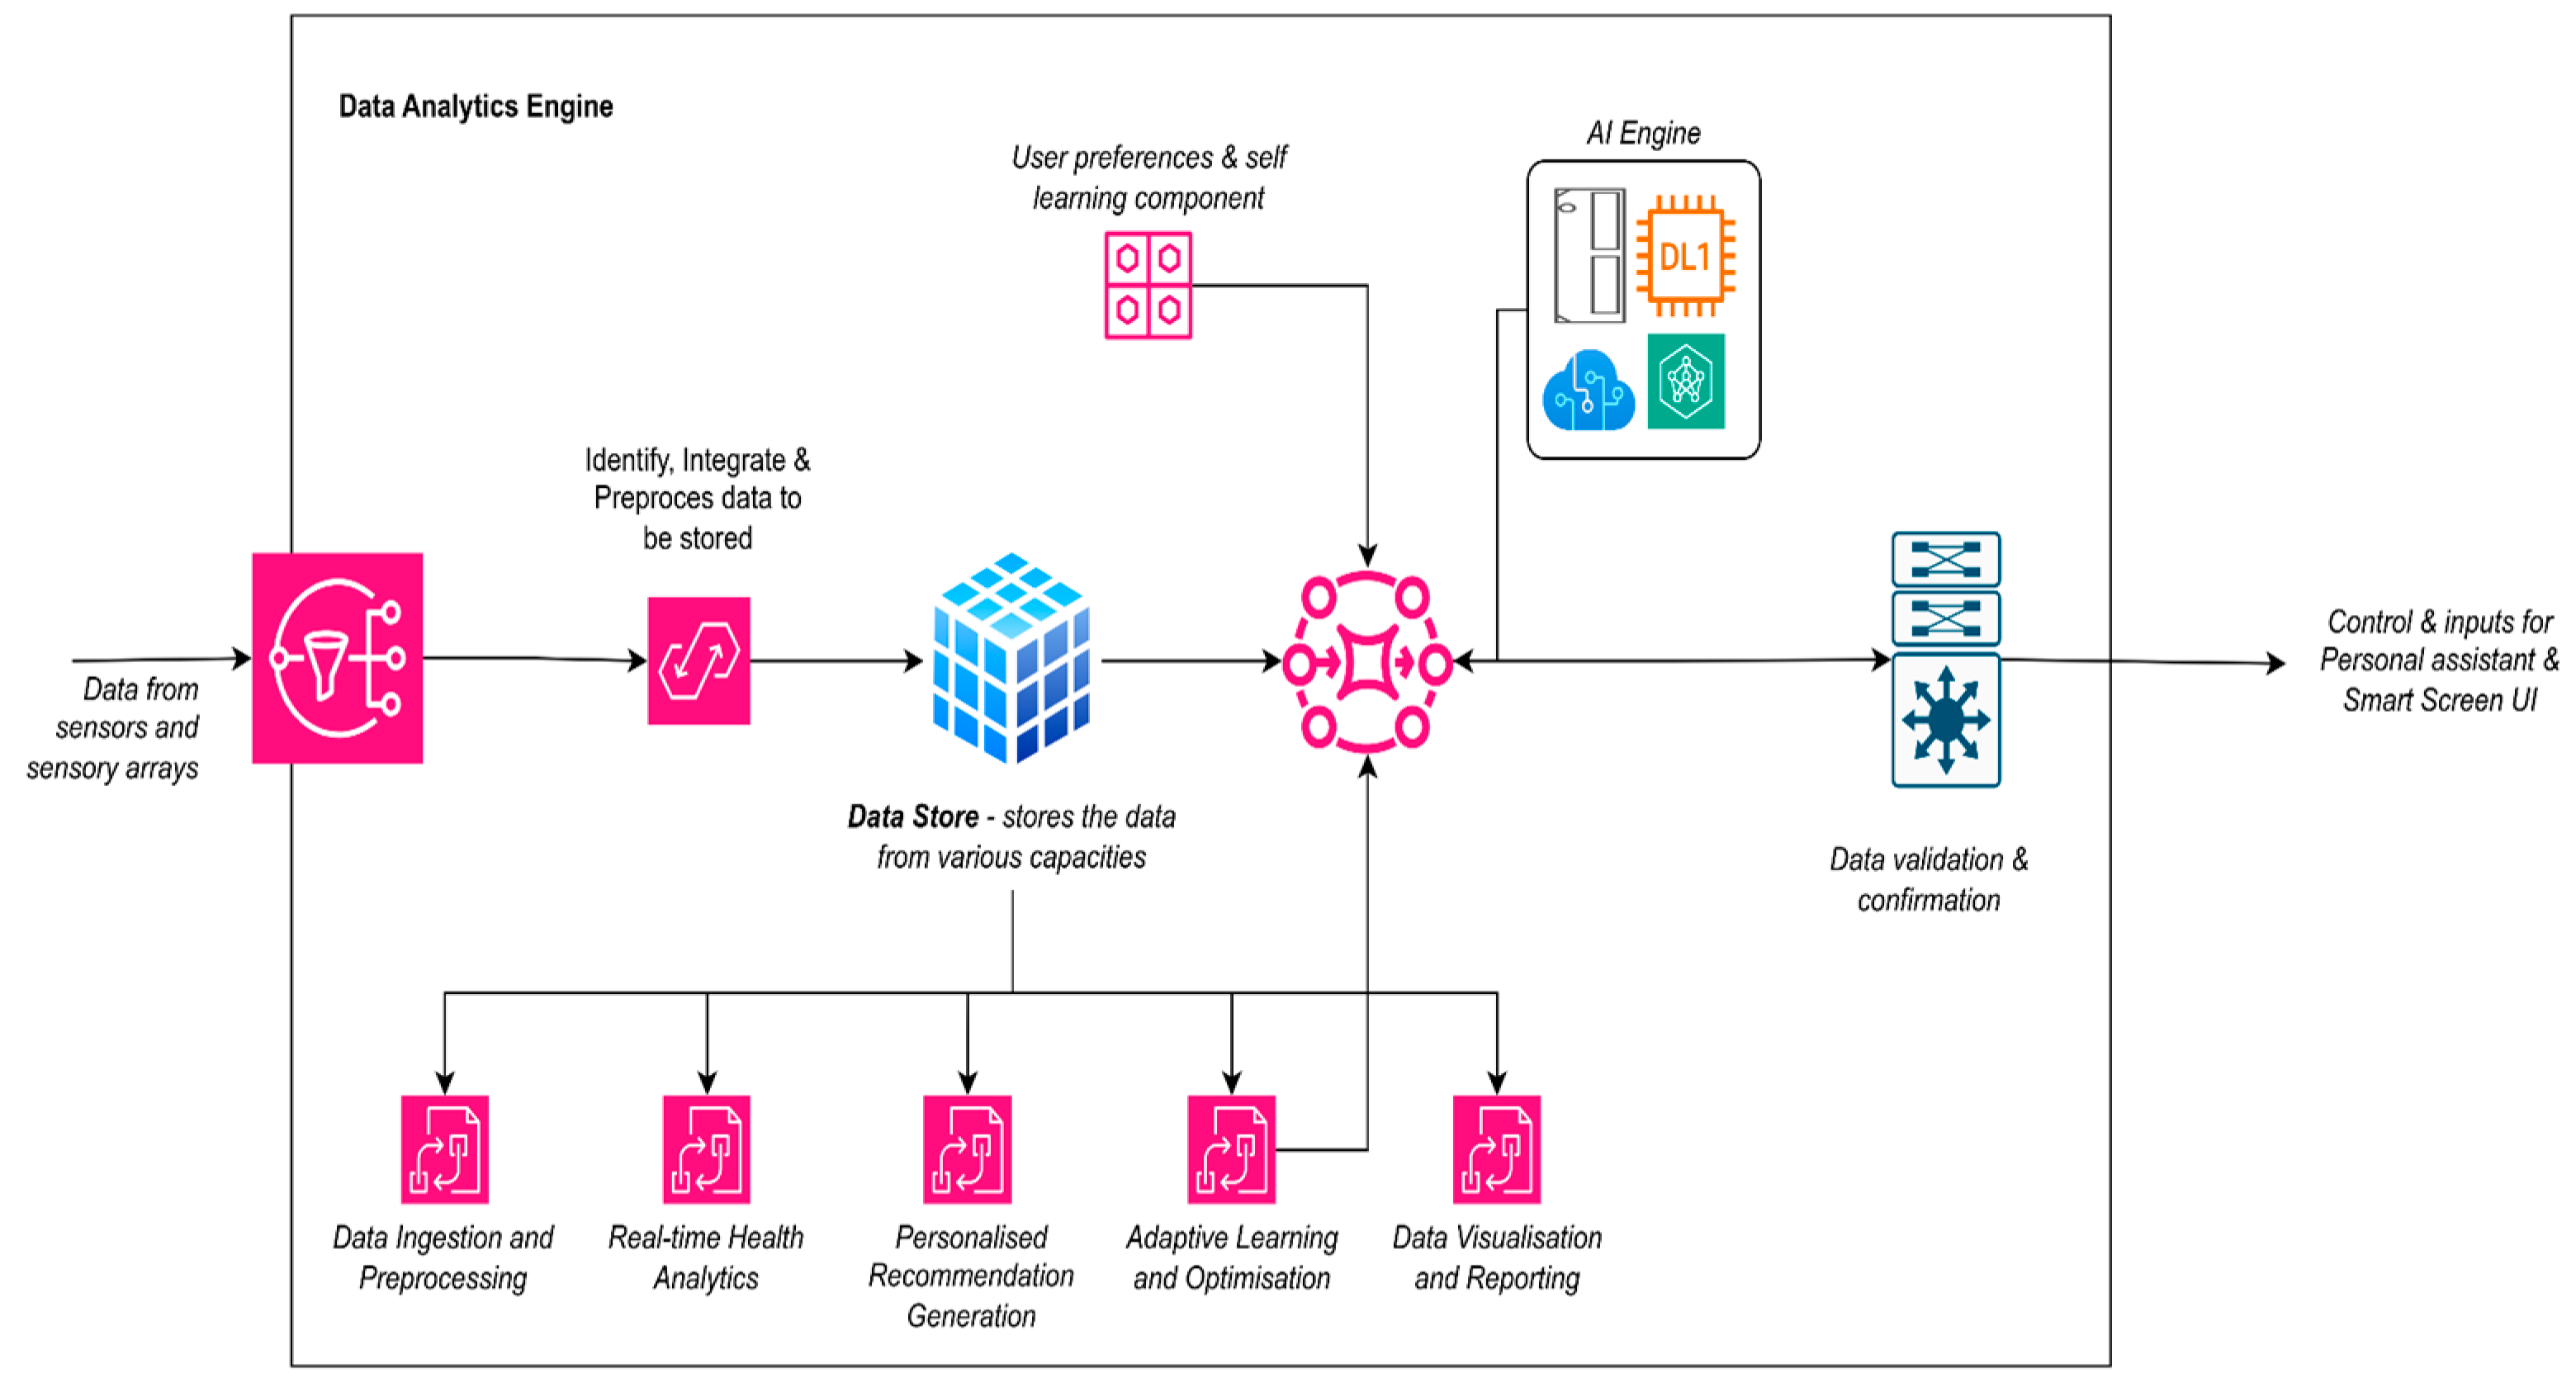
2.2. Data Analytics Engine
- Data ingestion and pre-processing—Analyses, verifies, and streamlines the data from various sensors and sensory arrays stored in the data store. This process also verifies the data with the user’s health database and medical history to identify and record abnormalities. Required data filtering, cleaning, and other processes are part of this step to verify that the actual data are stored in the database.
- Real-time health analytics—Keep track of health-related parameters from the various sensors. These keep track of anomalies and reports to users on the steps they should take. With the help of DL algorithms, the system captures the various parameters, and then, using ML algorithms, the system will predict the user’s health.
- Personalised Recommendation Generation—This analytical engine handles personalised health tracking and reports. The system uses a rule-based system to trigger actions and recommendations for the other part of the system to get the users to care for their health.
- Adaptive Learning and Optimisation—This part of the analytical engine manages the feedback from the user based on the recommendations made to them, and self-learns the changes that the user has to undergo for each of the changes. The adaptive learning system is essential in the recommendation of actions for the identified stages.
- Data visualisation and reporting—This section focuses on generating reports for the user, based on which the user can finetune the system settings to tailor them to the needs of the individual.
- Random Forest (RF) Classifier—The RF classifier helps in the effective classification of the seating posture of the users from the sensor data, which includes head and shoulder angles. RF uses the decision trees to identify the non-linear relationships between different ergonomic features. The RF model is implemented to handle the possibility of noisy sensor data.
- Support Vector Machine (SVM)—The SVM detects the user’s stress. The SVM classifies stress based on electrodermal activity and heart rate variability data.
- Convolutional Neural Networks (CNN)—The CNN model is applied to extract data from the live camera feed, in order to track the user’s facial emotions, eye movements, and posture. The CNN model extracts spatial features from video frames and predicts eye strain and emotional status.
- K-Means Clustering—The k-means clustering algorithm groups the users based on behaviour patterns and identifies recommendations based on screen time, typing speed, and activity breaks.
- Long Short-Term Memory (LSTM) Networks—LSTM networks are implemented to track the dependencies in user behaviour, while continuously monitoring health trends over time. LSTM networks could detect abnormalities over time and help recommend breaks and other activities based on user interactions.
2.3. Virtual Assistant
- Natural Language Understanding (NLU)—The role of NLU is to accurately identify the user’s intent from their spoken queries and responses [11], which include queries related to health information, break reminders, and seeking exercise suggestions, etc., and to track and extract information from the entities associated, maintain context, and set the appropriate context for conversations.
- Natural Language Generation (NLG)—The NLG engine formulates clear, concise, and contextually relevant responses based on the user’s intent and the system recommendations. It generates conversation responses according to the users’ preferences and communication styles [12], enhances and tracks user engagement, and makes changes to the style of interventions.
- Dialogue Management—Responsible for maintaining natural, engaging conversations, tracking the conversation flow, and adapting to changes when interruptions occur during conversations [13]. The changes and tracking of the flow are maintained so that the user is not offended by the system responses, by retaining relevant information from previous interactions to provide contextually appropriate responses.
2.4. User Interface Module
3. Results and Discussion
- The values w1, w2, and w3 are weights assigned to each postural parameter based on relative importance;
- Head Angle, shoulder angle, and back angle are measured in degrees and compared to ideal ergonomic ranges.
4. Conclusions
Author Contributions
Funding
Institutional Review Board Statement
Informed Consent Statement
Data Availability Statement
Conflicts of Interest
References
- Liao, Z.; Luo, Z.; Huang, Q.; Zhang, L.; Wu, F.; Zhang, Q.; Wang, Y. SMART: Screen-based gesture recognition on commodity mobile devices. In Proceedings of the 27th Annual International Conference on Mobile Computing and Networking, New Orleans, LA, USA, 25–29 October 2021; pp. 283–295. [Google Scholar]
- Dalton, G.; McDonna, A.; Bowskill, J.; Gower, A.; Smith, M. The design of smartspace: A personal working environment. Pers. Technol. 1998, 2, 37–42. [Google Scholar] [CrossRef]
- Androutsou, T.; Angelopoulos, S.; Hristoforou, E.; Matsopoulos, G.K.; Koutsouris, D.D. Automated Multimodal Stress Detection in Computer Office Workspace. Electronics 2023, 12, 2528. [Google Scholar] [CrossRef]
- LeBlanc, A.G.; Gunnell, K.E.; Prince, S.A.; Saunders, T.J.; Barnes, J.D.; Chaput, J.P. The ubiquity of the screen: An overview of the risks and benefits of screen time in our modern world. Transl. J. Am. Coll. Sports Med. 2017, 2, 104–113. [Google Scholar] [CrossRef]
- Montagni, I.; Guichard, E.; Carpenet, C.; Tzourio, C.; Kurth, T. Screen time exposure and reporting of headaches in young adults: A cross-sectional study. Cephalalgia 2016, 36, 1020–1027. [Google Scholar] [CrossRef]
- Neophytou, E.; Manwell, L.A.; Eikelboom, R. Effects of excessive screen time on neurodevelopment, learning, memory, mental health, and neurodegeneration: A scoping review. Int. J. Ment. Health Addict. 2021, 19, 724–744. [Google Scholar] [CrossRef]
- Yi, Z.; Ouyang, J.; Liu, Y.; Liao, T.; Xu, Z.; Shen, Y. A Survey on Recent Advances in LLM-Based Multi-turn Dialogue Systems. arXiv 2024, arXiv:2402.18013. [Google Scholar]
- Mahmood, A.; Wang, J.; Yao, B.; Wang, D.; Huang, C.M. LLM-Powered Conversational Voice Assistants: Interaction Patterns, Opportunities, Challenges, and Design Guidelines. arXiv 2023, arXiv:2309.13879. [Google Scholar]
- Lv, Z.; Poiesi, F.; Dong, Q.; Lloret, J.; Song, H. Deep learning for intelligent human–computer interaction. Appl. Sci. 2022, 12, 11457. [Google Scholar] [CrossRef]
- Zheng, Y.; Jin, M.; Liu, Y.; Chi, L.; Phan, K.T.; Chen, Y.P.P. Generative and contrastive self-supervised learning for graph anomaly detection. IEEE Trans. Knowl. Data Eng. 2021, 35, 12220–12233. [Google Scholar] [CrossRef]
- McShane, M. Natural language understanding (NLU, not NLP) in cognitive systems. AI Mag. 2017, 38, 43–56. [Google Scholar] [CrossRef]
- Reiter, E.; Dale, R. Building applied natural language generation systems. Nat. Lang. Eng. 1997, 3, 57–87. [Google Scholar] [CrossRef]
- Çekiç, T.; Manav, Y.; Dündar, E.B.; Kılıç, O.F.; Deniz, O. Natural language processing-based dialog system generation and management platform. In Proceedings of the 2020 5th International Conference on Computer Science and Engineering (UBMK), Diyarbakir, Turkey, 9–11 September 2020; pp. 99–104. [Google Scholar]
- Guan, Y.; Wang, D.; Chu, Z.; Wang, S.; Ni, F.; Song, R.; Zhuang, C. Intelligent Agents with LLM-based Process Automation. In Proceedings of the 30th ACM SIGKDD Conference on Knowledge Discovery and Data Mining, Barcelona, Spain, 25–29 August 2024; pp. 5018–5027. [Google Scholar]
- Qiu, H.; Lan, Z. Interactive Agents: Simulating Counselor-Client Psychological Counseling via Role-Playing LLM-to-LLM Interactions. arXiv 2024, arXiv:2408.15787. [Google Scholar]


| Category | Age Range | Count of Participants | Male | Female |
|---|---|---|---|---|
| School | Up to 17 Years | 7 | 3 | 4 |
| College | 18–25 Years | 9 | 4 | 5 |
| Working | 21–60 Years | 10 | 6 | 4 |
| Others | 61 and Above | 4 | 2 | 2 |
| (a) | ||||||||||
| Category | Gender | Time (s) | Heart Rate (bpm) | Blink Rate (blink/min) | Pupil Dilation (mm) | Head Angle (°) | Shoulder Angle (°) | Back Angle (°) | Stress Level (1–10) | |
| School | Male | 0 | 72.49 | 24.26 | 4.33 | 4.97 | 11.56 | 4.68 | 8 | |
| School | Male | 10 | 83.77 | 10.01 | 4.98 | 5.44 | 16.12 | 0.21 | 9 | |
| School | Male | 20 | 66.81 | 19.28 | 3.46 | 14.58 | 14.67 | 25.80 | 7 | |
| School | Male | 30 | 71.09 | 11.47 | 4.21 | 1.00 | 11.22 | 14.86 | 3 | |
| School | Female | 0 | 69.20 | 15.69 | 4.93 | −1.58 | 12.96 | 27.55 | 6 | |
| School | Female | 10 | 72.16 | 17.41 | 4.57 | −1.62 | 11.74 | 21.36 | 8 | |
| School | Female | 20 | 68.83 | 19.21 | 3.59 | 4.43 | 17.38 | 24.19 | 3 | |
| School | Female | 30 | 78.63 | 12.51 | 4.14 | 14.79 | 10.73 | 2.31 | 3 | |
| College | Male | 0 | 72.94 | 16.83 | 3.54 | 8.26 | 11.35 | 5.93 | 10 | |
| College | Male | 10 | 67.54 | 15.88 | 2.91 | 8.36 | 12.09 | 1.76 | 1 | |
| College | Male | 20 | 70.91 | 17.95 | 4.20 | 4.82 | 11.48 | 5.16 | 3 | |
| College | Male | 30 | 80.10 | 18.80 | 4.57 | −8.00 | 14.77 | 18.90 | 4 | |
| College | Female | 0 | 71.59 | 16.61 | 4.64 | 7.11 | 18.82 | 6.11 | 4 | |
| College | Female | 10 | 79.96 | 13.12 | 3.01 | −5.26 | 11.26 | 9.33 | 9 | |
| College | Female | 20 | 71.73 | 18.80 | 2.76 | 8.25 | 13.87 | 23.53 | 10 | |
| College | Female | 30 | 76.24 | 18.29 | 2.79 | −6.85 | 15.30 | 8.07 | 8 | |
| Working | Male | 0 | 82.75 | 17.06 | 4.70 | 4.65 | 16.74 | 24.13 | 8 | |
| Working | Male | 10 | 84.39 | 24.39 | 3.39 | −8.35 | 11.67 | 29.78 | 10 | |
| Working | Male | 20 | 70.85 | 11.19 | 3.72 | −2.14 | 12.02 | 28.58 | 9 | |
| Working | Male | 30 | 68.46 | 15.17 | 2.65 | −3.25 | 17.68 | 26.55 | 1 | |
| Working | Female | 0 | 65.88 | 18.50 | 3.50 | 9.30 | 10.38 | 12.05 | 10 | |
| Working | Female | 10 | 84.58 | 20.68 | 3.73 | 11.43 | 11.04 | 13.48 | 5 | |
| Working | Female | 20 | 67.16 | 17.60 | 2.71 | 14.24 | 10.39 | 22.61 | 8 | |
| Working | Female | 30 | 71.08 | 16.75 | 3.86 | −7.49 | 19.32 | 11.24 | 3 | |
| Others | Male | 0 | 76.48 | 10.41 | 3.16 | 7.76 | 16.78 | 10.60 | 3 | |
| Others | Male | 10 | 78.93 | 18.09 | 3.78 | −6.02 | 13.72 | 20.18 | 8 | |
| Others | Male | 20 | 66.25 | 12.69 | 2.81 | 12.87 | 11.40 | 16.13 | 8 | |
| Others | Male | 30 | 83.16 | 10.88 | 3.97 | 4.04 | 16.60 | 25.00 | 8 | |
| Others | Female | 0 | 65.59 | 15.71 | 3.52 | 2.13 | 16.69 | 11.09 | 4 | |
| Others | Female | 10 | 70.54 | 15.04 | 4.10 | −5.23 | 19.13 | 13.98 | 2 | |
| Others | Female | 20 | 79.12 | 15.90 | 3.18 | −9.92 | 17.20 | 25.01 | 7 | |
| Others | Female | 30 | 78.39 | 12.07 | 4.18 | 14.48 | 15.32 | 6.42 | 7 | |
| (b) | ||||||||||
| Facial Expression Detection | Ambient Temperature (°C) | Ambient Light (lux) | Age (years) | Distance Travelled (km) | Calories Consumed (kcal) | Internet Usage (MB) | Time Spent on Mobiles (minutes) | Tone of Communication | Typing Speed (WPM) | Scrolling Speed (scroll/min) |
| Positive | 22.81 | 383.23 | 15 | 2.64 | 2583.00 | 451.83 | 27.66 | Positive | 85.61 | 28.42 |
| Positive | 22.20 | 259.94 | 13 | 29.24 | 1849.16 | 1154.20 | 14.37 | Positive | 61.80 | 49.75 |
| Positive | 21.60 | 105.31 | 10 | 29.00 | 2712.60 | 1472.24 | 6.21 | Neutral | 91.30 | 25.46 |
| Negative | 21.13 | 172.89 | 13 | 10.04 | 2280.10 | 1817.55 | 16.65 | Positive | 89.84 | 28.53 |
| Positive | 24.08 | 495.23 | 11 | 24.83 | 2188.90 | 892.95 | 11.93 | Positive | 88.82 | 44.59 |
| Negative | 18.81 | 195.95 | 13 | 27.26 | 2609.51 | 1947.49 | 15.41 | Positive | 93.64 | 31.36 |
| Positive | 19.01 | 370.47 | 11 | 10.13 | 1505.73 | 1497.91 | 20.92 | Neutral | 79.58 | 10.76 |
| Negative | 24.93 | 186.21 | 16 | 7.17 | 1549.78 | 129.45 | 53.96 | Negative | 93.28 | 19.13 |
| Negative | 20.10 | 310.10 | 19 | 12.64 | 2007.13 | 459.62 | 17.34 | Positive | 79.49 | 37.46 |
| Positive | 22.76 | 448.77 | 20 | 4.38 | 1881.39 | 1113.66 | 56.99 | Neutral | 38.50 | 39.28 |
| Positive | 24.96 | 248.62 | 22 | 3.34 | 2909.35 | 704.15 | 5.76 | Negative | 70.54 | 45.82 |
| Negative | 20.46 | 178.08 | 22 | 4.61 | 2812.70 | 1100.19 | 35.03 | Positive | 93.70 | 47.46 |
| Negative | 18.48 | 455.44 | 23 | 13.00 | 1948.87 | 1211.85 | 24.67 | Neutral | 34.39 | 20.31 |
| Positive | 24.10 | 302.05 | 19 | 26.74 | 1705.96 | 1527.26 | 5.05 | Neutral | 43.64 | 21.30 |
| Negative | 23.77 | 476.51 | 18 | 15.94 | 2661.98 | 485.08 | 49.24 | Neutral | 81.45 | 13.72 |
| Positive | 23.25 | 179.28 | 22 | 16.64 | 2953.22 | 1368.30 | 53.91 | Negative | 43.62 | 37.45 |
| Positive | 20.68 | 426.34 | 35 | 25.53 | 1673.28 | 651.96 | 10.28 | Neutral | 78.96 | 35.13 |
| Positive | 20.31 | 202.80 | 29 | 20.83 | 2688.07 | 1353.44 | 32.67 | Neutral | 52.78 | 14.44 |
| Negative | 19.40 | 179.46 | 23 | 3.03 | 2516.42 | 287.18 | 30.09 | Negative | 60.59 | 34.31 |
| Positive | 21.76 | 449.43 | 25 | 20.45 | 2771.03 | 1165.25 | 27.56 | Negative | 44.55 | 28.56 |
| Positive | 20.33 | 151.53 | 40 | 20.63 | 2512.57 | 518.61 | 47.54 | Neutral | 95.31 | 16.22 |
| Positive | 24.11 | 304.32 | 39 | 28.54 | 2009.29 | 848.82 | 44.96 | Negative | 86.40 | 36.89 |
| Negative | 21.78 | 390.78 | 37 | 9.15 | 2865.33 | 1237.16 | 24.86 | Positive | 97.11 | 11.03 |
| Negative | 21.24 | 184.23 | 55 | 2.61 | 1926.81 | 810.80 | 35.02 | Neutral | 96.80 | 28.00 |
| Negative | 19.89 | 284.51 | 61 | 10.88 | 2932.00 | 717.78 | 8.41 | Neutral | 48.34 | 41.58 |
| Positive | 24.53 | 220.16 | 61 | 11.17 | 1862.20 | 1302.16 | 52.19 | Negative | 31.93 | 22.35 |
| Negative | 22.35 | 139.62 | 65 | 24.32 | 2305.51 | 1684.61 | 22.25 | Negative | 51.91 | 40.62 |
| Positive | 19.75 | 393.69 | 65 | 19.18 | 2330.19 | 425.11 | 15.76 | Negative | 79.94 | 47.79 |
| Positive | 25.08 | 492.42 | 67 | 16.85 | 2012.55 | 1783.90 | 40.84 | Negative | 92.26 | 40.62 |
| Negative | 24.12 | 106.54 | 68 | 14.62 | 1614.91 | 1336.59 | 28.32 | Neutral | 82.62 | 25.66 |
| Positive | 22.51 | 191.07 | 62 | 14.07 | 1618.14 | 373.90 | 17.54 | Negative | 30.32 | 38.43 |
| Negative | 22.10 | 313.26 | 67 | 2.43 | 1704.58 | 1876.30 | 8.85 | Negative | 58.54 | 33.18 |
| Metric | Baseline (Pre Intervention) | Post Intervention | Improvement (%) | p-Value |
|---|---|---|---|---|
| Average Heart Rate | 75 bpm | 70 bpm | 6.67% | <0.05 |
| Eye Blink Rate | 15 blinks/min | 18 blinks/min | 20% | <0.01 |
| Posture Score | 65 (out of 100) | 75 (out of 100) | 15.38% | <0.05 |
| Self-Reported Stress Level | 6 (on a scale of 1–10) | 4 (on a scale of 1–10) | 33.33% | <0.01 |
| Statement | Strongly Agree | Agree | Neutral | Disagree | Strongly Disagree |
|---|---|---|---|---|---|
| The system helped me take regular breaks. | 0.7 | 0.25 | 0.05 | 0 | 0 |
| The system improved my posture. | 0.6 | 0.3 | 0.1 | 0 | 0 |
| The system reduced my eye strain. | 0.65 | 0.25 | 0.1 | 0 | 0 |
| I recommend this system to others. | 0.8 | 0.15 | 0.05 | 0 | 0 |
Disclaimer/Publisher’s Note: The statements, opinions and data contained in all publications are solely those of the individual author(s) and contributor(s) and not of MDPI and/or the editor(s). MDPI and/or the editor(s) disclaim responsibility for any injury to people or property resulting from any ideas, methods, instructions or products referred to in the content. |
© 2024 by the authors. Licensee MDPI, Basel, Switzerland. This article is an open access article distributed under the terms and conditions of the Creative Commons Attribution (CC BY) license (https://creativecommons.org/licenses/by/4.0/).
Share and Cite
Vijayalakshmi, S.; Alwin, J.; Lekha, J. IoT-Enabled Intelligent Health Care Screen System for Long-Time Screen Users. Eng. Proc. 2024, 82, 96. https://doi.org/10.3390/ecsa-11-20364
Vijayalakshmi S, Alwin J, Lekha J. IoT-Enabled Intelligent Health Care Screen System for Long-Time Screen Users. Engineering Proceedings. 2024; 82(1):96. https://doi.org/10.3390/ecsa-11-20364
Chicago/Turabian StyleVijayalakshmi, Subramanian, Joseph Alwin, and Jayabal Lekha. 2024. "IoT-Enabled Intelligent Health Care Screen System for Long-Time Screen Users" Engineering Proceedings 82, no. 1: 96. https://doi.org/10.3390/ecsa-11-20364
APA StyleVijayalakshmi, S., Alwin, J., & Lekha, J. (2024). IoT-Enabled Intelligent Health Care Screen System for Long-Time Screen Users. Engineering Proceedings, 82(1), 96. https://doi.org/10.3390/ecsa-11-20364