Proceeding Paper

Development and Prototyping of Oxygen Analyzer †

Department of Biomedical Engineering, Vel Tech Rangarajan Dr. Sagunthala R&D Institute of Science and Technology, Chennai 600062, India
*
Author to whom correspondence should be addressed.
Presented at The 11th International Electronic Conference on Sensors and Applications (ECSA-11), 26–28 November 2024; Available online: https://sciforum.net/event/ecsa-11.
Eng. Proc. 2024, 82(1), 82; https://doi.org/10.3390/ecsa-11-20447
Published: 25 November 2024

Abstract

In the context of developing countries, medical instruments are imported from foreign countries. To overcome this challenge, herein the design of an oxygen analyzer using ultrasonic flow sensor technology and a microcontroller while promoting local innovation and reducing dependency on imported equipment is presented. Moreover, this design aims to enhance patient care by ensuring accurate oxygen concentration and flow rate measurements on ventilators and oxygen concentrators. The data measured using the proposed system have been validated by comparison with data obtained using standard oxygen analyzer equipment like the VT-900 Gas Flow Analyzer from Fluke Biomedical and the Ultra Max oxygen analyzer. Measurements were conducted on hospital ventilators, with oxygen concentration (FiO2) being set to range from 21% to 100%, with increments of 5%, and the flow rate was set to range from 1 L/m to 10 L/m. The results show an error value of 2.1% for oxygen concentration measurements and a value of 0.6 L/m for flow rate measurements. Based on our analysis, it can be concluded that the proposed system works well. Additionally, it offers portability, affordability, and user-friendliness, overcoming the limitations of existing options. This project seeks to contribute to the healthcare infrastructure in developing countries like Nepal, India, Bangladesh, etc., by providing a domestically produced solution for oxygen analysis.

1. Introduction

An oxygen analyzer is a device that measures the oxygen concentration in the ambient air, and such analyzers can come in the form of oxygen cylinders, oxygen concentrators, medical ventilators, incubators, etc. [1,2]. An oxygen analyzer reads oxygen concentration in percentages. Also, this vital device is used in various fields, including medical, industrial, and environmental applications, to measure oxygen concentration in gasses accurately. This instrument ensures safety, quality control, and process optimization in diverse industries [3]. In medical settings, oxygen analyzers are indispensable for monitoring and controlling the oxygen levels in respiratory gasses delivered to patients during anesthesia, mechanical ventilation, and respiratory therapy. They help healthcare professionals ensure that patients receive the appropriate amount of oxygen, critical for maintaining physiological function and preventing hypoxia-related complications [4,5]. In industrial processes, oxygen analyzers are employed to monitor and control oxygen concentrations in manufacturing environments, with applications such as pharmaceutical production, food and beverage processing, and chemical synthesis. These analyzers aid in maintaining optimal conditions for chemical reactions, enhancing product quality, and ensuring workplace safety. Furthermore, oxygen analyzers are crucial in environmental monitoring applications, including air quality assessment, combustion control, and environmental research. By accurately measuring oxygen levels in ambient air and emissions, these instruments facilitate compliance with environmental regulations, the identification of pollution sources, and the mitigation of environmental impacts [6]. Traditionally, oxygen analyzers have relied on electrochemical, paramagnetic, or zirconia-based sensors for oxygen detection. However, advancements in sensor technology, microcontrollers, and display systems have enabled the development of more compact, cost-effective, and user-friendly oxygen analyzers. This project aims to design and develop an oxygen analyzer utilizing innovative components, including the NL-PD10NF40 Oxygen Concentration Sensor, Arduino Nano microcontrollers, and OLED displays. By leveraging these technologies, the project seeks to create a portable, low-cost, and user-friendly oxygen analyzer tailored to healthcare facilities, research laboratories, and industrial operations in developing countries. The introduction of a domestically produced oxygen analyzer holds significant potential for improving healthcare infrastructure, promoting local innovation, and reducing dependency on imported equipment. Through rigorous testing, calibration, and optimization processes, this project endeavors to deliver a reliable and efficient oxygen analysis solution that addresses specific challenges and requirements.

2. Methodology

2.1. Data Acquisition

Parameters such as concentration, flow rate, temperature, pressure, and volume were taken from the ventilator and the oxygen concentrator. Measurements were made 16 times. After that, measurements were made using comparison devices, namely the Ultra-max O2 Oxygen Analyzer and Fluke Biomedical’s VT-900A Gas Flow Analyzer [7].

2.2. Components and Tools

The tools we used included the NL-PD10NF40 sensor (Manufactured by Manorshi Electronics Co., Ltd., Changzhou, China), a sensor that can read the output oxygen concentration, oxygen flow rate, and temperature. An Arduino Nano microcontroller connected to the NLPD10NF40 sensor was used to read the output from the oxygen concentrator and then display it on a 0.98-inch OLED display.

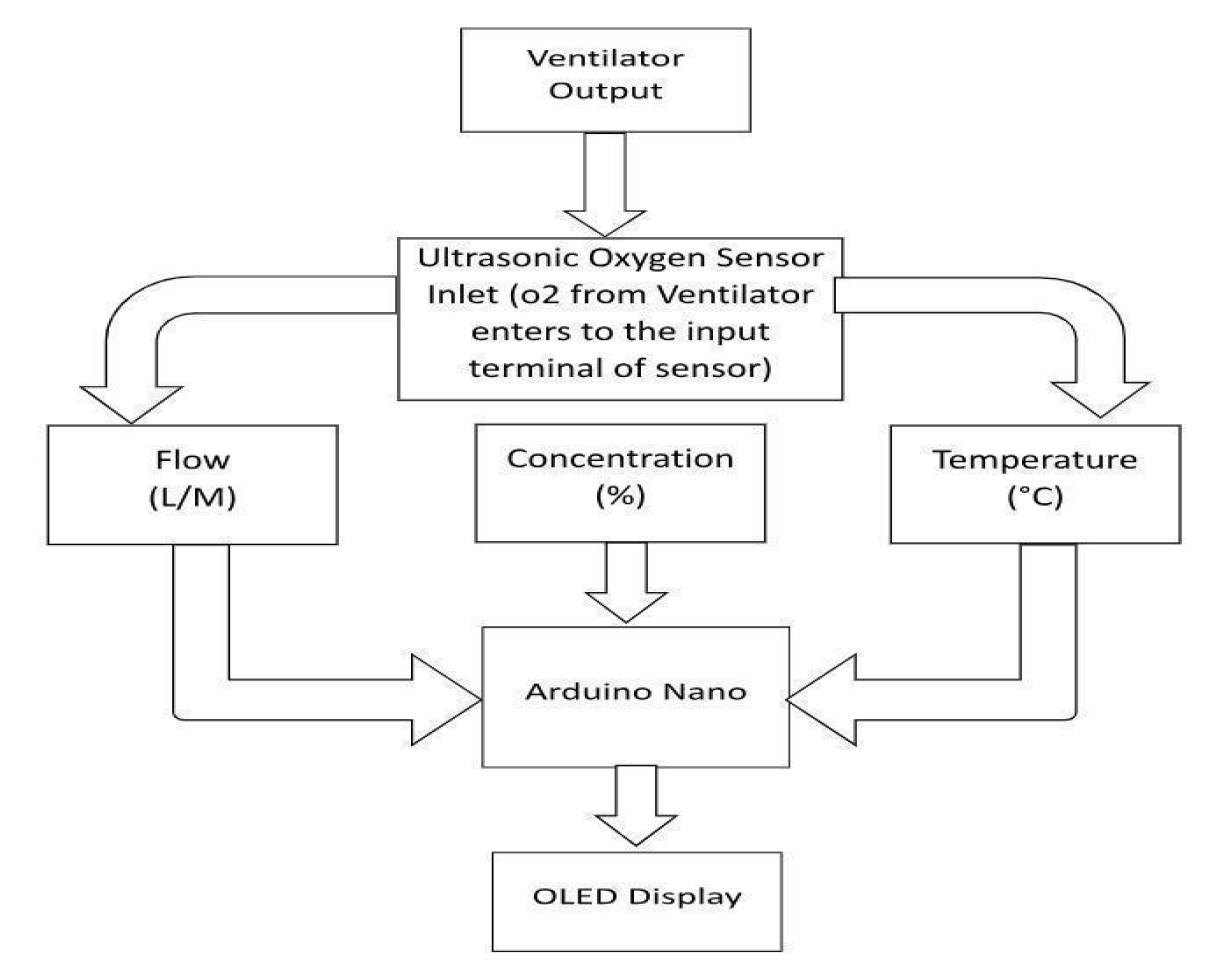
2.3. Block and Flow Diagram

Working Principle

At first, the ventilator input side is connected to the wall mount socket from which the oxygen comes. After that, the ventilator output terminal is connected to the sensor input terminal. The sensor is then connected to the Arduino. When the oxygen is passed through the sensor. The sensor sends the parameters i.e. concentration Flow and temperature to the Arduino. After that, the OLED display will show the output as shown in Figure 1. When the ”ON” button is pressed, the voltage from the battery is then sent to Arduino Nano VCC where the positive terminal is connected and the negative terminal is connected to the GND pin after that the sensor detects concentration, flow rate, and temperature from the ventilator and concentrator output, the output of the sensor is divided into namely concentration, flow rate, and temperature. The sensor Rx pin is connected to the Arduino TX pin and the sensor TX pin is connected to the Arduino Nano Rx pin for serial communication. The sensor follows the USART protocol for communication as shown in Figure 2.

2.4. Design

The material selected for our 3D printing work was polylactic acid (PLA), a biodegradable polyester known for its environmental sustainability and versatility. PLA is derived from renewable resources like cornstarch or sugarcane, making it an eco-friendly choice. Furthermore, PLA is compatible with a wide range of 3D printers, facilitating smooth printing processes and ensuring high-quality results.

3. Result and Analysis

Three oxygen analyzers were used to gather data: the VT−900 Gas Flow Analyzer from Fluke Biomedical, the Ultramax Oxygen Analyzer, and our project’s oxygen analyzer. The results are shown below in Table 1 and Table 2.
The ventilator was set to concentrations of 21% to 100%, with increments of 5%. After each concentration was set, the three devices were used to measure the actual percentage at each setting, and the readings were recorded in an Excel sheet. The VT 900 Gas Flow Analyzer was used first, followed by our project’s analyzer and, finally, the Ultramax Oxygen Analyzer. After recording the data, absolute errors between the standard ventilator values and the readings of the VT 900 Gas Flow Analyzer, this project’s analyzer, and the Ultramax Oxygen Analyzer were calculated. The mean absolute errors for each dataset were then computed. To analyze the accuracy of each analyzer, the data collected from each concentration setting were compared to the standard value and plotted. The slope of the line between the measured and standard values was calculated to assess the accuracy. These data show that the largest error value of approximately 0.9 L/m was achieved at a setting point of 1 L/m, and the smallest error value of 0.2 L/m was achieved at a setting point of 8 L/m.
Based on these data, the largest error value is approximately 5 percent at setting points of 40 and 100 percent, and the smallest error value is 0.3 percent at a setting point of 70 percent. Similarly, for the flow rate measurement, the oxygen concentrator was set to range from 0 L/m up to 10 L/m. All three devices were used to measure the flow rate from the concentrator one after another in each set point. All the data that were obtained were recorded. The VT 900 Gas Flow Analyzer was used first, followed by our project’s analyzer and, finally, the Ultramax Oxygen Analyzer.

4. Discussion

Our testing protocol involved assessing oxygen levels ranging from 21% to 100%, with increments of 5%, and flow rate settings ranging from 1 L/m to 10 L/m. These error values provide insights into the consistency and variability of our measurements across different settings. Throughout our testing, we observed variations in the error values across different oxygen concentration and flow rate settings. These variations highlight the inherent challenges and complexities associated with accurately measuring oxygen levels and flow rates in a clinical setting. One notable finding from our analysis is the standard deviation values obtained for oxygen concentration and flow rate measurements. Despite the variability observed in our measurements, the standard deviation values suggest a reasonable degree of consistency in our data (Figure 3). This includes ensuring that our measurement system is capable of accurately capturing oxygen levels up to 95.6% and optimizing the flow rate measurement capabilities to minimize errors.

5. Conclusions

By creating a convenient, cost-effective gadget for measuring oxygen concentration, this study could help to improve the openness and reasonableness of oxygen examination on a national scale, in addition to facilitating consistent, quality oxygen examination innovations. Through a precise approach that includes planning, prototyping, testing, and approval steps, the proposed analyzer has effectively illustrated the adequacy of locally sourced and locally made devices in meeting the particular healthcare needs of developing countries. In addition to testing and recovering estimation information and employing a ventilator for comparison, our testing procedure included assessing oxygen levels ranging from 21 percent to 100 percent, with the rate of increase being 5 percent, and stream rate settings ranging from 1 L/m to 10 L/m.

Author Contributions

Conceptualization, B.P., S.D. and D.K.S.; methodology, S.D. and D.K.S.; software, B.P.; validation, B.P., S.D. and D.K.S.; formal analysis, S.D.; investigation, D.K.S.; resources, S.D.; data curation, D.K.S.; writing—original draft preparation, B.P.; writing—review and editing, D.B.T., S.D. and D.K.S.; visualization, B.P.; supervision, D.B.T.; project administration, S.D. and D.K.S.; funding acquisition, S.D. All authors have read and agreed to the published version of the manuscript.

Funding

This research was funded by the National Innovation Centre, located in Nepal which is a nonprofit organization established on 9 November 2012 by Mahabir Pun. The total fund granted by the National Innovation Centre is 50 USD. And no APC funding was received.

Institutional Review Board Statement

Not applicable.

Informed Consent Statement

Not applicable.

Data Availability Statement

Not applicable.

Conflicts of Interest

The authors declare no conflict of interest.

References

  1. Kshetry, R.L.; Gupta, A.; Chattopadhyaya, S.; Srivastava, M.; Sharma, S.; Singh, J.; Gupta, A.D.; Rajkumar, S. Design and Analysis of a Low-Cost Electronically Controlled Mobile Ventilator, Incorporating Mechanized AMBU Bag, for Patients during COVID-19 Pandemic. J. Healthc. Eng. 2022, 2022, 6436818. [Google Scholar] [CrossRef] [PubMed]
  2. Soares, G.F.; Almeida, O.M.; Menezes, J.W.; Kozlov, S.S.; Rodrigues, J.J. Air–oxygen blenders for mechanical ventilators: A literature review. Sensors 2022, 22, 2182. [Google Scholar] [CrossRef] [PubMed]
  3. Willett, M. Oxygen sensing for industrial safety—Evolution and new approaches. Sensors 2014, 14, 6084–6103. [Google Scholar] [CrossRef] [PubMed]
  4. Hedenstierna, G.; Tokics, L.; Scaramuzzo, G.; Rothen, H.U.; Edmark, L.; Öhrvik, J. Oxygenation impairment during anesthesia: Influence of age and body weight. Anesthesiology 2019, 131, 46–57. [Google Scholar] [CrossRef] [PubMed]
  5. Suzuki, S.; Mihara, Y.; Hikasa, Y.; Okahara, S.; Ishihara, T.; Shintani, A.; Morimatsu, H. Current ventilator and oxygen management during general anesthesia: A multicenter, cross-sectional observational study. Anesthesiology 2018, 129, 67–76. [Google Scholar] [CrossRef] [PubMed]
  6. Shuk, P.; Jantz, R. Oxygen gas sensing technologies: A comprehensive review. In Proceedings of the 2015 9th International Conference on Sensing Technology (ICST), Auckland, New Zealand, 8–10 December 2015. [Google Scholar]
  7. Fluke Biomedical. Available online: https://www.flukebiomedical.com (accessed on 29 January 2024).
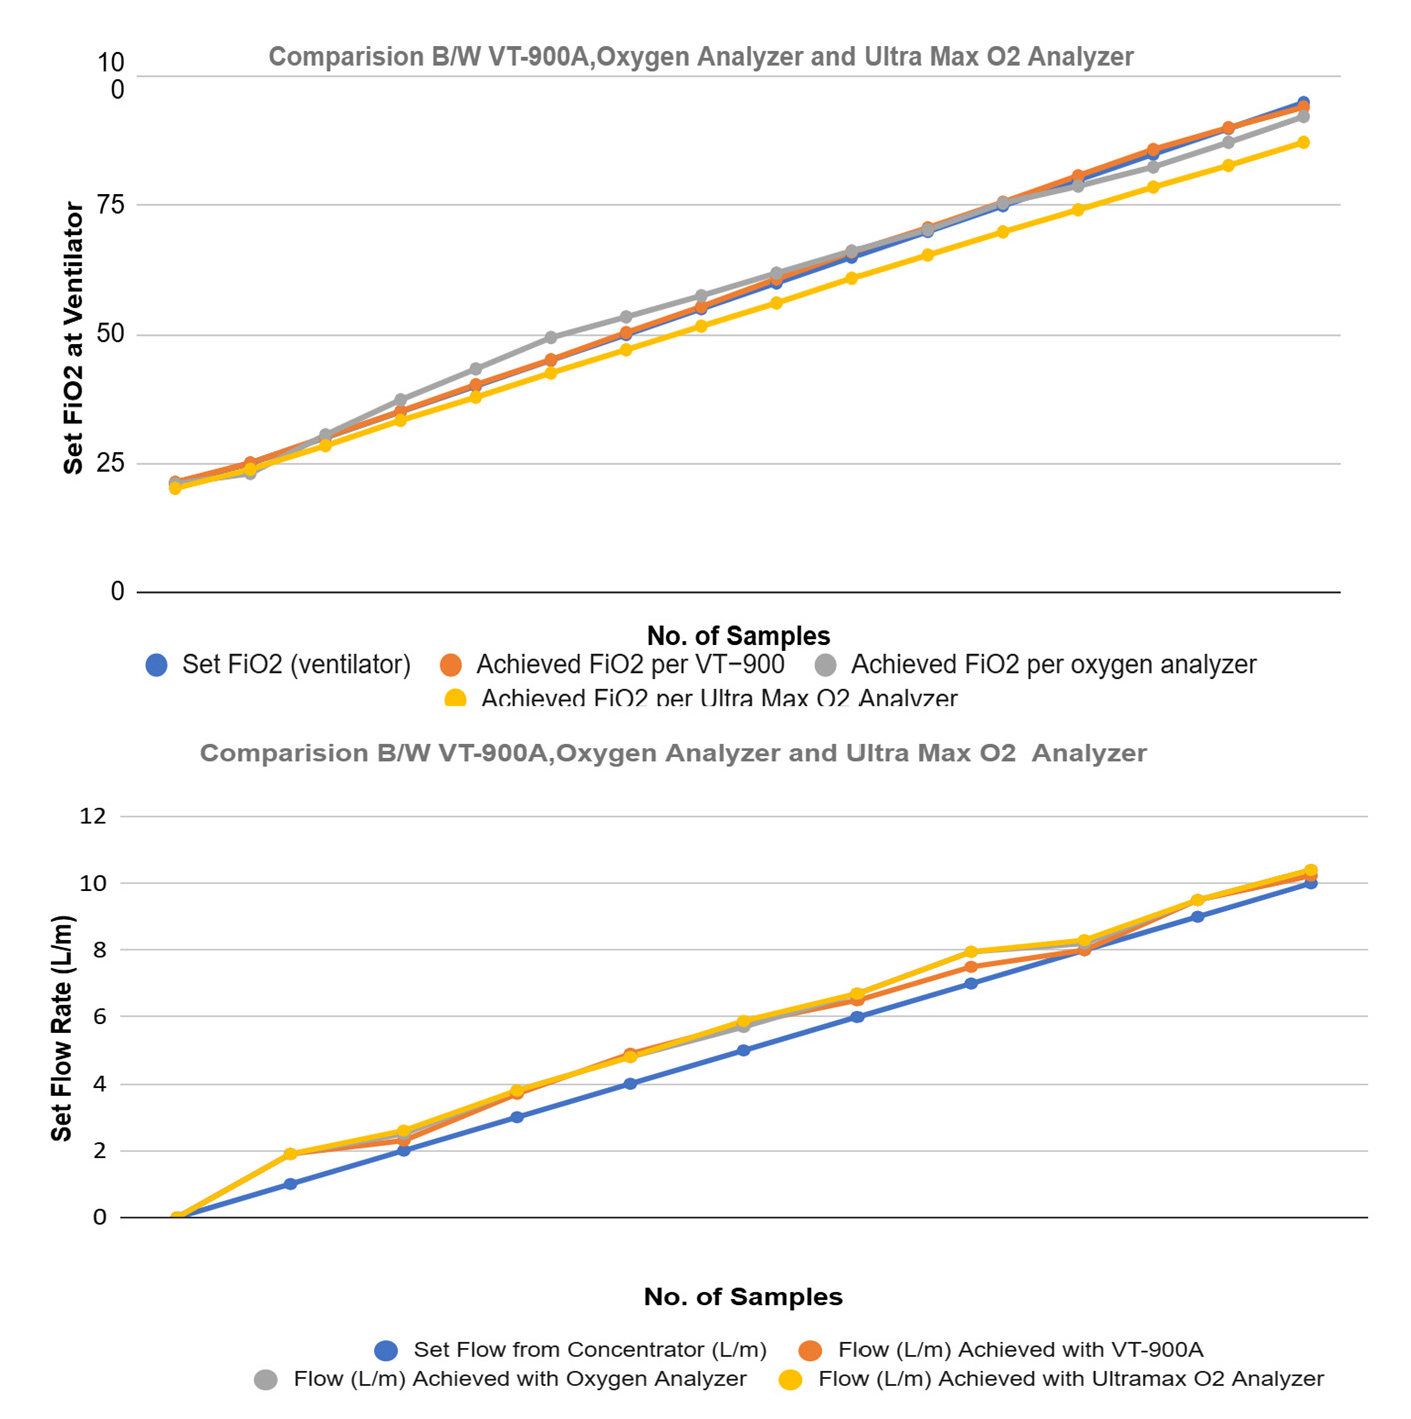
Figure 1. Flow diagram of oxygen analyzer.
Engproc 82 00082 g001
Figure 2. Block diagram of oxygen analyzer.
Engproc 82 00082 g002
Figure 3. (Top) FiO2 and (Bottom) oxygen flow rate comparison between VT−900 Oxygen Analyzer, UltraMax Oxygen Analyzer, and our developed oxygen analyzer.
Engproc 82 00082 g003
Table 1. Measurement of oxygen concentration.
Set FiO2 (Ventilator)Achieved FiO2 Per VT−900Error (VT−900)Achieved FiO2 Per Oxygen AnalyzerError (Oxygen Analyzer)Achieved FiO2 per Ultra Max O2 AnalyzerError (Ultra Max O2 Analyzer)
2121.290.2921020.10.9
2525.040.0423223.81.2
3030.0750.07530.50.528.41.6
3535.060.0637.32.333.31.7
4040.230.2343.33.337.812.19
4545.0750.07549.44.442.52.5
5050.350.3553.43.4473
5555.3750.37557.52.551.63.4
6060.770.7761.91.956.13.9
6566.0251.02566.21.260.94.1
7070.690.6970.30.365.424.58
7575.670.6775.50.569.95.1
8080.80.878.81.274.25.8
8585.90.982.52.578.616.39
9090.140.1487.32.782.87.2
9594.140.8692.322.6887.37.7
10099.450.5595.64.491.458.55
Error 0.46470588 2.10470588 4.10647058
Table 2. Oxygen flow rate measurement.
Set Flow from Concentrator (L/m)Flow (L/m) Achieved with VT-900AError with VT−900AFlow (L/m) Achieved with Oxygen AnalyzerError with Oxygen AnalyzerFlow (L/m) Achieved with Ultramax O2 AnalyzerError with Ultra Max O2 Analyzer
0000000
11.90.91.90.91.90.9
22.30.32.50.52.60.6
33.70.73.80.83.80.8
44.90.94.80.84.80.8
55.80.85.70.75.880.88
66.50.56.70.76.70.7
77.50.57.950.957.950.95
8808.20.28.30.3
99.50.59.50.59.50.5
1010.230.2310.40.410.40.4
Error 0.4845454 0.586363 0.62090909
Disclaimer/Publisher’s Note: The statements, opinions and data contained in all publications are solely those of the individual author(s) and contributor(s) and not of MDPI and/or the editor(s). MDPI and/or the editor(s) disclaim responsibility for any injury to people or property resulting from any ideas, methods, instructions or products referred to in the content.

