1. Introduction
Fourier transform infrared spectroscopy (FT-IR) is nowadays considered a powerful tool for bacteria identification and typing [
1,
2]. In addition, FT-IR spectroscopy does not require a specific consumable or reagent and also allows for the study of the interaction between bacteria and external agents in a rapid way [
1,
2]. One of the advantages offered by FT-IR is the possibility to investigate the samples using different geometries and growing substrates when collecting spectra, which can further simplify the measurement procedures.
In the present investigation, different spectra acquisition modes were investigated using various supports to grow bacterial biofilms. The advantages and disadvantages of the different approaches are discussed with particular attention paid to the measurable spectral range and the reproducibility in the spectra acquisition.
As far as the choice of bacterium we used in this study, we selected
Pseudomonas aeruginosa since it represents a class of bacteria largely investigated since it is now considered to be a primary infectious agent, especially for its ability to form multi-resistant biofilms [
3,
4].
2. Materials and Methods
2.1. Biofilm Formation
For the biofilm assay, the strain of Pseudomonas aeruginosa ATCC® 9027™ was grown overnight in Tryptone Soy Broth (TSB-Oxoid) at 37 °C. The overnight culture was then diluted at a concentration of 107 CFUs/mL, placed on sterilized CaF2 disks, MirrIR slides and Teflon membranes and incubated overnight at 37 °C in aerobic conditions. After incubation, the biofilm formed was washed with Phosphate-Buffered Saline (PBS, Oxoid) and fixed with a 4% formalin solution.
2.2. FT-IR Measurements
The instrument that was used for the acquisition of the IR absorption spectra from Pseudomonas aeruginosa biofilms was a Spectrum One FTIR (PerkinElmer, Shelton, CT, USA) spectrometer, equipped with a Perkin Elmer Multiscope system infrared microscope and an MCT (mercury cadmium telluride) detector.
The microscope stage used for the characterization of bacterial biofilms on the CaF2 disk (a transparent IR material) was the transmission mode and for the biofilms adherent on the MirrIR slides (IR reflective microscope slides produced by Kevley Technologies, Chesterland, OH, USA) the transflection mode was used. The background signal was acquired in a region of the support that was free of bacterial biofilm.
The spectra of Pseudomonas aeruginosa biofilms on Teflon membranes (TF-450, Gelman Instrument Company, Washington, DC, USA) were acquired using Attenuated Total Reflectance (ATR) geometry; the membrane was placed on the top of the diamond crystal of the Universal ATR (UATR) accessory of the above-mentioned FT-IR spectrometer. In this case, the background signal was acquired with the diamond crystal surface exposed to air.
The measurements were made at room temperature by collecting the signal in the spectral region between 4000 and 650 cm−1 using 64 scans with a spectral resolution of 4 cm−1 and a 5 s acquisition time for each spectrum. The biofilms were examined in different regions of about 100 × 100 μm2 size, for biofilms on CaF2 and MirrIR a support and three spectra were acquired for each position.
To evaluate spectra reproducibility, the correlation coefficients among the spectra acquired in analogous experimental conditions were estimated.
3. Results and Discussion
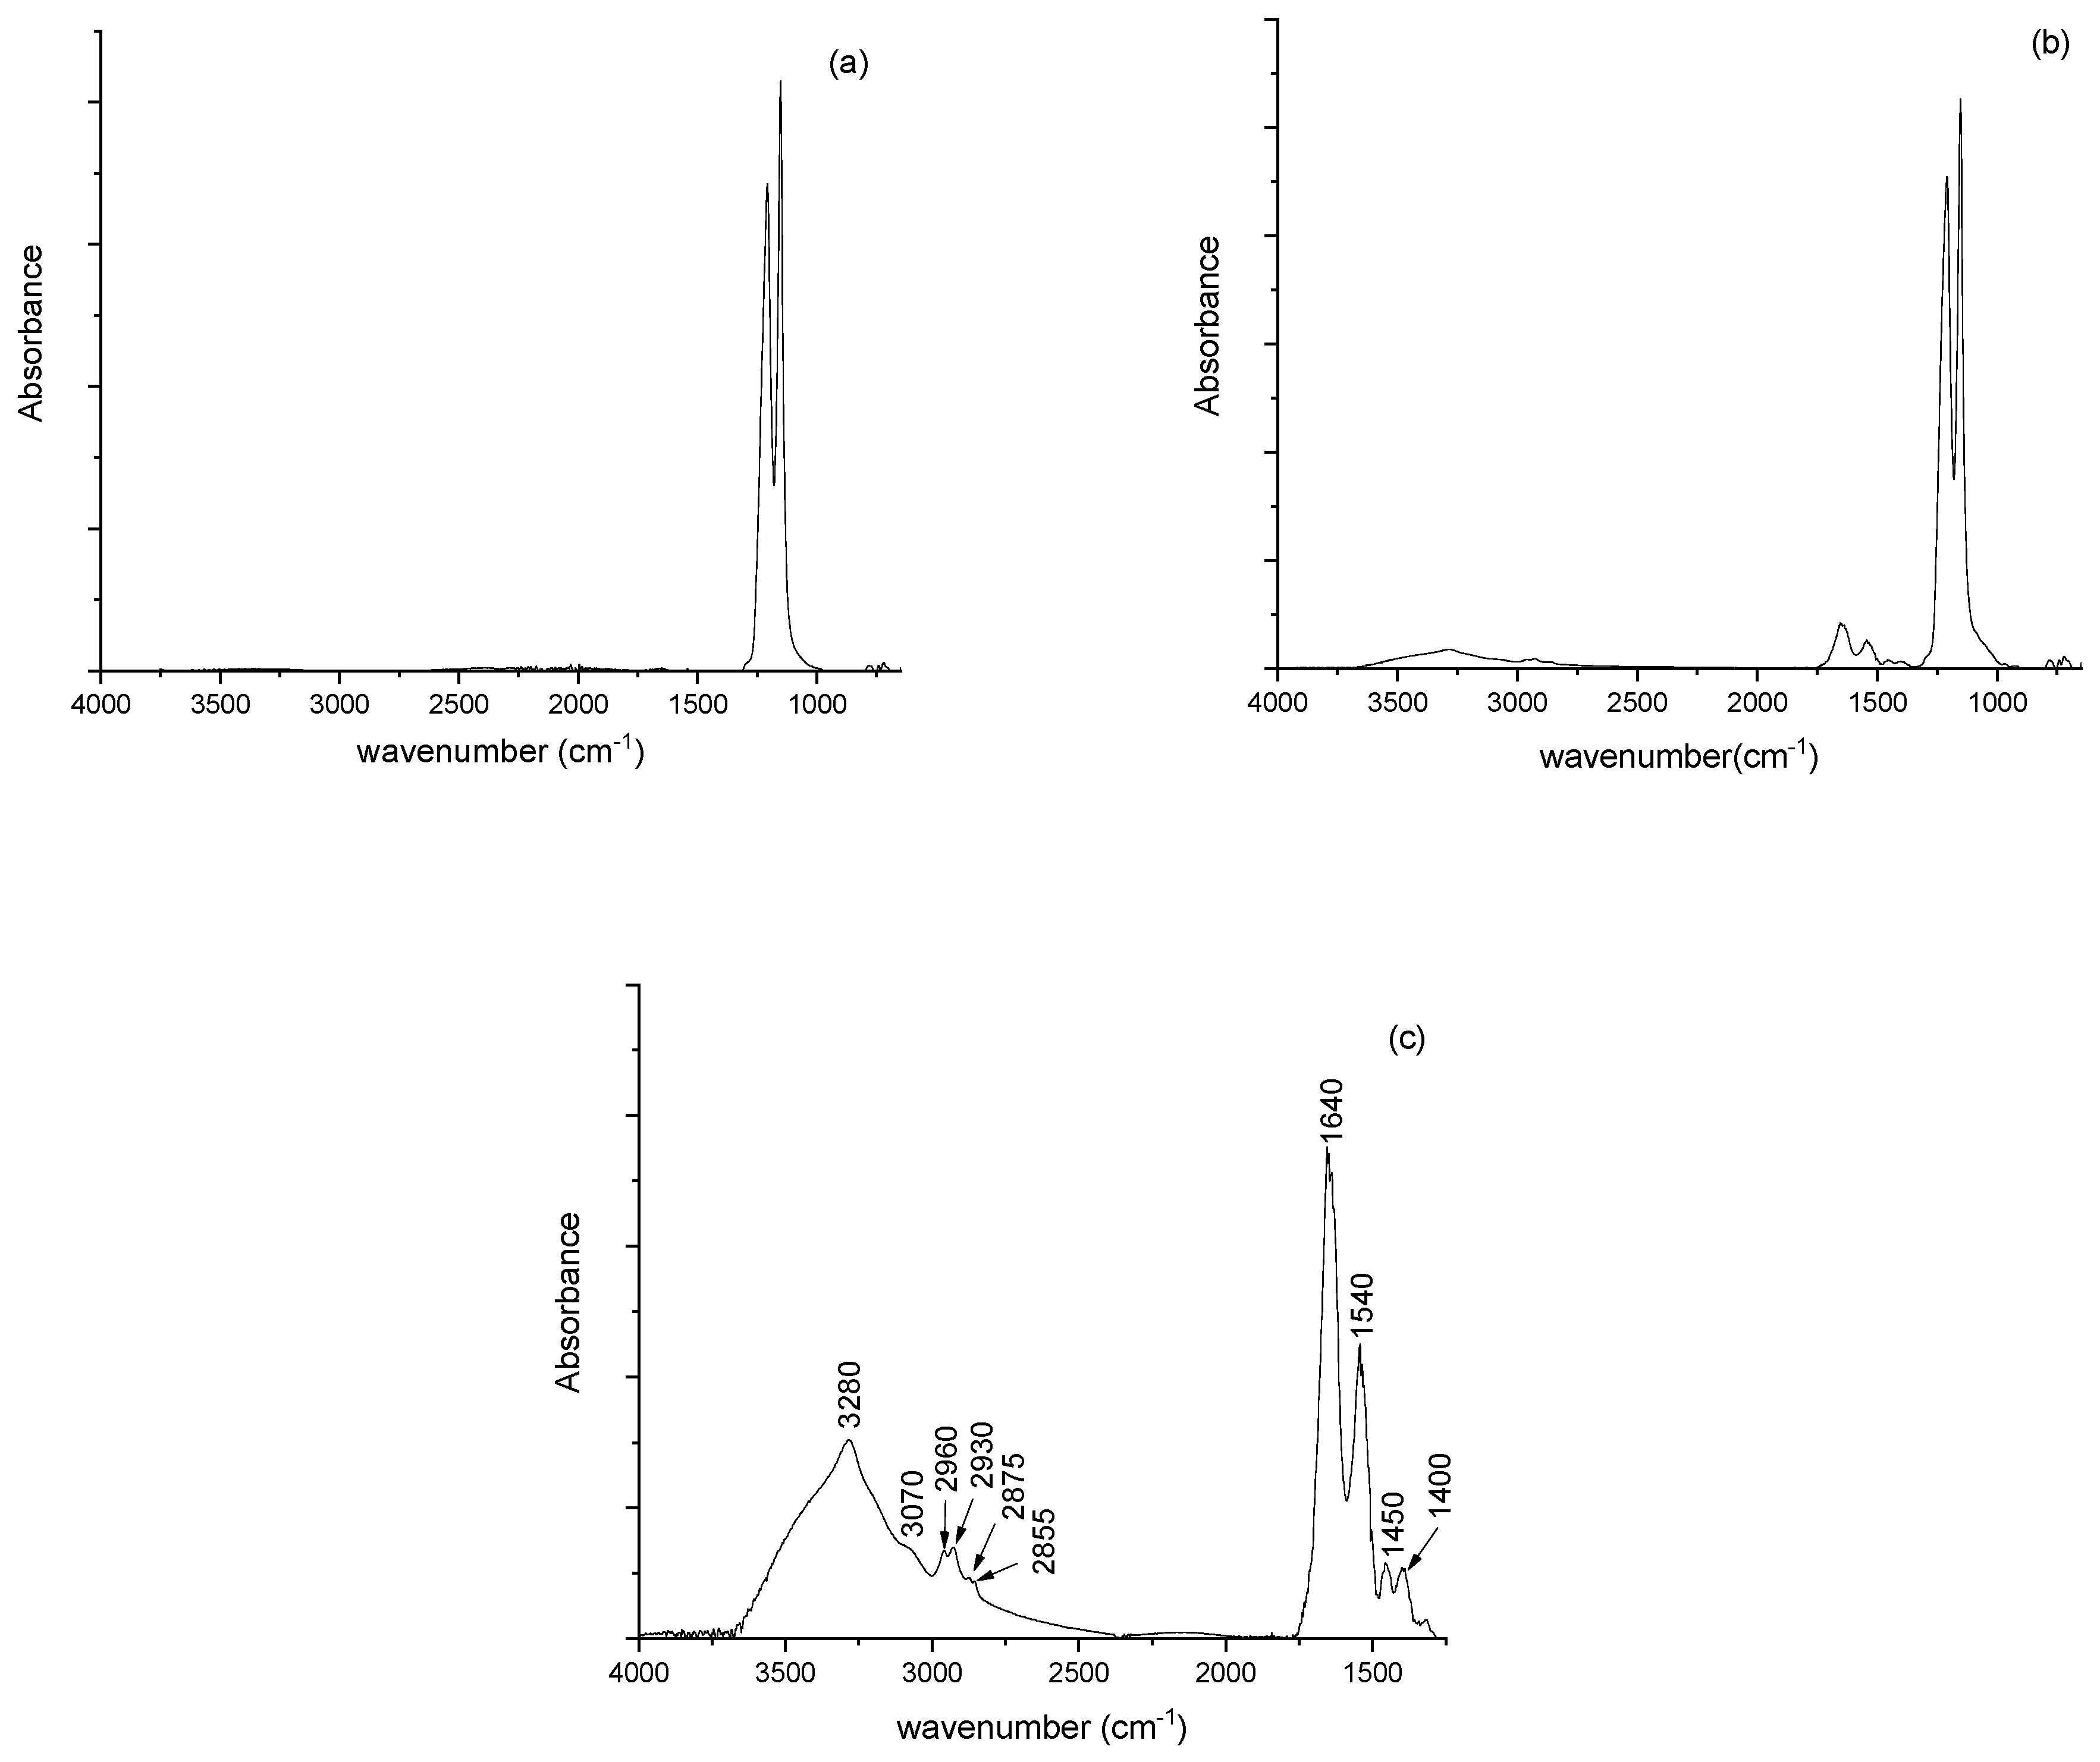
The spectra of
P. aeruginosa biofilms grown on Teflon membrane are reported in
Figure 1. In the spectrum related to the free Teflon membrane of
Figure 1a, two peaks located at 1210, and 1150 cm
−1 due to CF
2 stretching modes are evident and are considered a fingerprint of Teflon. In
Figure 1b, the spectrum of bacterial biofilm on the membrane is reported. To eliminate the contribution of the free Teflon membrane, the difference spectrum between this spectrum and that related to the free Teflon membrane is shown in
Figure 1c. In the graph, the most important peaks due to biological structures are evident and in
Table 1 the positions of the main contributions are reported together with their assignments.
The peaks reported in
Table 1 are also present in
Figure 2 and
Figure 3, collected from biofilms grown on CaF
2 and MirrIR, respectively. The peaks are in similar positions with comparable intensities, also for the spectra in
Figure 2 and
Figure 3.
The different acquisition modes allow a nonidentical infrared range of the spectrum and dissimilarities in the spectra reproducibility.
In the transflection mode using MirrIR supports, it is possible to obtain significative spectra in the 4000 to 650 cm−1 spectral range, allowing the study of contributions from all the components of bacteria (lipids, proteins, DNA, and polysaccharides) in FT-IR spectra. For UATR acquisition geometry, the presence of Teflon peaks does not permit there to be valuable information for a wavenumber smaller than 1300 cm−1. For this reason, this approach does not enable the evaluation of the contribution from DNA and polysaccharides, while the presence of lipids and proteins can be investigated without a problem. For transmittance collection geometry, it is possible to study the spectral region up to 1000 cm−1 due to the transmittance properties of CaF2 in the infrared region. Also, for this approach, the same limitations present for a UATR approach using Teflon substrates are present.
The spectra reproducibility of the three different acquisition modes using the above-mentioned substrates has been also investigated. The evaluation of the correlation coefficients among the various spectra acquired repeatedly in transmittance and in UATR mode returned a correlation coefficient of R = 0.99. In the case of transflection acquisition, the correlation coefficient is R = 0.95. This analysis indicates that UATR geometry and transmittance are the most valuable approaches for characterizing bacterial biofilm. It is important to underline that the reproducibility of the spectra acquired is also affected by the uniformity of the bacterial film. Optical microscopy images of biofilm (not reported here) confirm that bacterial biofilms with different uniformity characteristics are obtained on the three different supports. In particular, the most uniform biofilms are obtained on CaF2 windows and on Teflon membranes, from which we have obtained the most reproducible spectra.
4. Conclusions
The above-reported considerations for the different spectral ranges available for the three supports and their spectra acquisition mode, together with the spectra reproducibility, indicate that different choices are available depending on the measurement aims. For example, when the study of biofilm is focalized on bacterial proteins (important peaks in the range 1700–1500 cm−1) the best choice in terms of speed of measurement and costs can be represented using UATR collection geometry with Teflon supports. Conversely, when the interest is focused on polysaccharides or nucleic acid bacterial components (range 1200–900 cm−1) the use of the MirrIR support in transflection mode is suggested.
Author Contributions
Conceptualization, M.L., M.P., G.D. and A.F.; methodology, M.L., M.P., G.D. and A.F.; investigation, M.L., M.P. and A.F.; data curation, M.P. and M.L.; writing—original draft preparation, M.P. and M.L.; writing—review and editing, M.L., M.P. and A.F. All authors have read and agreed to the published version of the manuscript.
Funding
This research received no external funding.
Institutional Review Board Statement
Not applicable.
Informed Consent Statement
Not applicable.
Data Availability Statement
Data availability statements are available on request.
Conflicts of Interest
The authors declare no conflicts of interest.
References
- Crisp, A.R.; Short, B.; Rowan, L.; Ramage, G.; Rehman, I.U.R.; Short, R.D.; Williams, C. Investigating the chemical pathway to the formation of a single biofilm using infrared spectroscopy. Biofilm 2023, 6, 100141. [Google Scholar] [CrossRef]
- Alvarez-Ordonez, A.; Mouwen, D.J.M.; Lopez, M.; Prieto, M. Fourier transform infrared spectroscopy as a tool to characterize molecular composition and stress response in foodborne pathogenic bacteria. J. Microbiol. Methods 2011, 84, 369–378. [Google Scholar] [CrossRef]
- Pang, Z.; Raudonis, R.; Glick, B.R.; Lin, T.; Cheng, Z. Antibiotic resistance in Pseudomonas aeruginosa: Mechanisms and alternative therapeutic strategies. Biotechnol. Adv. 2019, 37, 177–192. [Google Scholar] [CrossRef] [PubMed]
- Thi, M.T.T.; Wibowo, D.; Rehm, B.H.A. Pseudomonas aeruginosa Biofilms. Int. J. Mol. Sci. 2020, 21, 8671. [Google Scholar] [CrossRef] [PubMed]
- Cheung, H.Y.; Chan, G.K.; Cheung, S.H.; Sun, S.Q.; Fong, W.F. Morphological and chemical changes in the attached cells of Pseudomonas aeruginosa as primary biofilms develop on aluminium and CaF2 plates. J. Appl. Microbiol. 2007, 102, 701–710. [Google Scholar] [CrossRef] [PubMed]
| Disclaimer/Publisher’s Note: The statements, opinions and data contained in all publications are solely those of the individual author(s) and contributor(s) and not of MDPI and/or the editor(s). MDPI and/or the editor(s) disclaim responsibility for any injury to people or property resulting from any ideas, methods, instructions or products referred to in the content. |
© 2024 by the authors. Licensee MDPI, Basel, Switzerland. This article is an open access article distributed under the terms and conditions of the Creative Commons Attribution (CC BY) license (https://creativecommons.org/licenses/by/4.0/).


