Abstract
This paper describes the development of a Human Activity Recognition (HAR) system based on deep learning for classifying full-body activities using inertial signals. The HAR system is divided into several modules: a preprocessing module for extracting relevant features from the inertial signals window-by-window, a machine learning algorithm for classifying the windows and a post-processing module for integrating the information along several windows. Regarding the preprocessing module, several transformations are implemented and evaluated. For the ML module, several algorithms are evaluated, including several deep learning architectures. This evaluation has been carried out over the HARTH dataset. This public dataset contains recordings from 22 participants wearing two 3-axial Axivity AX3 accelerometers for 2 h in a free-living setting. Not all the subjects completed the whole session. Sixteen different activities were recorded and annotated accordingly. This paper describes the fine-tuning process of several machine learning algorithms and analyses their performance with different sets of activities. The best results show an accuracy of 90% and 93% for 12 and nine activities, respectively. To the author’s knowledge, these analyses provide the best state-of-the-art results over this public dataset. Additionally, this paper includes several analyses of the confusion between the different activities.
1. Introduction
The levels of interaction between humans and technology is rapidly increasing, showing a significant impact on almost every aspect of modern life. Such interactions may also involve designed technologies with applications for a wide range of areas (such as health, safety, or sports monitoring), including the Human Activity Recognition (HAR) system. This technology is a branch of computer science, specifically artificial intelligence, which focuses on identifying human actions, activities, or behaviors through data analysis captured by one or more sensors. These systems employ advanced signal processing and machine learning techniques to identify and classify actions performed by individuals [1].
Despite the field’s growth, the process of obtaining and preparing data is not trivial, and this phase can result in erroneous, noisy, or even missing data.
This discipline has grown exponentially since its inception in the mid-20th century, when the first trials of automating human activity detection through signal processing were conducted. Initially, the HAR system interpreted human movement using cameras and video analyses [2].
Thanks to technological advancements, sensors have undergone miniaturization, leading to an expansion of HAR studies that now include various wearable devices and sensors integrated into the environment, such as gyroscopes, accelerometers, and magnetometers, which are included in devices like phones or smartwatches [3].
Over the past two decades, the massive expansion of data and the development of machine learning and deep learning algorithms have revolutionized this field, increasing the precision and reliability of HAR systems in real applications [4].
These automatic HAR systems have also replaced the manual supervision of physical activity [5] required in some applications, like Parkinson’s Disease monitoring by physicians [6]. Additional to the high cost of manual supervision, there is the risk of introducing bias in the subjective evaluations. To avoid this, measurements obtained from motion sensors, such as portable accelerometers, are a good alternative for providing objective metrics. Most of the systems developed, including machine learning algorithms, have been created in controlled environments, which can affect the models’ ability to generalize to real-world situations.
In this work, a Human Activity Recognition (HAR) system has been implemented using different classification algorithms (deep neural networks and Random Forest). The system has been evaluated through a public database known as HARTH, whose recordings were obtained from two triaxial sensors located on the thigh and back of 22 different users. The data include x, y, z axis accelerations that reflect the movement of the body over time. The developed systems have been evaluated to recognize full-body activities, significantly improving the best results reported in previous works [7].
2. Materials and Methods
This section provides a description of the dataset and the main modules of the HAR system: feature extraction, machine learning algorithms, the evaluation structure and metrics.
2.1. Dataset
For this work, we have used a public database, HARTH (Human Activity Recognition Dataset for Machine Learning) [8], available at the UCI repository [9]. The data are presented in CSV format, including the accelerations in the x, y, and z axes and the timestamp of the data. The sampling frequency of the data is 50 Hz, and there are a total of 6,461,328 samples distributed among 22 subjects. Not all the subjects completed the whole 2 h session; therefore, we have an average of 1.6 h per subject. This dataset contains recordings from 12 different full-body activities: walking (W), running (R), shuffling (SH), stairs-ascending (ST(A)), stairs-descending (ST(D)), standing (ST), sitting (SI), lying (L), cycling-sit (C(SI)), cycling-stand (C(ST)), transport-sit (T(SI)), transport-stand (T(ST)).
This dataset has been divided into two main parts considering a subject-wise strategy: 90% (20 subjects) for developing the system and 10% (2 subjects) for final testing. The development of the system has consisted of evaluating several feature extractions and machine learning algorithms and fine-tuning their main hyperparameters. This process has been conducted using 90% of the data while considering a 5-fold cross validation to increase the significance of the results. This technique involves dividing the sub dataset into 5 equal parts while, in each iteration, one of the 5 parts is used as a validation set while the remaining four parts are used as a training set. The 5-fold results are the average of the results obtained along the folds.
2.2. Feature Extraction
Before starting to train the model, the data are prepared through various processes to extract the main features from the inertial signals and adapt the format to the machine learning algorithms. The first step involves using the Octave [10] tool to convert raw data into normalized spectral features to highlight relevant information in the frequency domain and reduce data complexity. The data are segmented into 2 s windows with a 1 s shift. Each window is labeled according to the predominant activity. For each window, spectra are computed using two spectral transforms, namely Fourier Transform and Constant-Q Transform (CQT). The best results obtained during the system development were obtained with the CQT. This transform computes a frequency representation with a higher spectral resolution at low frequencies, presenting very interesting results in regard to human movements. In this transform, the distance between consecutive harmonics does not depend on the fundamental frequency. This characteristic facilitates the learning process of linear kernels in convolutional networks.
2.3. Machine Learning Algorithms for Classification
In this study, we have evaluated two representative algorithms: a deep neural network and the Random Forest, as an example of a good traditional algorithm.
- Deep Neural Networks
Neural networks [11,12] are models formed by layers which, in turn, are composed of neurons connected to neurons in the previous layer. The function of these neurons is to perform simple mathematical operations for machine learning which propagate from one neuron to another.
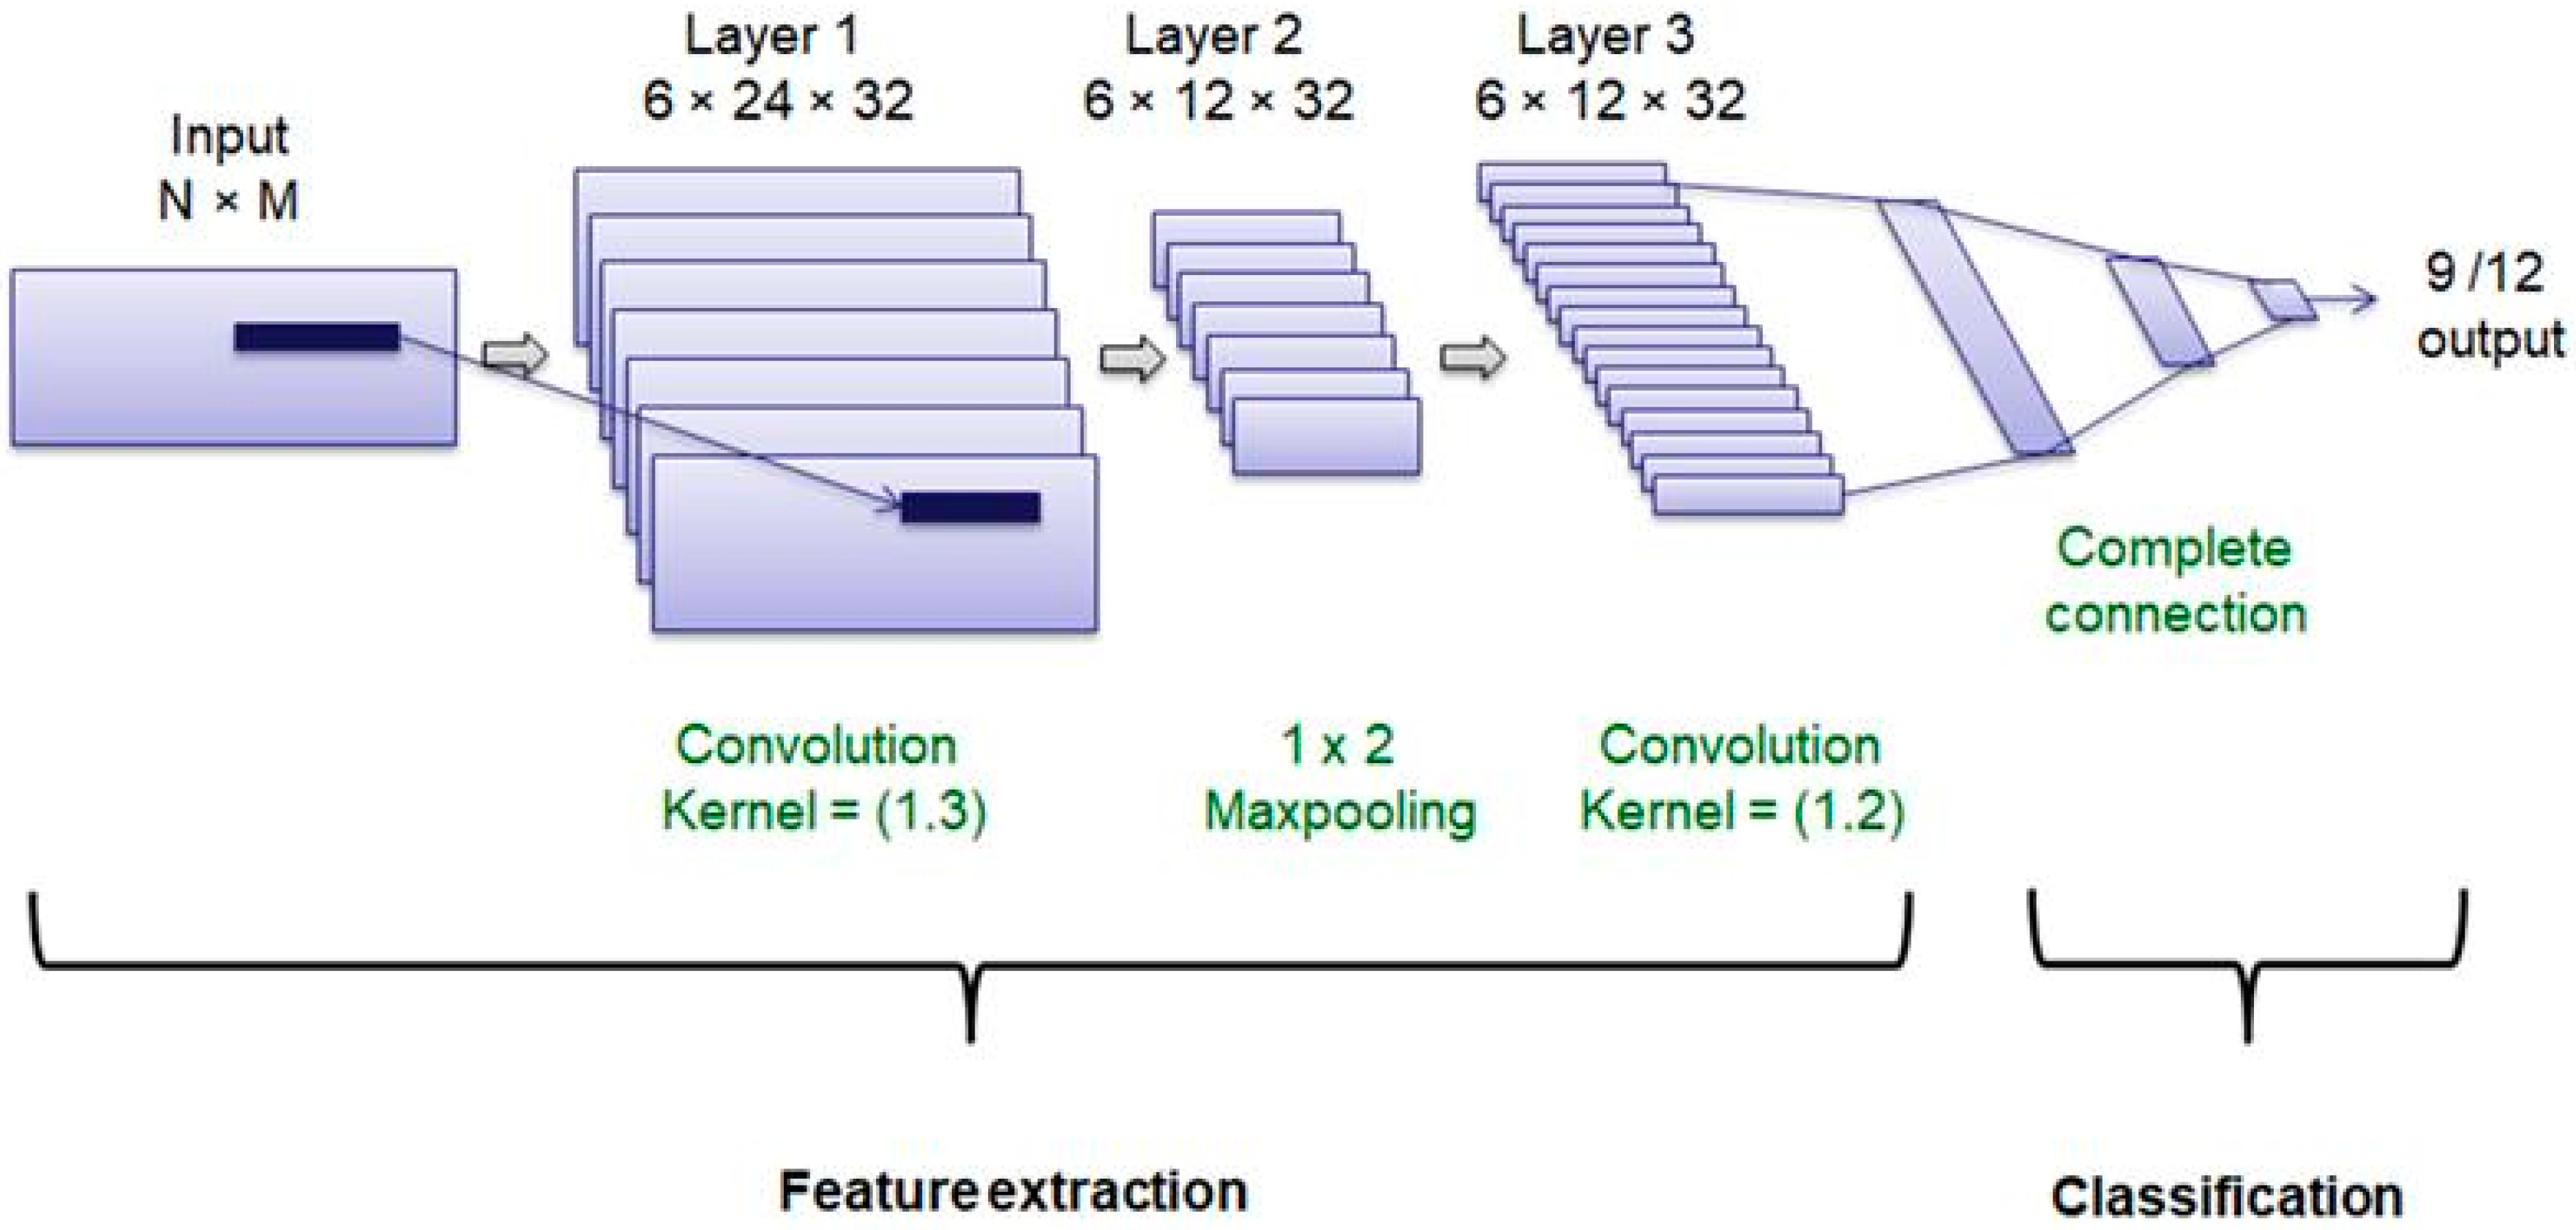
A deep learning structure with a feature learning subnet and a classification subnet was used to distinguish between the different types of movements. This architecture was composed of two convolutional layers with an intermediate max-pooling layer for feature learning and three fully connected layers for classification. Dropout layers were included after convolutional and fully connected layers to avoid overfitting (Figure 1).

Figure 1.
Neural network structure.
In this architecture, ReLU was used as the activation function in intermediate layers to reduce the impact of gradient vanishing effect and SoftMax is the activation function in the last layer to perform the classification task. The optimizer was fixed to the root mean-square propagation method. The main hyperparameters have been fixed considering 90% of the data and using a 5-fold cross validation. We have considered 32 filters for the convolutional layer, with a dropout rate of 0.3, a batch size of 50 and 10 epochs.
- Random Forest
Random Forest [13] is an algorithm composed of one or multiple decision trees that use averaging to make predictions on subsamples of the dataset. Decision trees are prediction models that use binary rules (yes/no) to split observations based on their attributes, enabling predictions of the sample’s value. It is highly useful for classifying categorical datasets due to their low variance and high complexity, and it significantly reduces the risk of overfitting. During the development phase, the best results were obtained with 150 estimators and the ‘gini’ criteria.
2.4. Post-Processing: Majority Voting Filtering
Finally, the decisions in the sequence of windows are post-processed using a majority voting time filter. This technique helps to reduce the model’s sensitivity to fluctuations in the sequence of windows, smoothing the classifier’s decisions. This filter contributes to the classification’s stability and robustness, as well as to improving the results. The best results were obtained considering a kernel including 5 consecutive windows (with a filter length of 5 windows).
2.5. Evaluation
To evaluate the system performance, we have considered several metrics computed using the scikit learn toolkit [14]. Accuracy calculates the proportion of correctly classified examples out of the total number of examples. This metric is obtained by dividing the sum of true positives and true negatives by the total number of instances. This way, an increment of accuracy implies that the overall system better recognizes the classes. In this work, we used 95% confidence intervals attached to the accuracy values. The F1 score is the harmonic mean of the precision and recall. Precision (positive predictive value) is the fraction of positive examples detected among the positive examples: true positive divided by true positive plus false positive examples. Recall (sensitivity) is the relation between true positive examples and the sum of true positive and false positive examples.
3. Results and Discussion
The next table (Table 1) shows the testing results obtained after the system development.

Table 1.
Final results considering all the algorithms and compared to previous works.
Considering these results, it can be observed that the system using the deep neural network is the most accurate system for activity classification, achieving an accuracy rate of 93% for 9 different activities and 90% for 12 activities. Compared with the results from the reference article ‘HARTH: A Human Activity Recognition Dataset for Machine Learning’ [7], the classification capability of the system developed in this project is higher in terms of accuracy, since the maximum accuracy rate reported in that article was 70% when using 12 different labels and 85% when using 9 classes. These differences are higher than the confidence intervals, indicating a significant improvement with the results shown in this paper.
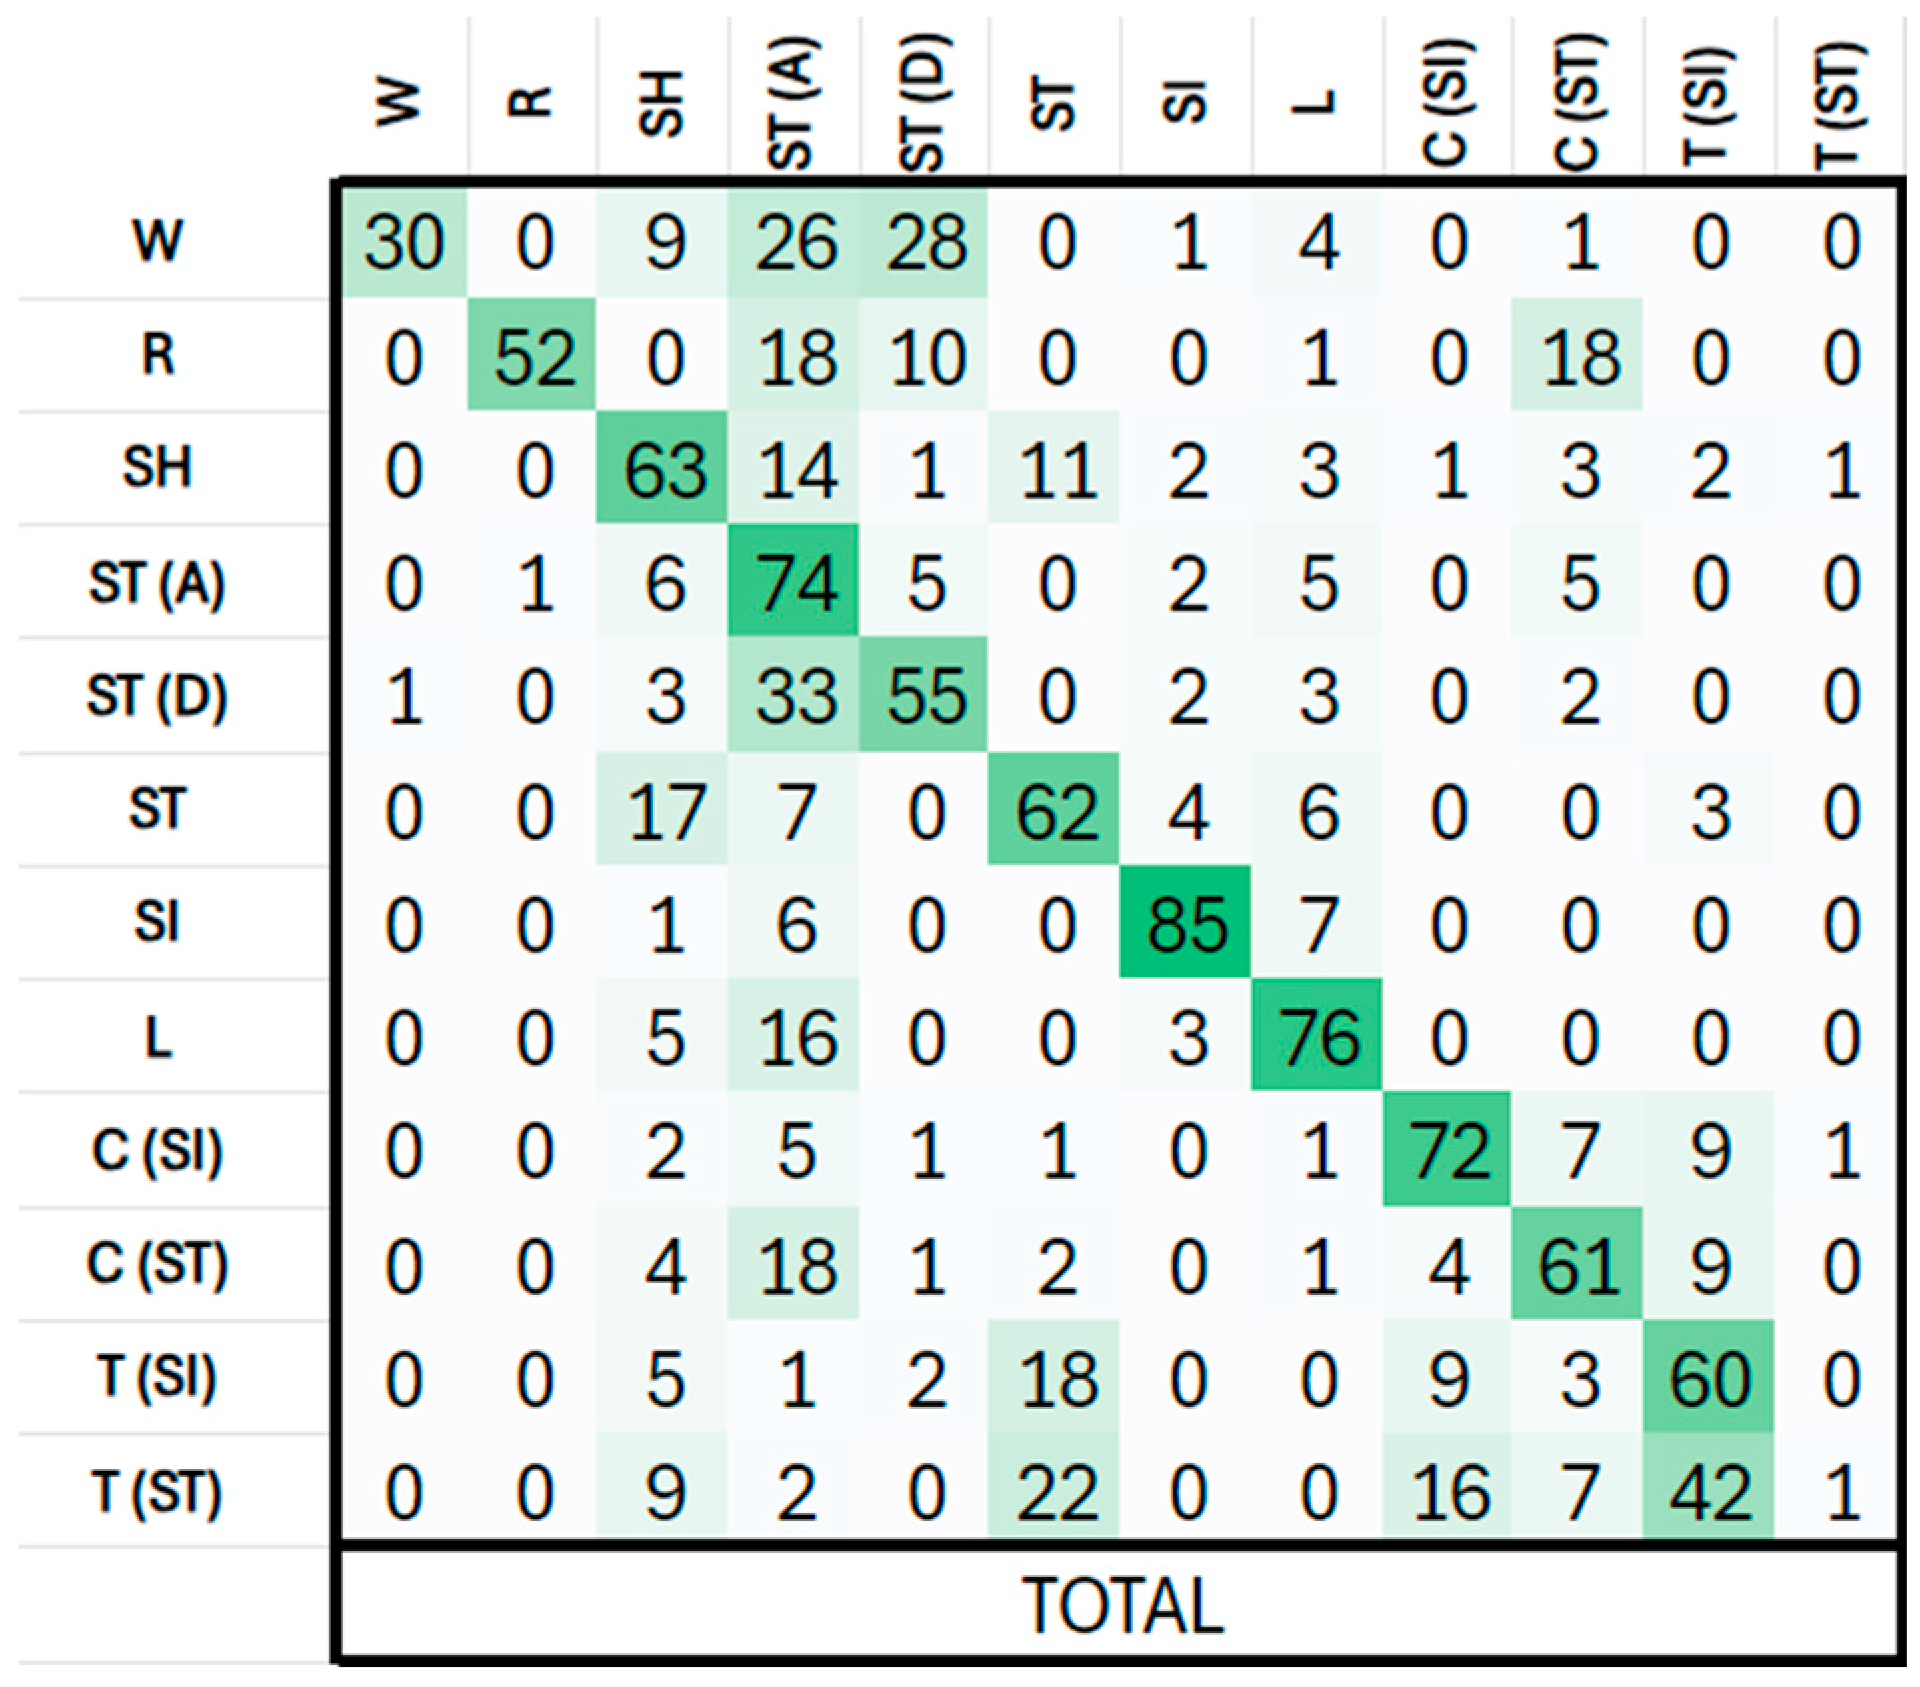
Figure 2 shows the confusion matrix in percentages for the best system. As shown, the highest confusion occurs between the two activities involving stairs (ST(x)) and with walking (W). Also, transport activities (T(xx)) show an important confusion between them and with standing (ST). The activity transport-stand (T(ST)) is not well identified because the number of examples is very low, and the model is not able to deal with this type of activity.
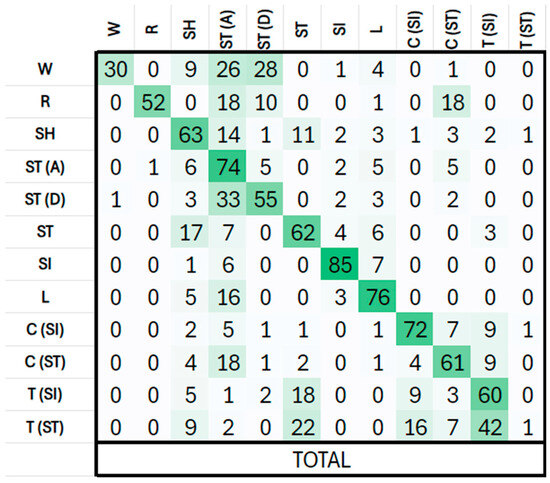
Figure 2.
Confusion Matrix.
4. Conclusions
The first main conclusion of this work is that we have developed a HAR system able to achieve an accuracy of over 90% for classifying 12 different full-body activities. This system includes several modules: a preprocessing module that divides the inertial signals into consecutive windows and computes the CQT for extracting relevant information at each window from the frequency domain. The second module includes a deep neural network for classifying every window. This DNN has shown better results compared to a Random Forest algorithm. Finally, post-processing is applied to the window sequence for smoothing the decision sequence. This process consists of a majority voting filter while considering a kernel of five windows length. These reported results have shown important improvements compared to previous works.
Author Contributions
Conceptualization, E.R.R. and R.S.-S.; methodology, E.R.R. and R.S.-S.; software, E.R.R., S.E.-R. and M.G.-M.; validation, E.R.R. and R.S.-S.; formal analysis, E.R.R., M.G.-M. and R.S.-S.; investigation, E.R.R. and R.S.-S.; resources, R.S.-S.; data curation, E.R.R. and S.E.-R.; writing—original draft preparation, E.R.R.; writing—review and editing, S.E.-R., M.G.-M. and R.S.-S.; visualization, E.R.R.; supervision, R.S.-S.; project administration, R.S.-S.; funding acquisition, R.S.-S. All authors have read and agreed to the published version of the manuscript.
Funding
This research was funded by the European Union’ EDF program under grant agreement number 101103386 (FaRADAI project).
Institutional Review Board Statement
Not applicable.
Informed Consent Statement
Not applicable. Data were collected in another previous work.
Data Availability Statement
The data presented in this study are openly available in this link https://archive.ics.uci.edu/dataset/779/harth (accessed on 24 December 2024).
Acknowledgments
Authors thank all the other UPM members of the FaRADAI project for the continuous and fruitful discussion on these topics.
Conflicts of Interest
The authors declare no conflicts of interest.
References
- Qiu, S.; Zhao, H.; Jiang, N.; Wang, Z.; Liu, L.; An, Y.; Zhao, H.-Y.; Miao, X.; Liu, R.; Giancarlo, F. Multi-sensor information fusion based on machine learning for real applications in human activity recognition: State-of-the-art and research challenges. Inf. Fusion 2022, 80, 241–265. [Google Scholar] [CrossRef]
- Ariza-Colpas, P.P.; Vicario, E.; Oviedo-Carrascal, A.I.; Butt Aziz, S.; Piñeres-Melo, M.A.; Quintero-Linero, A.; Patara, F. Human Activity Recognition Data Analysis: History, Evolutions, and New Trends. Sensors 2022, 22, 3401. [Google Scholar] [CrossRef] [PubMed]
- Xiao, L.; Luo, K.; Liu, J.; Foroughi, A. A hybrid deep approach to recognizing student activity and monitoring health physique based on accelerometer data from smartphones. Sci. Rep. 2024, 14, 14006. [Google Scholar] [CrossRef]
- Devopedia.“Data Preparation” Version 8, March 25. 2020. Available online: https://devopedia.org/data-preparation (accessed on 25 June 2024).
- Gil-Martín, M.; Johnston, W.; San-Segundo, R.; Caulfield, B. Scoring Performance on the Y-Balance Test Using a Deep Learning Approach. Sensors 2021, 21, 7110. [Google Scholar] [CrossRef]
- San-Segundo, R.; Zhang, A.; Cebulla, A.; Panev, S.; Tabor, G.; Stebbins, K.; Massa, R.E.; Whitford, A.; de la Torre, F.; Hodgins, J. Parkinson’s Disease Tremor Detection in the Wild Using Wearable Accelerometers. Sensors 2020, 20, 5817. [Google Scholar] [CrossRef] [PubMed]
- Logacjov, A.; Bach, K.; Kongsvold, A.; Bårdstu, H.B.; Mork, P.J. HARTH: A Human Activity Recognition Dataset for Machine Learning. Sensors 2021, 21, 7853. [Google Scholar] [CrossRef]
- Logacjov, A.; Bach, K. Baseline Machine Learning Models for the Human Activity Recognition Trondheim (HARTH) Dataset. 2021. Available online: https://github.com/ntnu-ai-lab/harth-ml-experiments (accessed on 2 June 2024).
- Logacjov, A.; Kongsvold, A.; Bach, K.; Bårdstu, H.B.; Mork, P.J. UC Irvine Machine Learning Repository. HARTH. 2023. Available online: https://archive.ics.uci.edu/dataset/779/harth (accessed on 2 June 2024).
- Eaton, J.W. GNU Octave Version 8.4.0. 2023. GNU Octave. Available online: https://octave.org/ (accessed on 20 June 2024).
- François Chollet. Keras. Model Training APIs. Version 3.0. 2023. Available online: https://keras.io/api/models/model_training_apis/ (accessed on 20 June 2024).
- François Chollet. Keras Layers API. Version 3.0. 2023. Available online: https://keras.io/api/layers/ (accessed on 20 June 2024).
- Pedregosa, F.; Varoquaux, G.; Gramfort, A.; Michel, V.; Thirion, B.; Grisel, O. Scikit-learn: Machine Learning in Python. RandomForestClassifier. Version 1.0. 2021. Available online: https://scikit-learn.org/stable/modules/generated/sklearn.ensemble.RandomForestClassifier.html (accessed on 29 June 2024).
- Pedregosa, F.; Varoquaux, G.; Gramfort, A.; Michel, V.; Thirion, B.; Grisel, O. Scikit-Learn: Machine Learning in Python. Metrics and Scoring: Quantifying the Quality of Predictions. Version 1.0. 2021. Available online: https://scikit-learn.org/stable/modules/model_evaluation.html (accessed on 29 June 2024).
Disclaimer/Publisher’s Note: The statements, opinions and data contained in all publications are solely those of the individual author(s) and contributor(s) and not of MDPI and/or the editor(s). MDPI and/or the editor(s) disclaim responsibility for any injury to people or property resulting from any ideas, methods, instructions or products referred to in the content. |
© 2024 by the authors. Licensee MDPI, Basel, Switzerland. This article is an open access article distributed under the terms and conditions of the Creative Commons Attribution (CC BY) license (https://creativecommons.org/licenses/by/4.0/).