Proceeding Paper

Development of a Low-Cost Interactive Prototype for Acquisition and Visualization of Biosignals †

by
Juan C. Delgado-Torres
1,
Daniel Cuevas-González
2,*,
Marco A. Reyna
2,*,
Juan Pablo García-Vázquez
2,
Eladio Altamira-Colado
2,
Martín Aarón Sánchez-Barajas
1 and
Oscar E. Barreras
1
1
Instituto de Ingeniería, Universidad Autónoma de Baja California, Mexicali 21280, Mexico
2
Cuerpo Académico de Bioingeniería y Salud Ambiental, Universidad Autónoma de Baja California, Mexicali 21280, Mexico
*
Authors to whom correspondence should be addressed.
Presented at The 11th International Electronic Conference on Sensors and Applications (ECSA-11), 26–28 November 2024; Available online: https://sciforum.net/event/ecsa-11.
Eng. Proc. 2024, 82(1), 1; https://doi.org/10.3390/ecsa-11-20444
Published: 25 November 2024

Abstract

:
Nowadays, some of the most severe problems faced by health institutions are related to people’s mental health. According to the World Health Organization, approximately one billion people lived with a condition that affected their mental health in 2020, where depression, anxiety, and stress represent the most common examples. Furthermore, according to the American Psychological Association, stress aggravates the symptoms of depression and anxiety, besides having negative effects on the cardiovascular, respiratory, muscular, nervous, reproductive, endocrine, and gastrointestinal systems. It is estimated that during the COVID-19 pandemic, the number of global cases of major depressive disorder and anxiety disorders increased by 53.2 million and 76.2 million, respectively. Psychophysiology and other health disciplines, such as psychology, neurology, psychiatry, and physiotherapy, provide quantitative data from physiological signals. These signals are acquired through specialized systems that are often very expensive, with most being closed-source hardware and software. This work proposes the development of a low-cost prototype for the acquisition and visualization of a patient’s HR, ECG, EMG, GSR, and body temperature biosignals using the MAX30102, ECG AD8232, EMG Muscle T084, Grove GSR sensor, and LM35 AFEs breakout boards, respectively. Signal acquisition tests were performed with each sensor without post-processing or filtering. The test results prove that the biosignals acquired by the prototype present usability, correct morphology, stability, and can operate without errors for up to 12 h. This is expected to provide an affordable alternative to biosignal acquisition systems for educational and research institutions, offering users a similar experience to that provided by high-cost equipment, thus benefiting the training of studies.

1. Introduction

The World Health Organization (WHO) released a report in 2020 on the global prevalence of mental disorders, stating that approximately one billion people live with a condition that affects their mental health. Additionally, this sector of the population tends to die 10 to 20 years earlier compared to the general population. Among the most common disorders are depression, anxiety, and stress [1].
According to the American Psychological Association (APA), stress aggravates symptoms of depression and anxiety, in addition to having negative effects on the muscular, respiratory, cardiovascular, endocrine, gastrointestinal, nervous, and reproductive systems [2]. In [3], it was estimated that the coronavirus disease 2019 (COVID-19) pandemic had a negative impact on the mental health of the global population, resulting in an increase of 53.2 million additional cases of major depressive disorder, representing a 27.6% rise compared to the disorder’s pre-pandemic prevalence. Similarly, a 25.6% increase in anxiety disorder cases was observed, with 76.2 million additional cases.
Biosignal acquisition systems perform a fundamental role in clinical and experimental tests assessing stress, anxiety, and depression [4,5]. In addition to miniaturization, a growing trend for the development of biosignal acquisition equipment is to reduce the cost of manufacturing in order for biosignal detection to be more affordable for educational and research institutions. Furthermore, most of these systems do not use free software, making it difficult to modify them for the development of new methods of clinical assessments and treatments where the integration of developed software with hardware is necessary [6,7,8,9].
This work presents the development of a low-cost prototype for the acquisition and visualization of a patient’s heart rate (HR), electrocardiogram (ECG), electromyography (EMG), galvanic skin response (GSR), and body temperature biosignals. The system uses the MAX30102, ECG AD8232, EMG Muscle T084, Grove GSR sensor, and LM35 analog front ends (AFEs) breakout boards, respectively, to transmit the information wirelessly using an HC-06 Bluetooth module (see Figure 1).

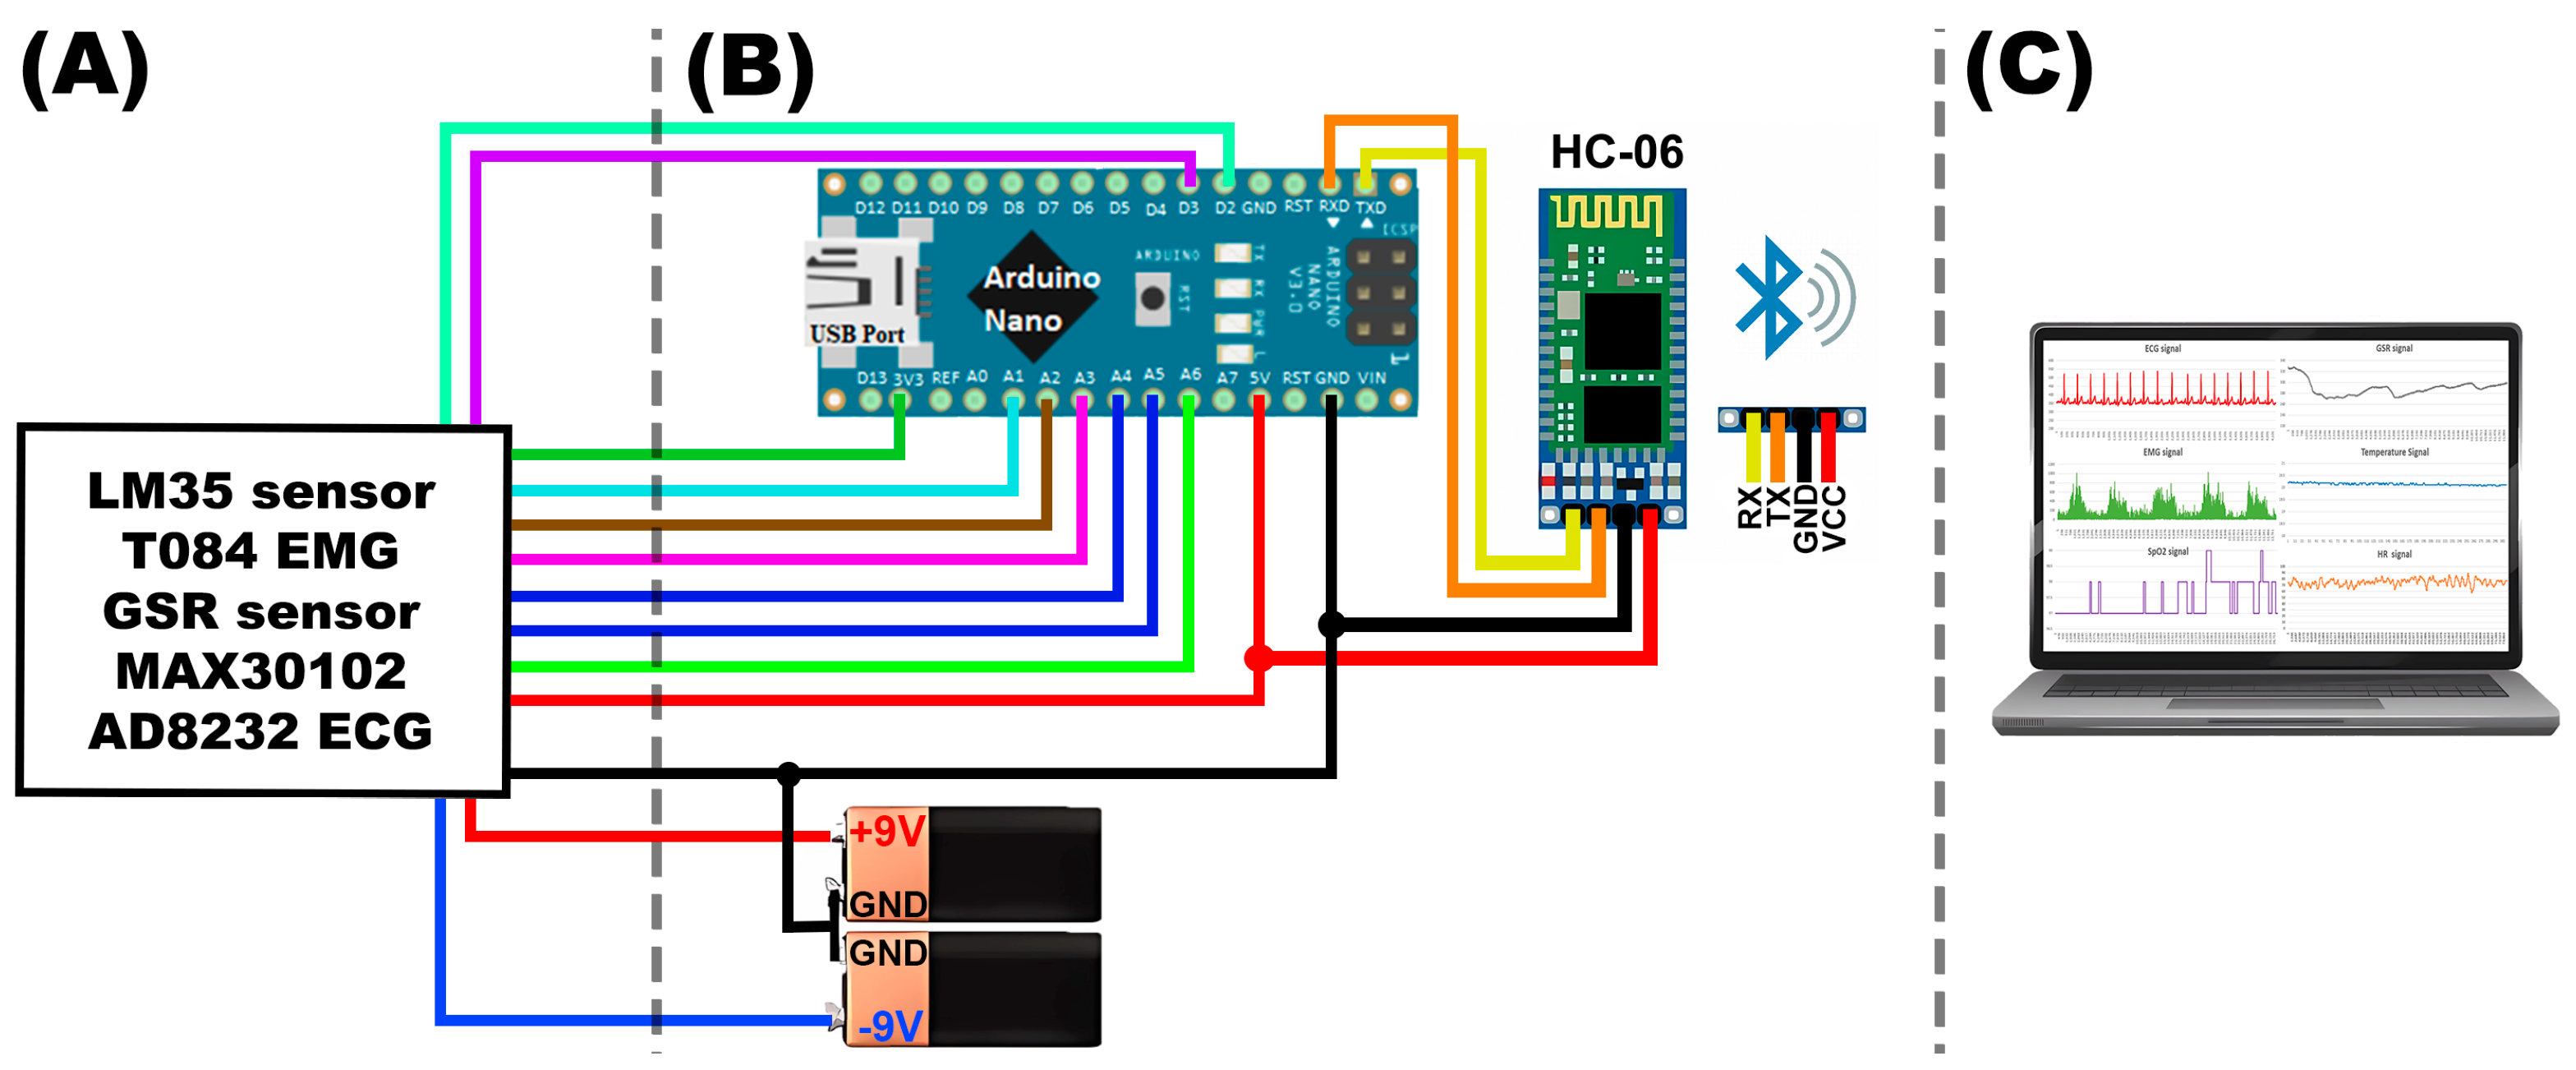
2. Materials and Methods

This paper presents the methodology for the development of a low-cost prototype for the acquisition and visualization of biosignals. The prototype was developed using a modular design in which each biosignal corresponds to a module. All modules consist of three stages: analog, digital, and data transmission. The sampling frequency of each module was selected according to the biosignal to be measured.

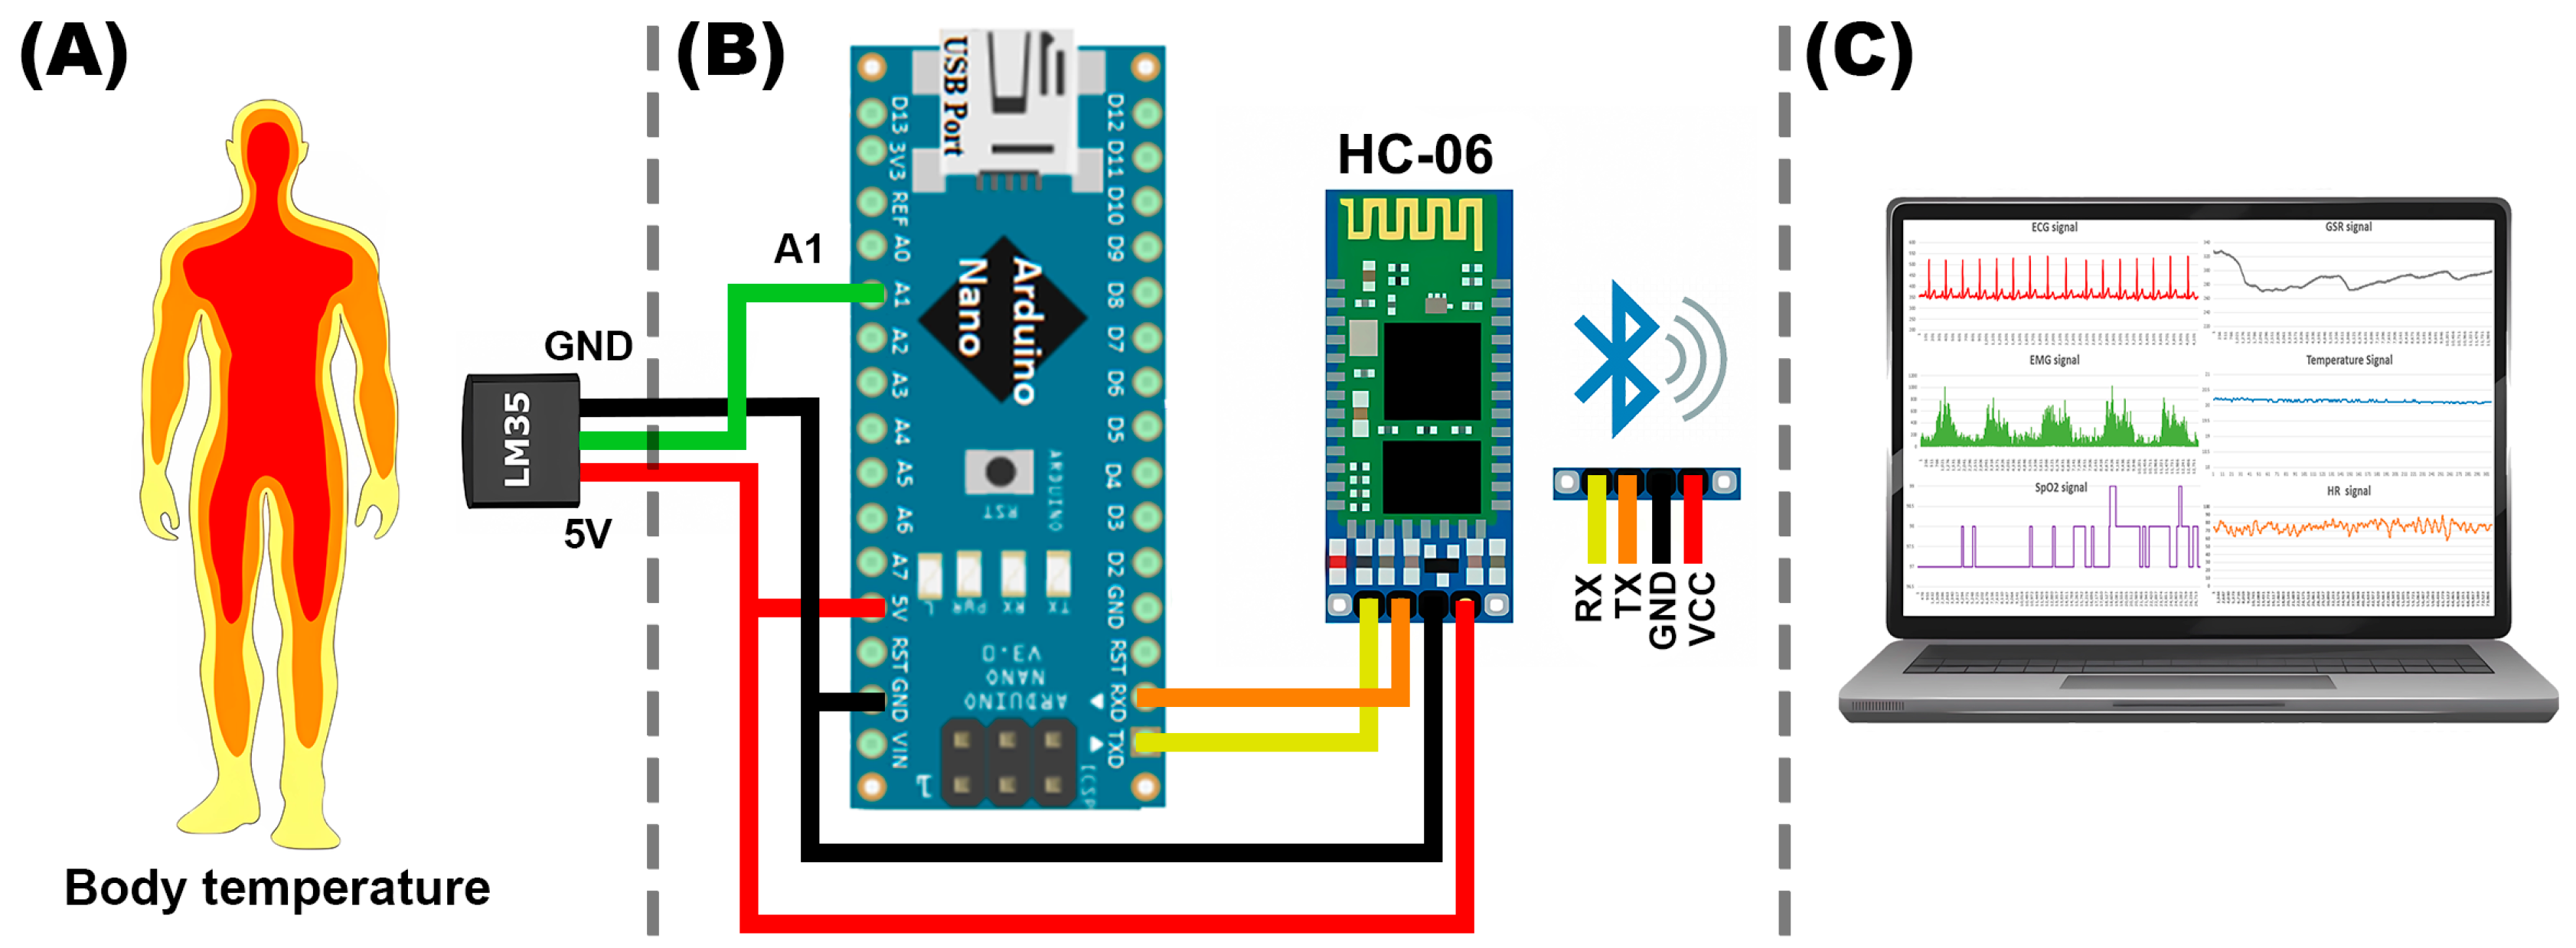
2.1. Body Temperature LM35

The analog stage for body temperature measurement features an LM35 temperature sensor [10]. The digital stage comprises an Arduino Nano Board with a sample frequency of 1 Hz and an HC-06 Bluetooth module for wireless serial transmission to a computer. (See Figure 2).

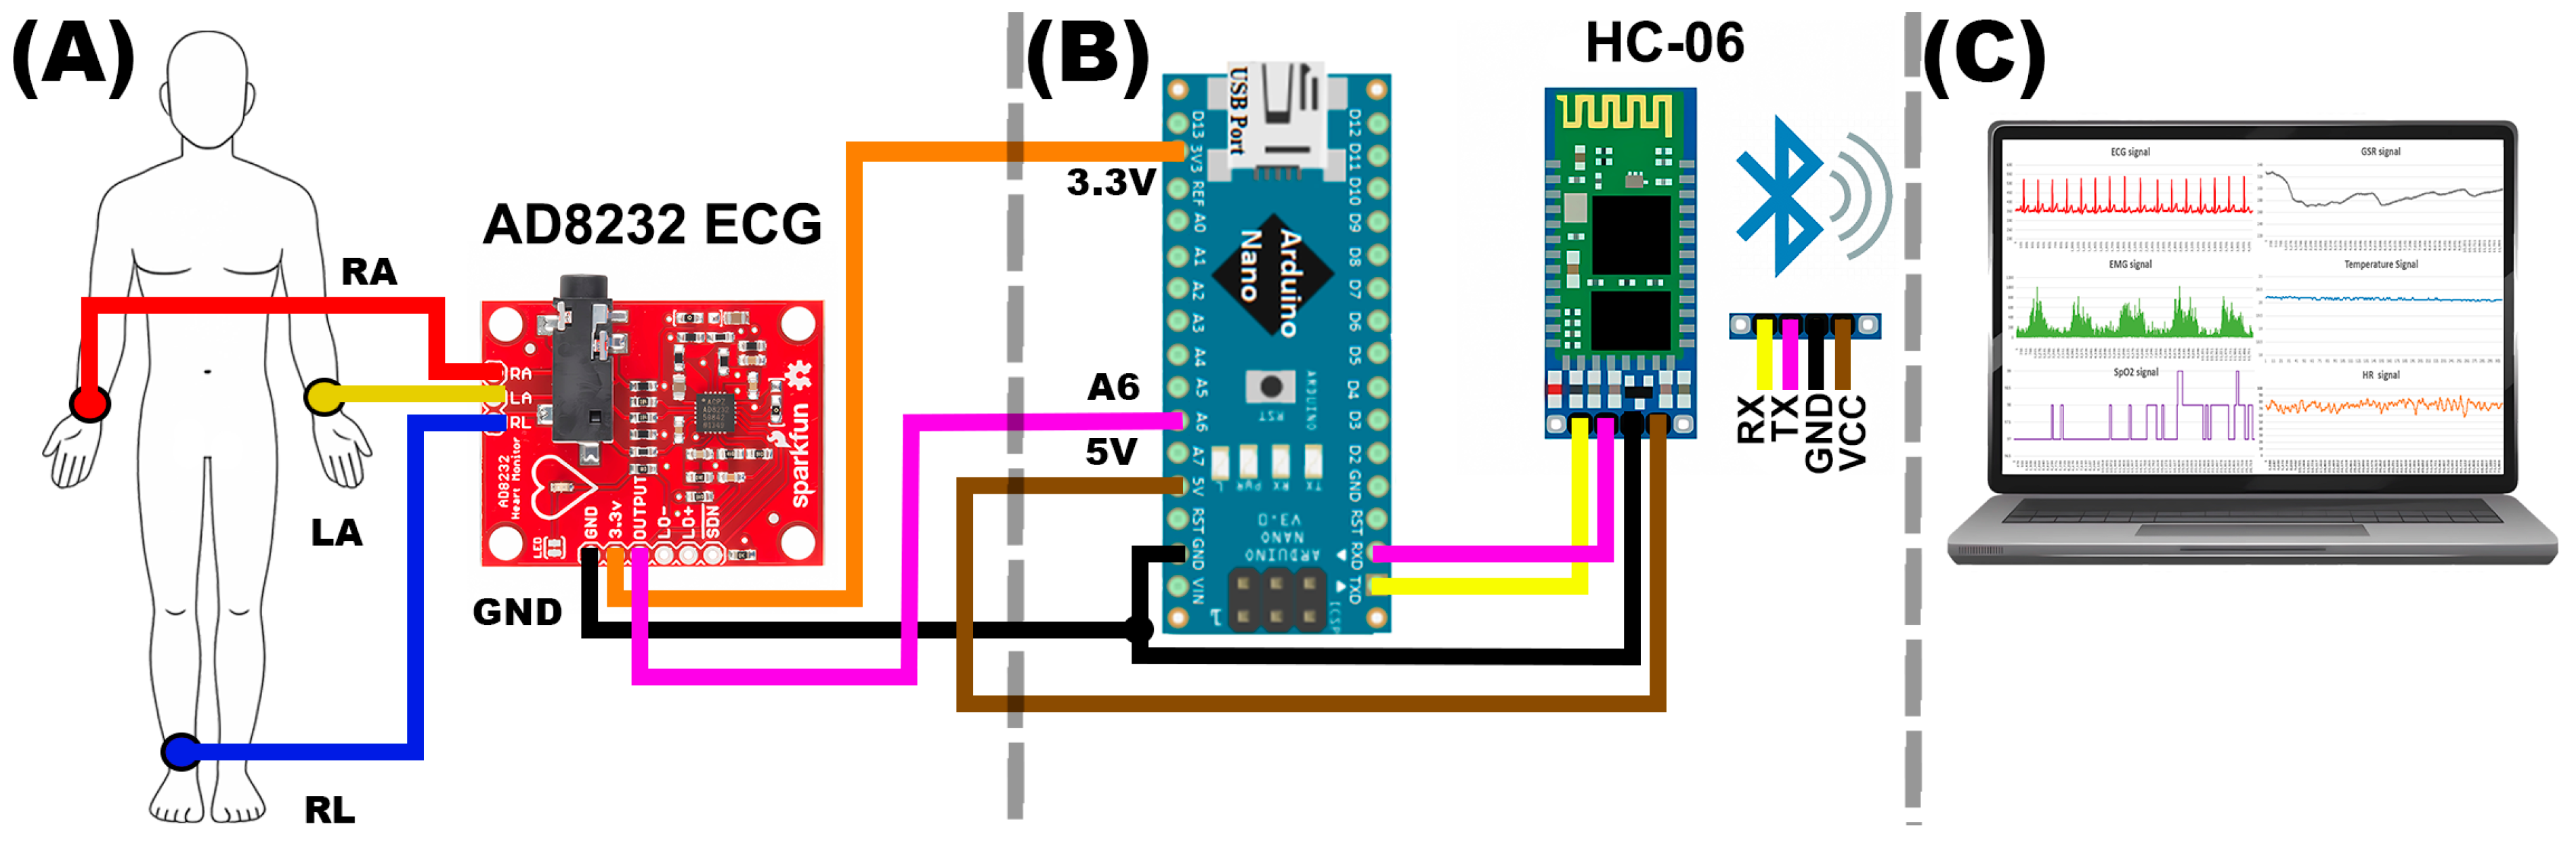
2.2. AD8232 ECG Circuit

In the analog stage, the DI Einthoven’s lead (with bandwidth 0.5–40 Hz) was used for data acquisition with a SparkFun AD8232 board [11]. The digital stage consists of an Arduino Nano board with a sampling rate of 360 Hz [8,12], and a Bluetooth HC-06 module was used for wireless transmission to a computer. (see Figure 3).

2.3. EMG Muscle T084 Board

In the analog stage of the EMG acquisition board, muscle electrical activity is sensed using three electrodes connected to the test volunteer dominant arm. One electrode is placed in the middle part of the muscle, another at the end of the muscle, and the last one is positioned in a non-muscular area close to the muscle using an EMG Muscle T084 [13]. Afterwards, in the digital stage, the readings taken by the EMG device are processed for digitization using an Arduino Nano module with a sampling frequency of 500 Hz [14,15]. Subsequently, in the data transmission stage, the processed data are wirelessly transmitted to a computer using an HC-06 Bluetooth device (see Figure 4).

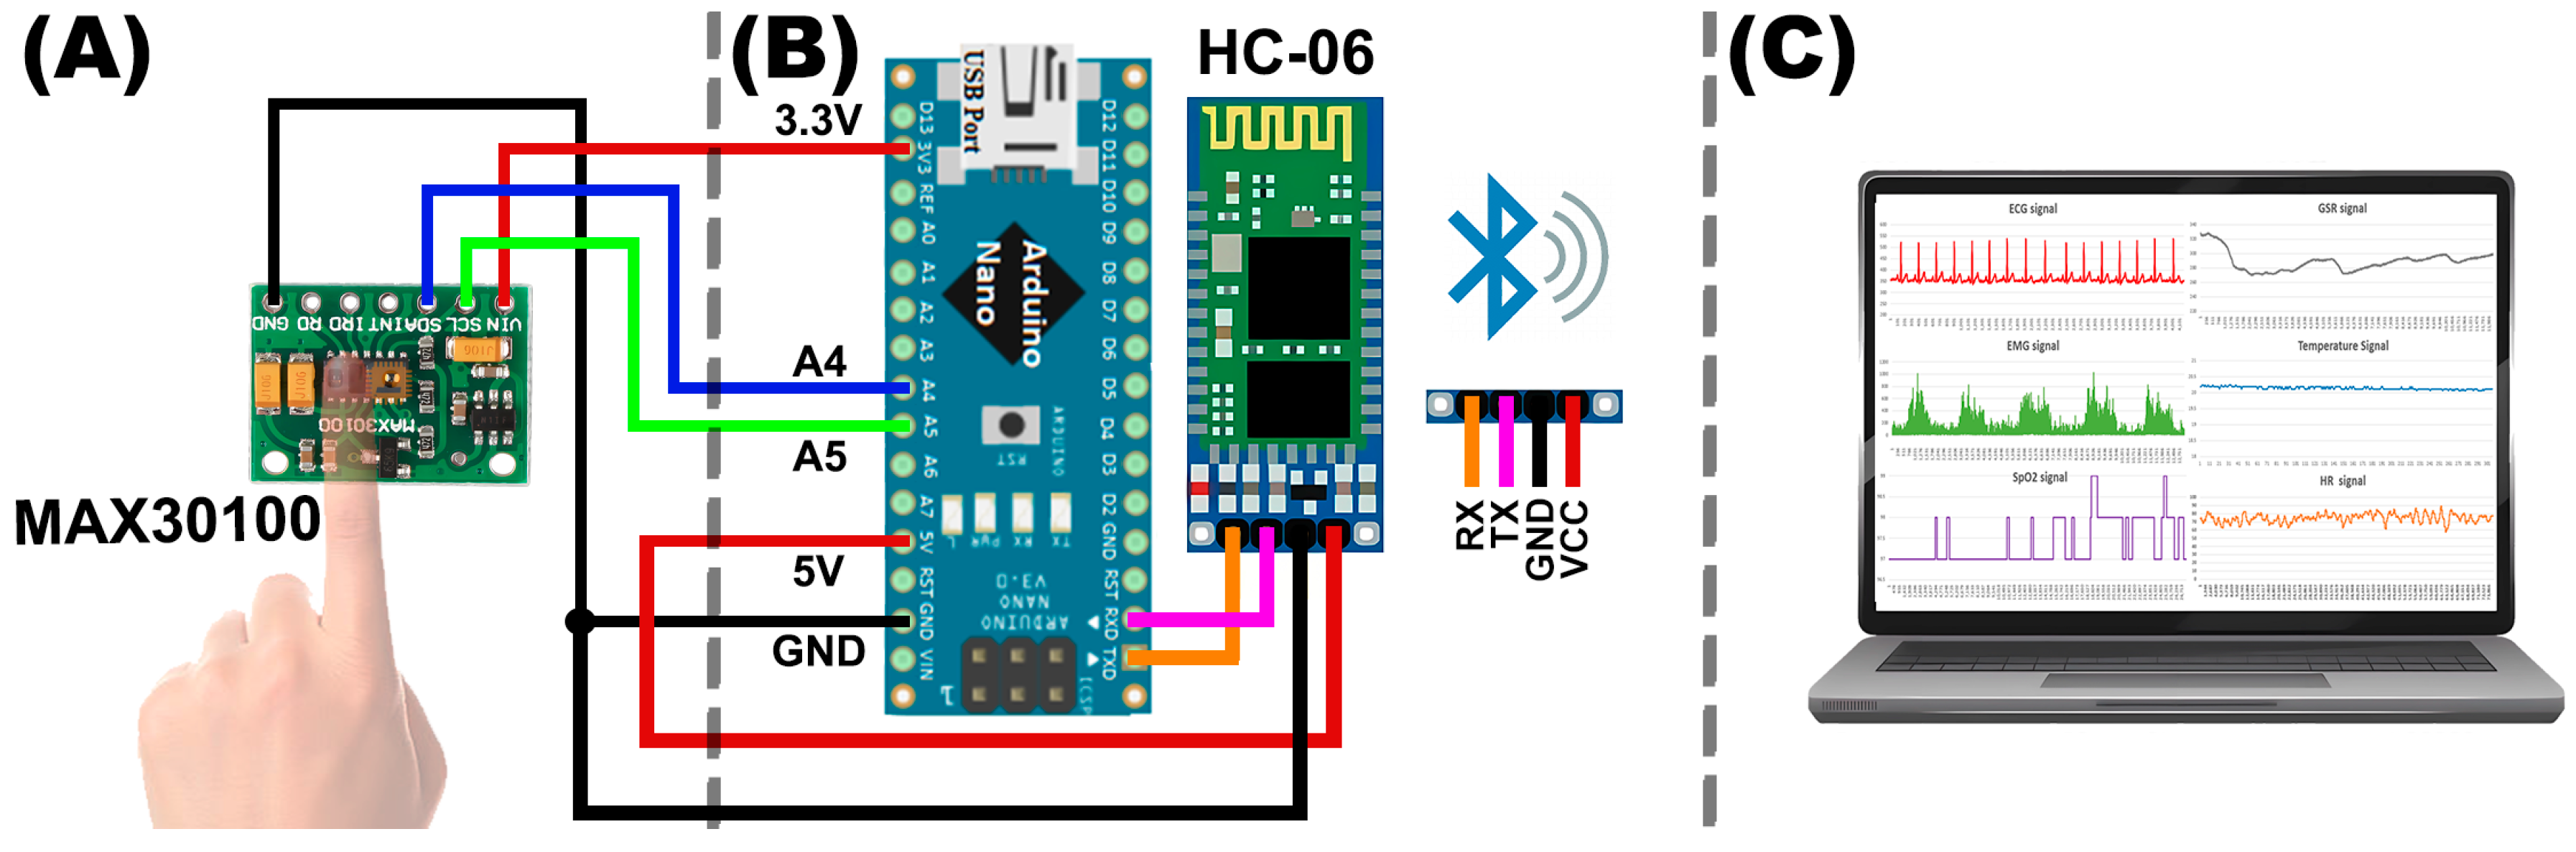
2.4. MAX30102 Heart Rate Pulsioximeter

The analog stage of the HR and SpO2 circuit consists of a MAX30102 sensor. This sensor works on the principle of the photoplethysmogram, where it measures the amount of light reflected from the index finger of the non-dominant hand through a photodetector [16]. The samples from the MAX30102 are digitized by an Arduino Nano Board at a sampling frequency of 500 Hz and 100 Hz for HR and SpO2, respectively [17,18,19]. In the data transmission stage, the processed data are wirelessly transmitted with a HC-06 Bluetooth module to a computer. (See Figure 5).

2.5. Grove GSR Sensor

The GSR analog stage is where the electrical conductance of the skin is measured with a Grove GSR sensor. This sensor consists of two nickel electrodes placed on the index finger and middle finger of the non-dominant hand [20]. Subsequently, in the digital stage, the readings are digitized using an Arduino Nano module with a sampling frequency of 100 Hz [21]. In the data transmission stage, a Bluetooth HC-06 device transmits the processed data to a computer (see Figure 6).

2.6. Digital Stage Stability

Some experiments were considered to ensure the robustness and stability of the prototype, including the replication of some hardware and software tests from the work [8]. Sampling rates were tested for each mode of operation via USB serial cable and Bluetooth. Although the prototype has not yet achieved autonomy (battery and data storage interface) for long term testing (up to 12 h), the Arduino IDE interface provides a data buffer of 450,000 samples, which is insufficient for long term use. In the 12 h test, the data were overwritten constantly while the device was monitored for proper operation connected to the power supply. In the individual tests of body temperature, GSR and SpO2 biosignal measurements, a high sampling frequency was not used like those used in the ECG, EMG, and HR tests. However, when performing the acquisition test of all the biosignals at the same time, a single sampling frequency was implemented because the same interrupt was used to obtain all the measurements on the Arduino Nano Board, and therefore the sampling frequency was set to 500 Hz.

3. Results

3.1. Biosignals Obtained from the Prototype

Measured signals were acquired using the prototype as shown in Figure 7. The ECG signal shows a morphology appropriate to a signal of standard conditions with a sampling rate of 500 Hz. In the EMG signal, the bicep muscle contraction can be observed with 2 s intervals of contraction and rest. However, since this module provides a rectified EMG signal, its application for these biosignals analysis could be limited. The SpO2 and HR signals were obtained from the max30102 module, which required a period of time to stabilize and provide stable readings (approximately 30 s) in accordance with the physical variables. For the temperature sensor, measurements of ambient temperature and temperature in contact with the skin of the human body were taken. However, due to the LM35 sensor’s encapsulation, it does not facilitate readings on contact with the human body, only environmental measurements were used for this work. Finally, for the GSR sensor, variations in galvanic skin resistance were recorded in response to different scenarios that stimulated the user with images that could evoke different emotions (e.g., happiness, annoyance, sadness).

3.2. Digital Stage Stability

Following the methodology to evaluate the functionality and the stability mentioned above, the prototype can operate via USB Serial port to PC and transmit up to 2084 samples per second with a baud rate of 230,400 bauds and 2380 samples per second with a baud rate of 1 M bauds. However, considering the wireless connectivity trend of new technologies, the HC-06 Bluetooth V2.0+EDR module configured on the TX and RX pins of the hardware serial port to efficiently transmit up to 1250 data per second was used. This information is valuable to comply with the Nyquist theorem during analog signal sampling. However, the tests performed to assess the robustness of the stability in this prototype are still in process of improvement.

4. Discussion

The Arduino Nano Board performed effectively in the tests with each sensor in its individual test with specific sampling rates for each sensor (see Figure 2, Figure 3, Figure 4, Figure 5 and Figure 6). However, to perform the test with all sensors connected to the same Arduino Nano Board (see Figure 1), the 500 Hz sampling rate was selected because the sampling was performed within the same instruction for all sensors. This is a limitation found in boards based on the ATmega328 microcontroller included in the Arduino Nano Board, where it is not possible to perform two or more different sampling rates. Despite this limitation, it did not represent a problem for the acquisition and transmission stage of the presented device.
Regarding the individual performance of each sensor, the AD8232 board provides a low-noise ECG signal suitable for the conventional literature [8,12]. The EMG Muscle T084 provides a rectified EMG signal, which limits the analysis of the signal morphology. A potential solution to this limitation is to develop the EMG sensor as in [22], where an EMG sensor was developed using the AD8232 chip, which captured the complete morphology of the biosignal while being powered by a 3.3 V source, saving the power of the device. The MAX30102 sensor module performed as expected for SpO2 and HR measurements. However, a limitation of this module is the requirement for stabilization time (approximately 30 s) to provide accurate readings, which may affect the accuracy of the instantaneous measurement. For this inconvenience, other board alternatives that support pulse oximetry measurements will be explored. The measurements obtained with the LM35 sensor were stable. These readings were environmental, since the sensor lacks an ergonomic encapsulation that facilitates body temperature recordings. A possible improvement to this sensor is to create an encapsulation that allows these readings to be taken without compromising the quality of the readings. Finally, the GSR sensor used for the galvanic skin response measurements worked correctly, as shown in its data sheet [20]. A limitation of this work is that it lacks an interface or storage for long-term testing. Although reading, transmission and reception tests were performed to ensure correct measurement, noise measurement tests on each biosignal should be performed in future work.

5. Conclusions

The development of low-cost equipment that allows for the acquisition of biosignals could grant educational and research institutions the access to these technologies. The presented prototype allows the acquisition of ECG, EMG, HR, SpO2, GSR, and body temperature biosignals using AFEs available on the market, while maintaining a development cost below USD 70. Furthermore, the measurements performed by the prototype are conducted at sampling frequencies reported in the literature, as detailed in the methodology section.
Future work will involve the development of a printed circuit board (PCB) with all sensors and microcontroller, which could further reduce the cost of the prototype. In addition, necessary modifications identified in this work will be implemented, such as using other AFE’s boards with better features, implementing an approach that allows two or more sampling rates for sensors, and more rigorous noise and signal quality testing. Finally, a protocol will be established for the acquisition of biosignals from a small group of participants, which will allow researchers to corroborate and validate the precision and accuracy of the prototype.

Author Contributions

Conceptualization, D.C.-G., J.C.D.-T., and J.P.G.-V.; methodology, D.C.-G., J.C.D.-T., E.A.-C., M.A.S.-B. and O.E.B.; validation, D.C.-G., J.P.G.-V. and M.A.R.; formal analysis, J.C.D.-T., D.C.-G.; investigation, D.C.-G., J.C.D.-T.; writing—original draft preparation, D.C.-G., J.C.D.-T., E.A.-C., M.A.S.-B. and O.E.B.; writing—review and editing D.C.-G., J.P.G.-V. and M.A.R.; visualization, M.A.R. and J.P.G.-V. supervision, D.C.-G.; funding acquisition, D.C.-G. and M.A.R.; All authors have read and agreed to the published version of the manuscript.

Funding

This research was funded by Consejo Nacional de Humanidades, Ciencia y Tecnología (CONAHCyT). J.C.D.-T. Scholar fellowship CVU: 1353350, E.A.-C. Scholar fellowship CVU: 1055121, M.A.S.-B. Scholar fellowship CVU: 1290081, and O.E.B. Scholar fellowship CVU: 1057559.

Institutional Review Board Statement

Not applicable.

Informed Consent Statement

Not applicable.

Data Availability Statement

Data are contained within the article.

Acknowledgments

We thank CONAHCyT for the scholar fellowship of J.C.D.-T., E.A.-C., M.A.S.-B. and O.E.B.

Conflicts of Interest

The authors declare no conflicts of interest.

References

  1. Global Challenge for Movement on Mental Health Kicks off as Lack of Investment in Mental Health Leaves Millions Without Access to Services. Available online: https://www.who.int/news/item/07-10-2020-global-challenge-for-movement-on-mental-health-kicks-off-as-lack-of-investment-in-mental-health-leaves-millions-without-access-to-services (accessed on 18 September 2024).
  2. Stress Effects on the Body. Available online: https://www.apa.org/topics/stress/body#:~:text=This+long-term+ong+oing+stress,tie+stress+to+heart+attack (accessed on 18 September 2024).
  3. Santomauro, D.F. Global prevalence and burden of depressive and anxiety disorders in 204 countries and territories in 2020 due to the COVID-19 pandemic. Lancet 2021, 398, 1700–1712. [Google Scholar] [CrossRef]
  4. Mendoza, F.; Valencia, A. Técnicas psicofisiológicas para evaluar el estrés en escenarios clínicos. In Estrés y Salud: Investigación Básica y Aplicada; Viveros, S., Ed.; El Manual Moderno: Mexico City, México, 2012; pp. 73–87. [Google Scholar]
  5. Giannakakis, G.; Grigoriadis, D.; Giannakaki, K.; Simantiraki, O.; Roniotis, A.; Tsiknakis, M. Review on psychological stress detection using biosignals. IEEE Trans. Affect. Comput. 2019, 13, 440–460. [Google Scholar] [CrossRef]
  6. Ahamed, M.A.; Ahad, M.A.-U.; Sohag, M.H.A.; Ahmad, M. Development of low cost wireless biosignal acquisition system for ECG EMG and EOG. In Proceedings of the 2015 2nd International Conference on Electrical Information and Communication Technologies (EICT), Khulna, Bangladesh, 10–12 December 2015. [Google Scholar] [CrossRef]
  7. Ahamed, M.A.; Asraf-Ul-Ahad, M.; Sohag, M.H.A.; Ahmad, M. Development of low cost wireless ECG data acquisition system. In Proceedings of the 2015 International Conference on Advances in Electrical Engineering (ICAEE), Dhaka, Bangladesh, 17–19 December 2015. [Google Scholar] [CrossRef]
  8. Bravo-Zanoguera, M.; Cuevas-González, D.; Reyna, M.A.; García-Vázquez, J.P.; Avitia, R.L. Fabricating a Portable ECG Device Using AD823X Analog Front-End Microchips and Open-Source Development Validation. Sensors 2020, 20, 5962. [Google Scholar] [CrossRef] [PubMed]
  9. Nie, J.; Liu, Y.; Hu, Y.; Wang, Y.; Xia, S.; Preindl, M.; Jiang, X. SPIDERS+: A Light-Weight, Wireless, and Low-Cost Glasses-Based Wearable Platform for Emotion Sensing and Bio-Signal Acquisition. Pervasive Mob. Comput. 2021, 75, 101424. [Google Scholar] [CrossRef]
  10. LM35 Precision Centigrade Temperature Sensors. Available online: https://www.ti.com/lit/ds/symlink/lm35.pdf (accessed on 18 September 2024).
  11. Single-Lead, Heart Rate Monitor Front End. Available online: https://www.analog.com/media/en/technical-documentation/data-sheets/ad8232.pdf (accessed on 18 September 2024).
  12. Ajdaraga, E.; Gusev, M. Analysis of sampling frequency and resolution in ECG signals. In Proceedings of the 2017 25th Telecommunication Forum (TELFOR), Belgrade, Serbia, 21–22 November 2017. [Google Scholar] [CrossRef]
  13. Three-lead Differential Muscle/Electromyography Sensor for Microcontroller Applications. Available online: https://www.pololu.com/file/0J745/Muscle_Sensor_v3_users_manual.pdf (accessed on 18 September 2024).
  14. Toledo-Pérez, D.C.; Rodríguez-Reséndiz, J.; Gómez-Loenzo, R.A.; Jauregui-Correa, J.C. Support Vector Machine-Based EMG Signal Classification Techniques: A Review. Appl. Sci. 2019, 9, 4402. [Google Scholar] [CrossRef]
  15. Bian, F.; Li, R.; Liang, P. SVM based simultaneous hand movements classification using sEMG signals. In Proceedings of the 2017 IEEE International Conference on Mechatronics and Automation (ICMA), Takamatsu, Japan, 6–9 August 2017. [Google Scholar] [CrossRef]
  16. High-Sensitivity Pulse Oximeter and Heart-Rate Sensor for Wearable Health. Available online: https://www.analog.com/media/en/technical-documentation/data-sheets/MAX30102.pdf (accessed on 18 September 2024).
  17. Burma, J.S.; Lapointe, A.P.; Soroush, A.; Oni, I.K.; Smirl, J.D.; Dunn, J.F. Insufficient Sampling Frequencies Skew Heart Rate Variability Estimates: Implications for Extracting Heart Rate Metrics from Neuroimaging and Physiological Data. J. Biomed. Inform. 2021, 123, 103934. [Google Scholar] [CrossRef]
  18. Zhang, X.; Zhang, Y.; Si, Y.; Gao, N.; Zhang, H.; Yang, H. A High Altitude Respiration and SpO2 Dataset for Assessing the Human Response to Hypoxia. Sci. Data 2024, 11, 248. [Google Scholar] [CrossRef] [PubMed]
  19. Reichelt, L.J.; Badiola, I.; Blazek, V.; Leonhardt, S.; Lüken, M. Development of a Ring-Shaped Pulse Oximeter to Analyse Angle Dependency in SpO2 Estimation. In Proceedings of the 51st international Computing in Cardiology conference, Karlsruhe, Germany, 8–11 September 2024. [Google Scholar]
  20. Grove—GSR. Available online: https://www.mouser.com/catalog/specsheets/Seeed_101020052.pdf (accessed on 18 September 2024).
  21. Galvanic Skin Response (GSR): The Complete Pocket Guide. Available online: https://imotions.com/blog/learning/research-fundamentals/galvanic-skin-response/#what-is-gsr-galvanic-skin-response (accessed on 18 September 2024).
  22. Amezquita Garcia, J.A. Aprendizaje automático en los movimientos de los dedos con visualización en Opensim y diseño inalámbrico para la portabilidad en la adquisición de señales de electromiografía. Doctoral Thesis, Universidad Autónoma de Baja California, Mexicali, Mexico, 2022. [Google Scholar]
Figure 1. Biosignal acquisition system connection diagram. (A) Stage A represents to the analog stage, where all sensors collect samples of each biosignal used in the prototype. (B) In Stage B, all signals are converted from analog to digital signal format. (C) Lastly, in Stage C, the signals are transmitted to a PC via Bluetooth.
Engproc 82 00001 g001
Figure 2. Body temperature module. (A) Analog stage. LM35 sensor sampling body temperature. (B) Digital Stage. LM35 sensor connection to Arduino Nano. (C) Data transmission stage. HC-06 Bluetooth device connection for wireless serial transmission.
Engproc 82 00001 g002
Figure 3. ECG acquisition module. (A) Analog stage. Patients surface skin voltage detection with AD8232 board. (B) Digital Stage. AD8232 board connection to Arduino Nano. (C) Data transmission stage. HC-06 Bluetooth device connection for wireless serial transmission.
Engproc 82 00001 g003
Figure 4. EMG acquisition module. (A) Analog stage. Patient muscular electrical activity detection with an EMG Muscle T084. (B) Digital Stage. EMG Muscle T084 connection to Arduino Nano. (C) Data transmission stage. HC-06 Bluetooth device connection for wireless serial transmission.
Engproc 82 00001 g004
Figure 5. HR and SpO2 module. (A) Analog stage. MAX30102 sensor that detects heart rate and oxygen saturation from the user’s finger, (B) Digital Stage. MAX30102 connection to Arduino Nano. (C) Data transmission stage. HC-06 Bluetooth device connection for wireless serial transmission.
Engproc 82 00001 g005
Figure 6. GSR acquisition circuit. (A) Analog stage. Patient electrical conductance of the skin detection with a Grove GSR sensor. (B) Digital stage. GSR sensor connection to Arduino Nano. (C) Data transmission stage. HC-06 Bluetooth device connection for wireless serial transmission.
Engproc 82 00001 g006
Figure 7. Biosignals acquired by the prototype.
Engproc 82 00001 g007
Disclaimer/Publisher’s Note: The statements, opinions and data contained in all publications are solely those of the individual author(s) and contributor(s) and not of MDPI and/or the editor(s). MDPI and/or the editor(s) disclaim responsibility for any injury to people or property resulting from any ideas, methods, instructions or products referred to in the content.

