3.1. Demographic Results
The proportions of respondents were 44% male and 56% female, which did not indicate an obvious gap. People aged 19–24 years old are the largest age group, which might be because the sample is students; the second largest age group is from 25 to 34, which is 25% of the whole sample, and the age group from 45 to 54 accounts for 17% of the sample. This survey did not target individuals under 18 years and over 65 years of age.
Half of the participants were from Beijing, China, and participants from Hunan, China, accounted for approximately a quarter of the total. In third place were participants from abroad. It should be noted that location refers only to the current residence rather than the native place.
Educational attainment was notably high among the sample, with 59.09% holding a bachelor’s degree and 30.68% having postgraduate qualifications. Only 1.14% reported high school as their highest level of education, and none had less than a high school education.
Regarding second language proficiency, the sample demonstrated a diverse range of abilities. The largest groups were those with advanced skills (26.14%) and proficiency (27.27%), while 26.14% were unfamiliar with a second language. Only 3.41% of the sample were monolingual.
3.2. Descriptive Result of AI Perceptions
A descriptive statistical analysis was conducted to better understand the sample’s perception distribution.
Table 1 lists these details.
The analysis of statistical measures provided significant insights into how respondents rated the various categories. The mean scores revealed that the use category, with an average of 2.649, was rated the highest, indicating that the participants found this aspect to be favorable. In contrast, the categories of openness and usefulness had the lowest mean scores of 1.904 and 1.915, respectively, suggesting that respondents perceived these aspects as less satisfactory, potentially reflecting a perception of limited openness and usefulness. The categories Trust1 and Trust2 had mean scores in the middle range at 2.596 and 2.553, respectively, indicating that trust was viewed moderately positively, though with room for improvement.
The standard deviation data provided further insights, particularly regarding the variability of the responses. The usefulness category, with a standard deviation of 1.224, showed the greatest variability in responses, suggesting that while some respondents rated the use aspect highly, others rated it lower. This contrasts with the lower standard deviations observed in openness (0.734) and Trust2 (0.863), which suggests that responses in these categories were more consistent, with respondents agreeing with their assessments of openness and trust.
The skewness values offer another interpretation layer. Both openness and usefulness exhibit positive skewness at 0.485 and 0.659, respectively, indicating that more respondents gave lower scores (closer to 1), although a few respondents rated these categories higher, causing the distribution to shift slightly to the right. Conversely, Trust1 exhibited negative skewness at −0.166, implying that respondents tended to give higher ratings for this category, demonstrating a more positive inclination toward trust. The skewness for use is minimal (0.203), reflecting a symmetrical distribution of responses without a strong tendency toward either lower or higher ratings.
The kurtosis values further clarified the nature of the distributions. The use category, with a kurtosis of −0.904, indicated a flatter distribution of responses, suggesting that values were more evenly spread out with fewer extremes. In comparison, Trust2 (0.296) and openness (0.015) have kurtosis values close to zero, indicating normal distributions with neither extreme outliers nor excessive clustering around the mean. Usefulness (−0.318) shows a slightly flatter distribution, which aligns with the higher standard deviation, reflecting more dispersed responses.
Overall, the data revealed important differences between the categories. Openness and usefulness were rated low and demonstrated positive skewness, indicating that the respondents gave lower ratings, although a few outliers provided higher scores. In contrast, the use category exhibited a higher mean and greater variability in responses, with a more balanced distribution.
The trust categories, particularly Trust1, had moderate ratings, with a tendency towards more positive evaluations, as reflected by its negative skewness. The kurtosis values indicate that the responses to use were more spread out, while the trust categories exhibited more normal distributions. In summary, the analysis suggests that while the use category was rated more favorably with greater variability, openness and usefulness were perceived as lacking, and trust was rated moderately, with respondents leaning toward neutral or slightly positive trust levels.
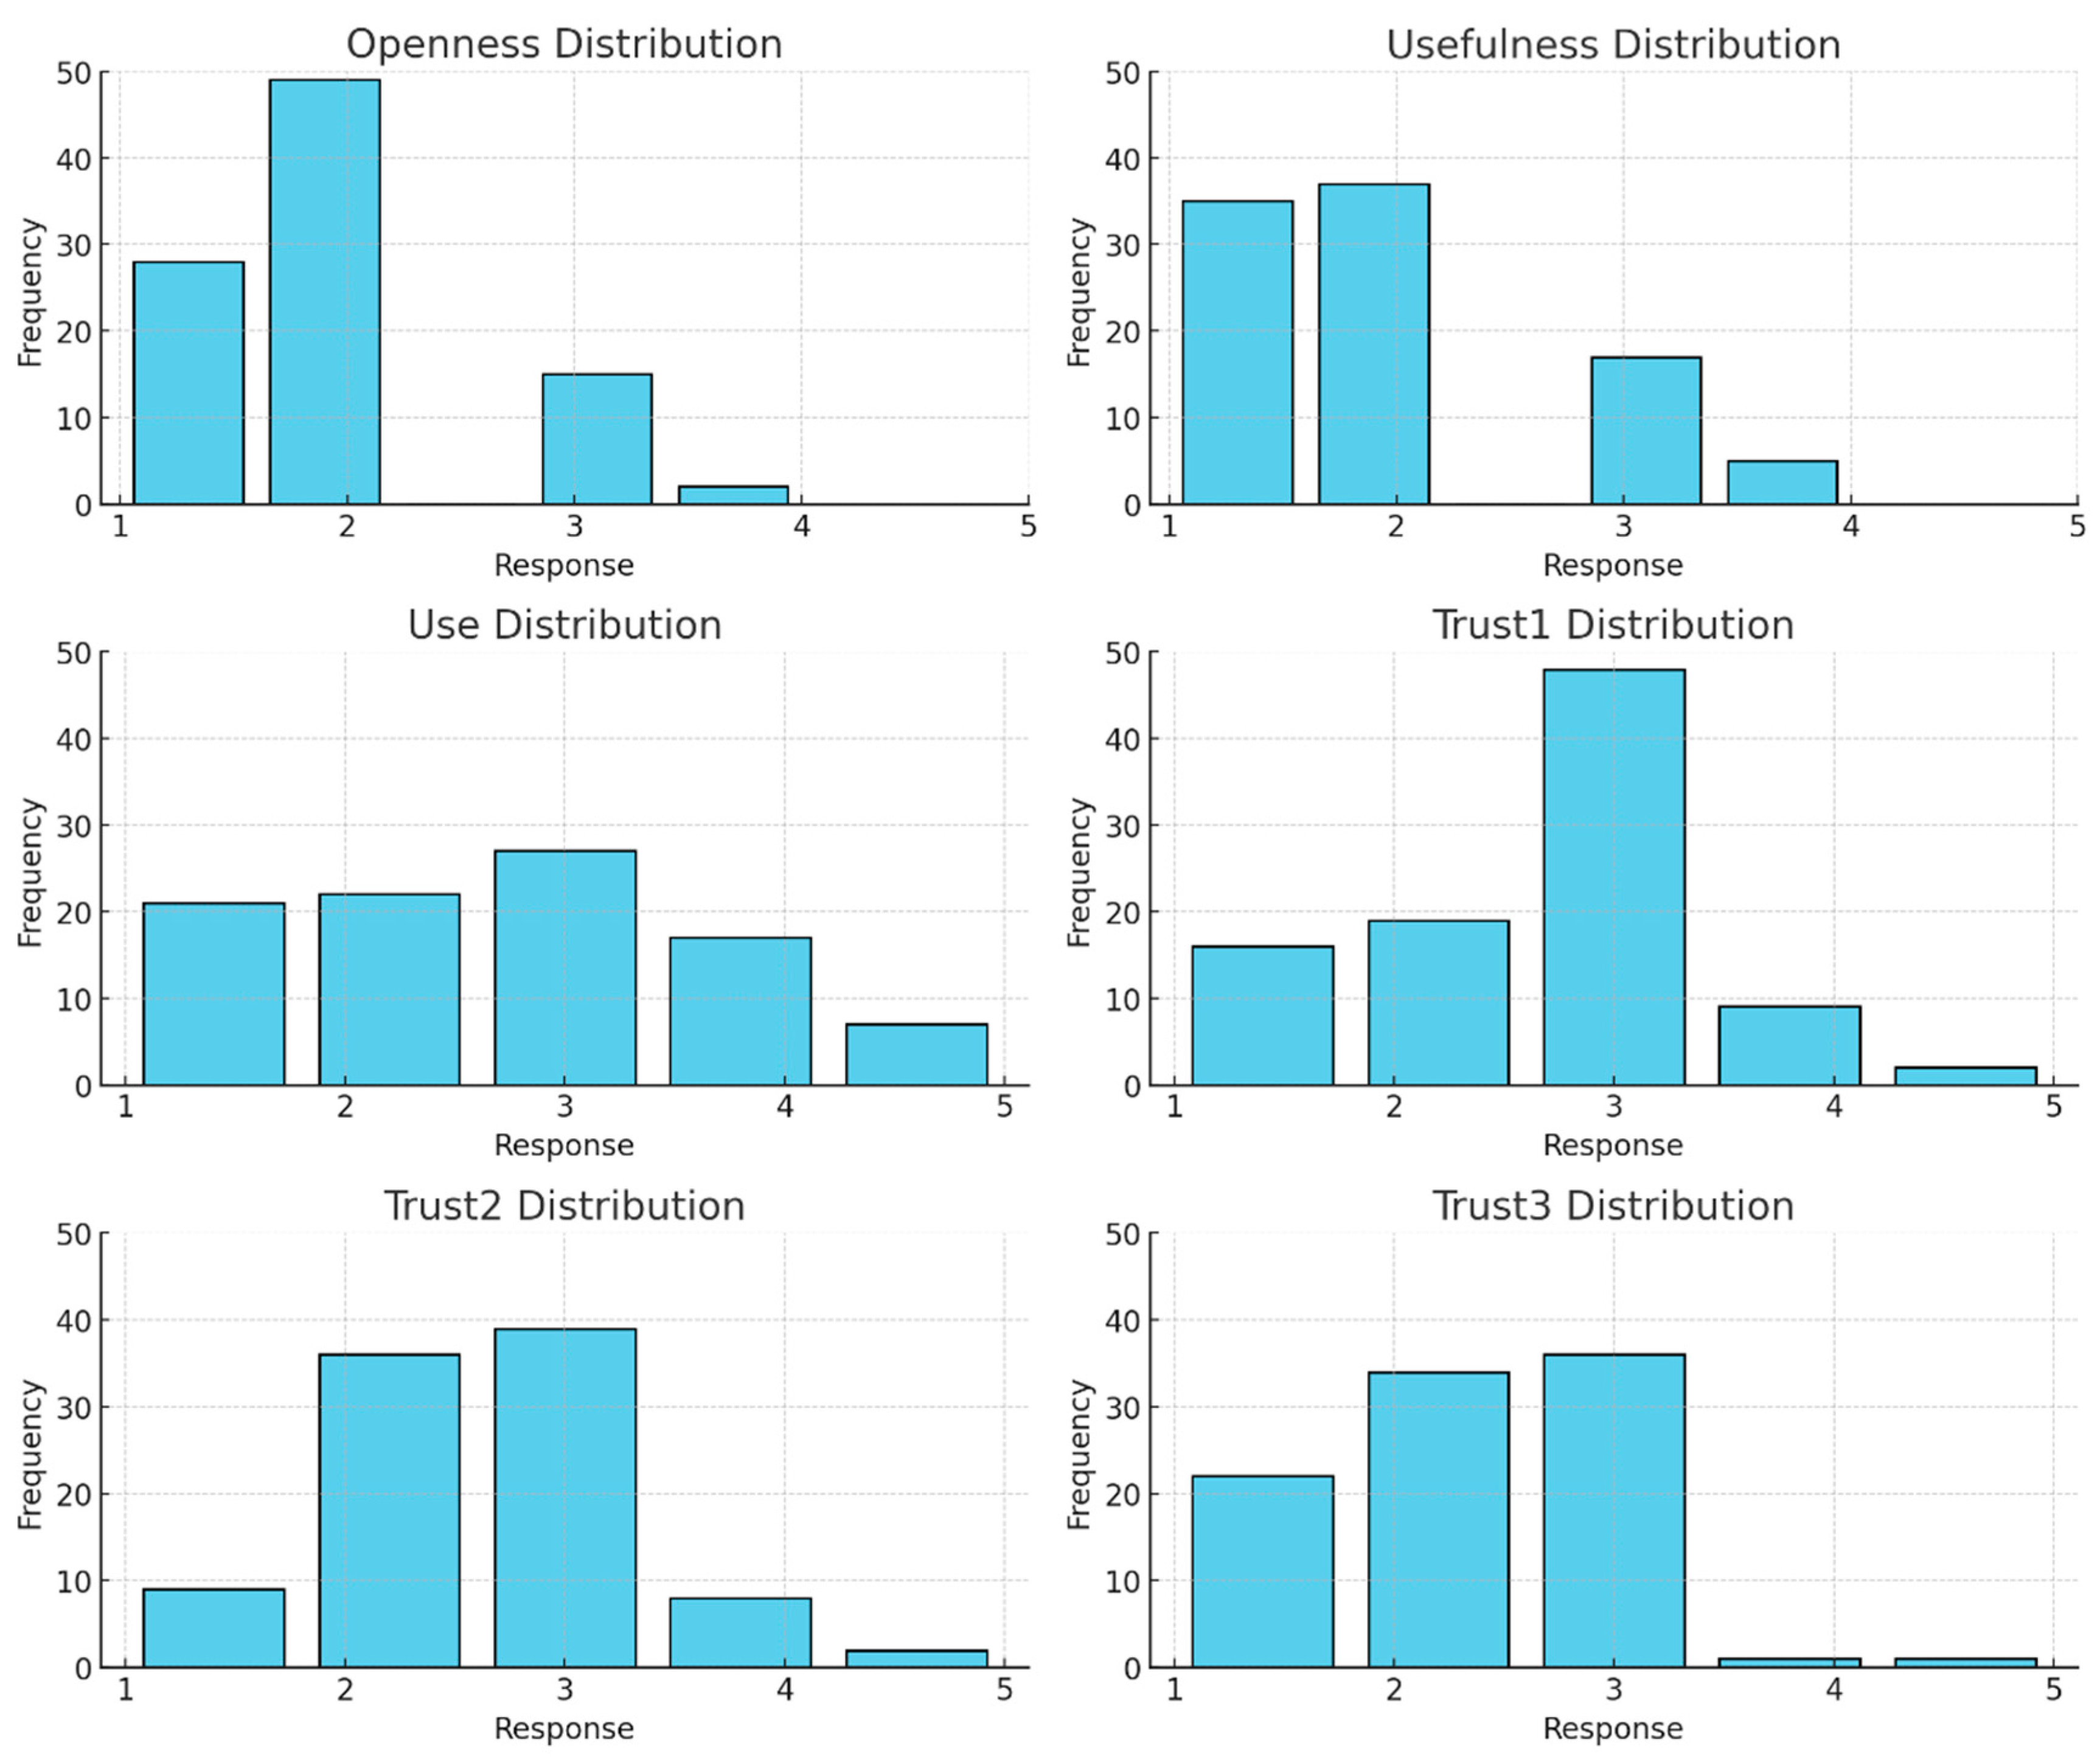
Figure 1 shows the distribution of answers to these six questions, making them more visualizable.
As the histogram shows, most participants had positive perceptions of AI regarding the factors of openness, usefulness, and trust-related questions. None of the questions showed a negative trend for AI perception.
An analysis of the histograms revealed distinct patterns across various categories of participant responses. In terms of the openness distribution, most respondents rated this aspect as a 2, indicating a neutral or slightly closed attitude, with very few high ratings (4 or 5), reflecting overall low openness. Similarly, in the usefulness category, responses clustered around 2, with only a small number of higher scores, suggesting that participants did not perceive the subject as particularly useful.
In contrast, the use distribution displayed a wider spread, peaking around 3, with a greater number of high ratings (4 and 5), indicating more variability and that some respondents found the use aspect favorable. The Trust1 and Trust2 categories peaked at 3, signifying moderate trust, although Trust2 had slightly lower ratings (1 and 2). The Trust3 distribution also peaked at 3 but exhibited a broader spread, with both lower and higher ratings, reflecting more diverse opinions on this aspect of trust.
The key findings highlight low ratings for both openness and usefulness, with most responses concentrated in the 1–2 range, implying limited openness and perceived usefulness. In contrast, use shows a more favorable distribution, with higher ratings suggesting some appreciation of this aspect. Responses related to trust indicate general neutrality, particularly with Trust1, Trust2, and Trust3, which reflect a more varied range of opinions.
Overall, the results suggest that while the use aspect is positively received by some, openness and usefulness are viewed as insufficient, and trust remains moderate, with caution or neutrality prevailing among the respondents.
3.3. Correlation Analysis
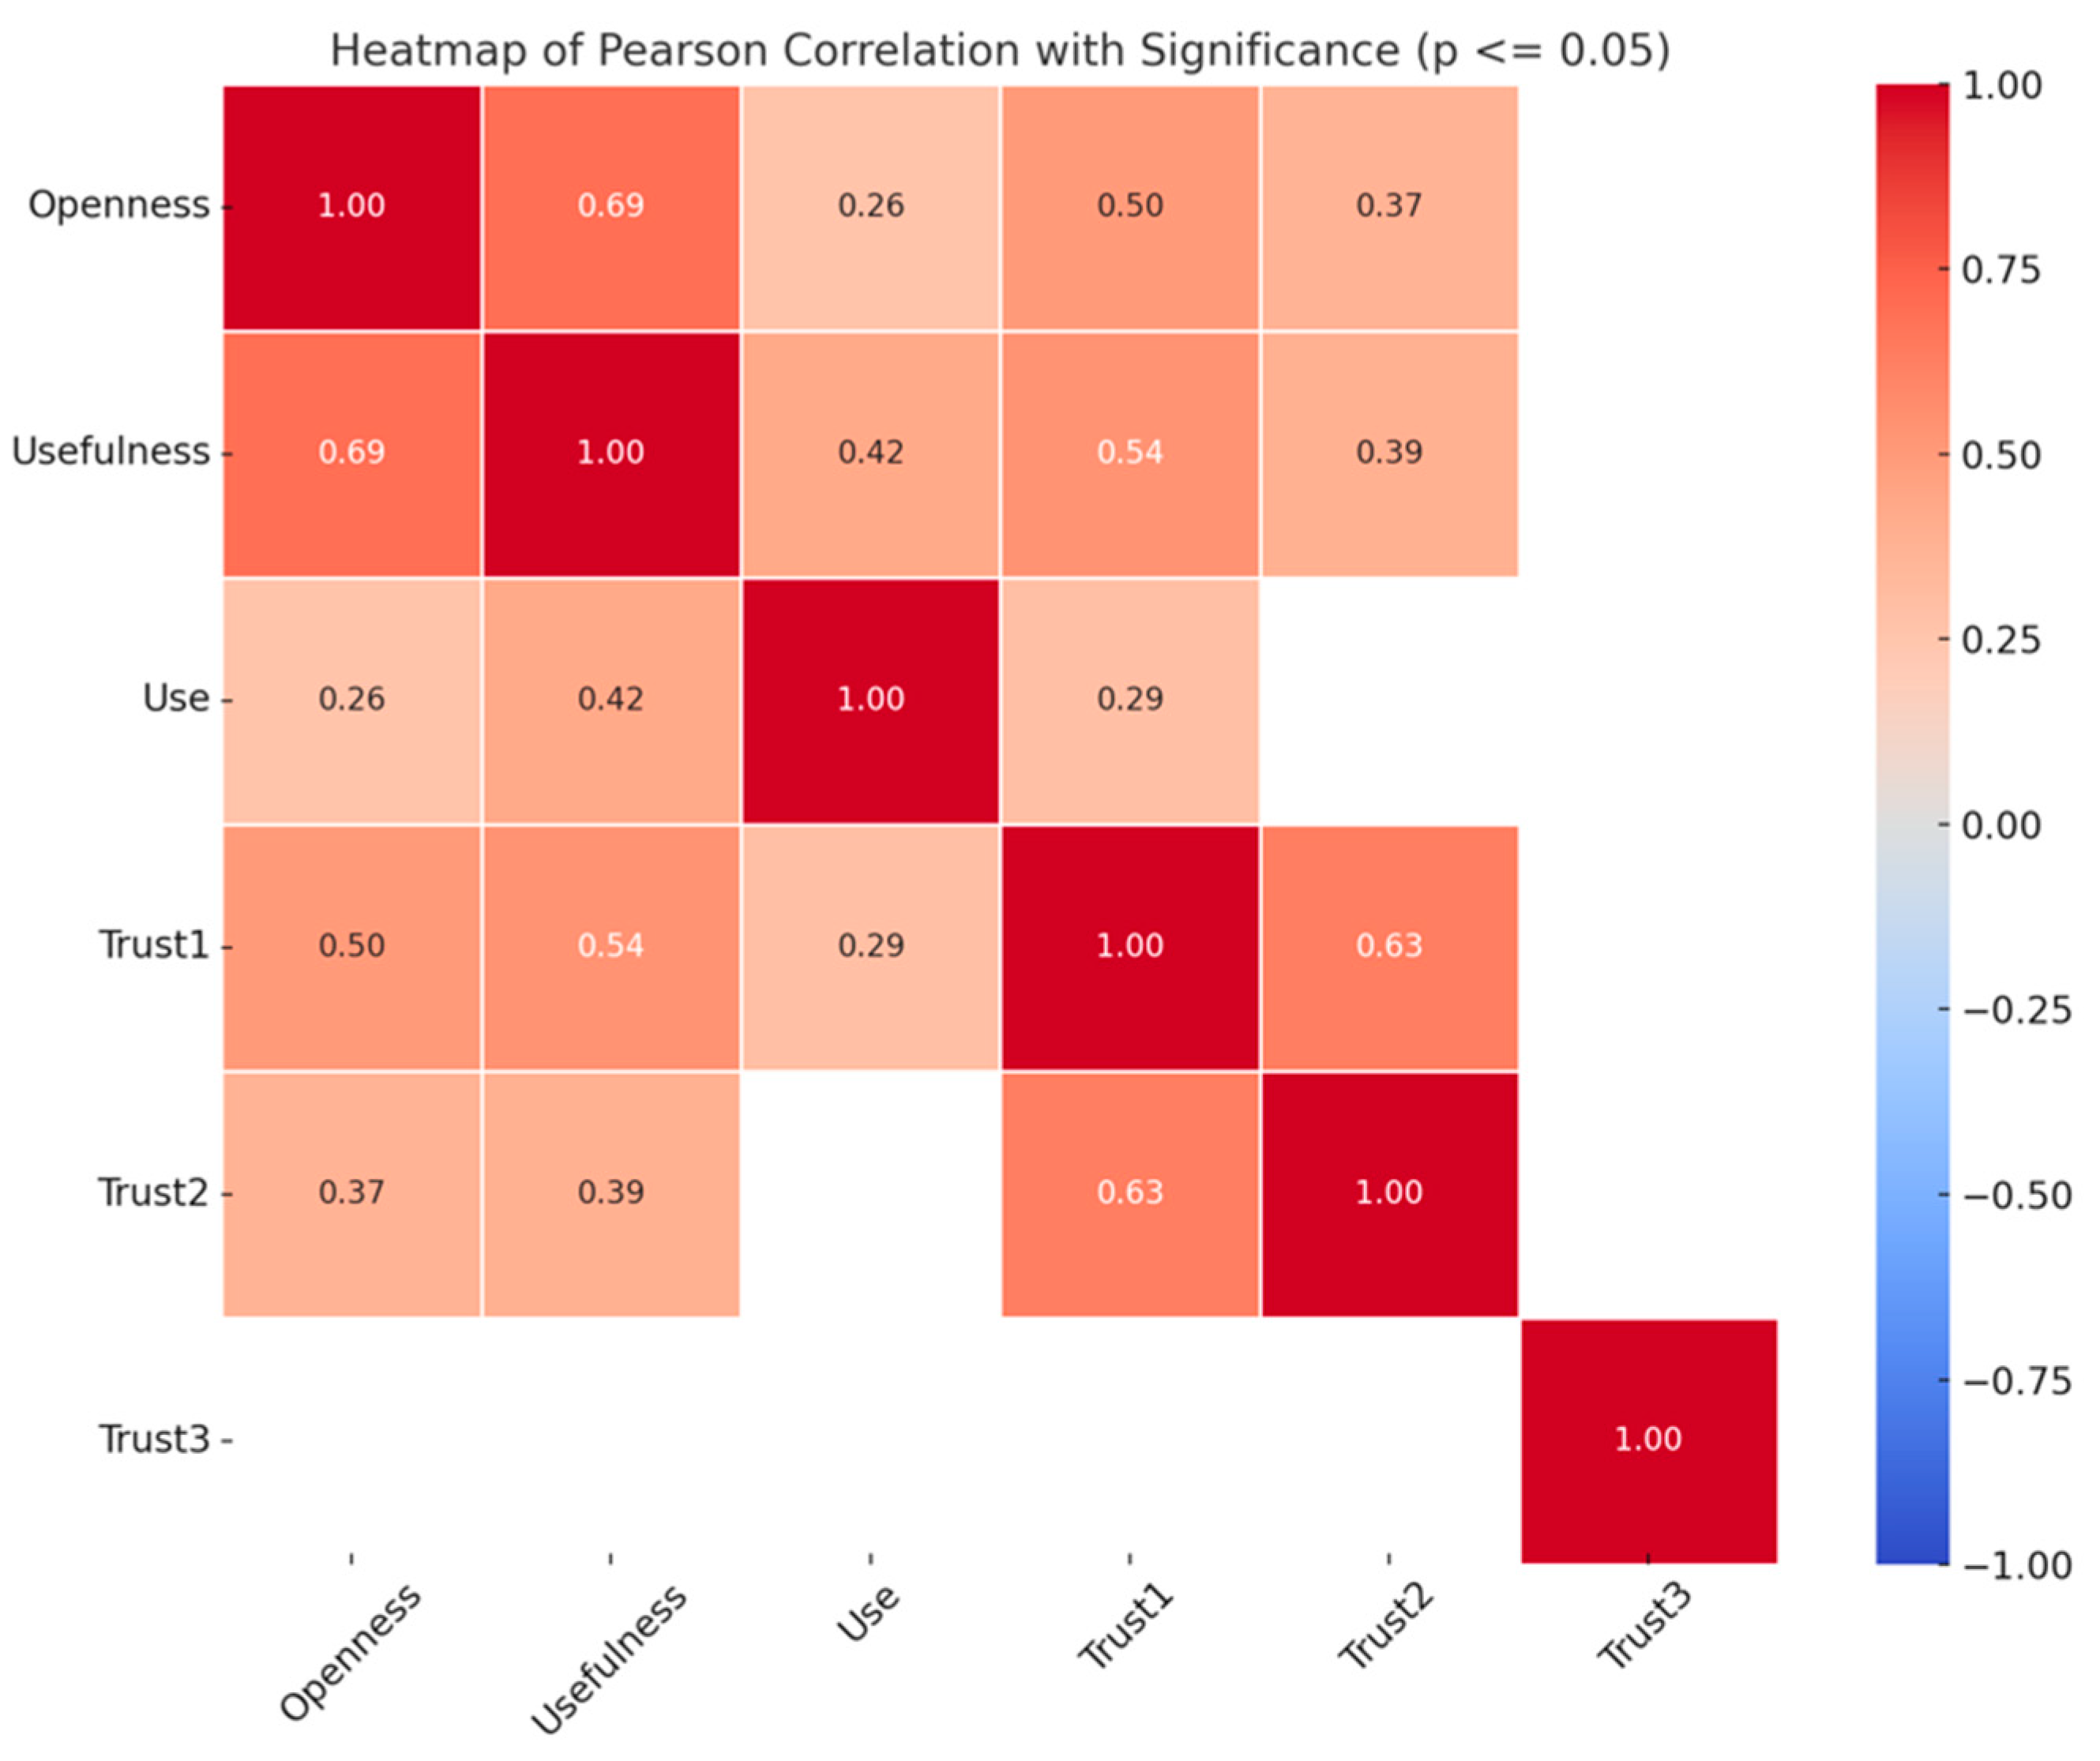
The heatmap of Pearson correlation coefficients, combined with significance testing (p ≤ 0.05), provides detailed insight into the relationships between the survey categories. By categorizing the correlations into strong (over 0.5), moderate (between 0.3 and 0.5), weak (less than 0.3), and no correlation, we can more precisely interpret the relationships between various aspects of the survey.
Figure 2 shows the correlations among these variables.
3.3.1. Strong Correlations (Over 0.5)
Openness and usefulness displayed the highest correlation, with a coefficient of 0.69, indicating a strong positive relationship. This suggests that respondents who rated openness highly were also more likely to find the subject to be useful. The strength of this correlation points to the consistent perception that openness and usefulness are linked constructs in respondents’ minds. The overlap in these two dimensions could reflect a broader trend in how openness toward the subject correlates with its perceived utility, meaning that individuals who felt more open to the subject were also more inclined to find it beneficial.
Similarly, Trust1 and Trust2 had a Pearson correlation coefficient of 0.63, which is another strong positive relationship. This demonstrates a relatively high level of consistency in how respondents evaluated trust across these two categories. Trust in one area of the survey was highly predictive of trust in another, which could imply that trust is a global perception for respondents, extending across different facets of the subject. This strong correlation between the trust variables highlights that trust, once established in one domain, tends to propagate across other related areas.
3.3.2. Moderate Correlations (Between 0.3 and 0.5)
Several moderate correlations were found between variables. First, Openness and Trust1 (0.50) showed a moderately positive relationship, indicating that participants who were more open to the subject tended to express more trust. While this correlation is not as strong as between openness and usefulness, it nonetheless suggests that openness fosters a moderate level of trust.
Similarly, usefulness and Trust1 (0.54) also exhibited a moderate-to-strong relationship, further supporting the idea that participants who found the subject useful were more likely to trust it. These moderate correlations between trust and both openness and usefulness suggest that the more positively respondents perceived the subject in terms of its utility and openness, the more trust they extended toward it.
Another moderate correlation was observed between usefulness and use (0.42). This relationship indicated that those who found the subject useful were moderately more likely to appreciate its application or usage. However, the correlation does not suggest that all respondents who found the subject useful saw its use positively, implying that usefulness and practical application, while related, were distinct enough in the respondents’ perception that other factors may influence how use is evaluated.
Openness and use (0.26) indicate a weaker end of the moderate category. This suggests that, while openness and use are related, openness does not strongly predict how respondents feel about the practical use of the subject. This weak correlation implies that, while some overlap exists between respondents’ openness to the subject and their evaluation of its use, these are independent dimensions in terms of how they are perceived.
3.3.3. Weak Correlations (Less than 0.3)
The category of use demonstrated weak correlations with the other categories. The relationship between use and Trust1 (0.29) reflects that, while there is some connection between how respondents rated use and their level of trust in the subject, it is weak. This weak relationship suggests that the practical application of the subject, as perceived by the respondents, does not heavily influence their level of trust in it.
Other weak correlations can be observed between openness and Trust2 (0.37) and usefulness and Trust2 (0.39). These figures suggest that openness and usefulness moderately influence trust in the second trust-related category, but the relationship is not as strong as in Trust1. This distinction may indicate that the second trust category reflects a slightly different aspect of trust that is not directly linked to openness and usefulness.
3.3.4. No Correlation
The blank areas in the heatmap, especially involving Trust3, indicate that there was no significant correlation between Trust3 and any of the other variables, such as openness, usefulness, use, or Trust1 and Trust2. This lack of correlation suggests that Trust3 measures a distinct aspect of trust that is unrelated to the other dimensions evaluated in the survey. This may indicate that respondents viewed this trust-related question as capturing a separate or more nuanced aspect of trust that does not align with their perceptions of openness, usefulness, or use.
Similarly, the blank space between use and Trust2 highlights no significant relationship between these two variables. This suggests that the respondents’ perceptions of the use aspect and their trust in the subject (as measured by Trust2) are independent. The practical application of the subject does not appear to influence respondents’ trust in the subject, at least in terms of how Trust2 was measured.
3.3.5. Overall Interpretation
The heatmap provided valuable insights into the relationships between different survey categories. The strongest correlations were observed between openness and usefulness, as well as between Trust1 and Trust2, indicating close alignment between openness and perceived usefulness and consistency in trust-related responses across different trust dimensions. Moderate correlations between usefulness and both trust and use aspects suggest that, while usefulness influences trust and use, these relationships are not as dominant.
Weak correlations involving use imply that practical application is not a key driver of trust or openness in the respondents’ minds, and the blank areas in the heatmap reveal that Trust3 and use in relation to Trust2 are independent of other survey dimensions. This lack of correlation suggests that respondents may view Trust3 and some aspects of trust as distinct from their overall evaluations of openness, usefulness, and use.
In conclusion, the analysis shows that while certain dimensions, such as openness, usefulness, and trust, are strongly interrelated, practical application (use) and more nuanced trust aspects (Trust3) are less connected to these dimensions. This suggests that improving respondents’ perceptions of openness and usefulness could enhance their overall trust, but distinct strategies may be needed to address more practical aspects of use and other specific trust-related concerns.


 ,
, 
