Abstract
Through on-site research and the measurement of typical airport terminals, first-hand data are obtained. Based on actual operation data verification, the comprehensive use of measured data, and refined simulation research methods, we summarize the problems in the operation of typical airport buildings, find the reasons for the deviation between the goal and effect of “space quality and power supply” in the design, and establish a post-evaluation method.
1. Introduction
The airport is a typical public transportation building with high physical environment quality requirements and high operating energy consumption. At the same time, it is also a large-scale building that is difficult to design, and its construction can easily produce large deviations between design goals and operation effects. Under the increasingly obvious trends of resource and environmental constraints, the construction of a green and sustainable airport with high efficiency and low energy consumption is the inevitable direction of airport construction in the future. In order to respond to the national strategic development needs of green carbon reduction, we compare the country’s requirements for the construction of “four-type airports” in order to improve the problem of mismatch in the design and operation of the airport and to solve the problems of industry design and operation. Working based on the post-evaluation and research of building use, the operation performance effect, and actual data analysis, we investigate the architectural design of the airport. The operation puts forward more refined improvement suggestions to promote the efficient matching of the design objectives and the operation effects of the airport.
This study aims to establish the problems existing in space environment quality and the energy consumption of typical airports based on actual test and research data, establish a post-evaluation method system and data database of typical airports, and provide data support for the improvement of building performances. On the basis of analyzing the current situation of the airport, according to the key points of building performance optimization, diagnostic methods and solutions for the design of existing airport buildings are proposed in order to provide useful guidance for the renovation of airports and the construction of new airport projects.
The Current Situation of the Post-Terminal Evaluation System
Most of the current post-construction evaluation system research is aimed at office buildings, residences, hospitals, etc., and at large-scale transportation buildings, especially airport terminals. There are relatively few studies on the establishment of post-evaluation systems. Although the existing studies have carried out research and testing on different terminals, the relevant research focuses on the subjective evaluation of terminal users and the unilateral research of building functional space [1], and has not carried out systematic evaluation research on terminals, including building use, building physical environment quality, and the building energy use effect. There are doubts about the applicability of different climate zones in China, and there are also some shortcomings in research on the use of buildings [2].
In recent years, the domestic civil aviation transportation field has developed rapidly, resulting in the annual growth of passenger volume and climate change [3]. The survey data cannot fully reflect the current real energy consumption level and physical environment of terminals. Taking the T3 terminal of Shenzhen Bao’an International Airport as an example, the annual passenger throughput was 30 million when it was put into use in 2013, and the passenger throughput exceeded 52 million in 2023. Therefore, it is necessary for the design of the terminal to supplement and update the energy consumption and physical environment data of the terminal, expand the data dimensions, and increase the test parameters and subdivision [4].
Although research studies and tests of different terminals have been carried out and are available in the existing literature, there is still relatively little systematic research work on the post-evaluation of the airport terminal. In particular, there is a lack of evaluation and research work that takes into account the use of the terminal building, the quality of the physical environment of the building, the energy effect of the building, and the indoor ring. The interaction between environmental factors is still unclear, especially considering the individual differences between different user groups in the airport, and there is still no objective reference basis for environmental operation and maintenance. Therefore, using past experience, this study combines post-evaluation with typical traffic building and terminal architectural design, and establishes a post-evaluation method system and data database of typical airport terminals from multiple comprehensive dimensions, such as spatial characteristics, usage, and the physical environment, and from subjective and objective evaluation.
2. Development of Research Questions
2.1. Selection of Research Subjects
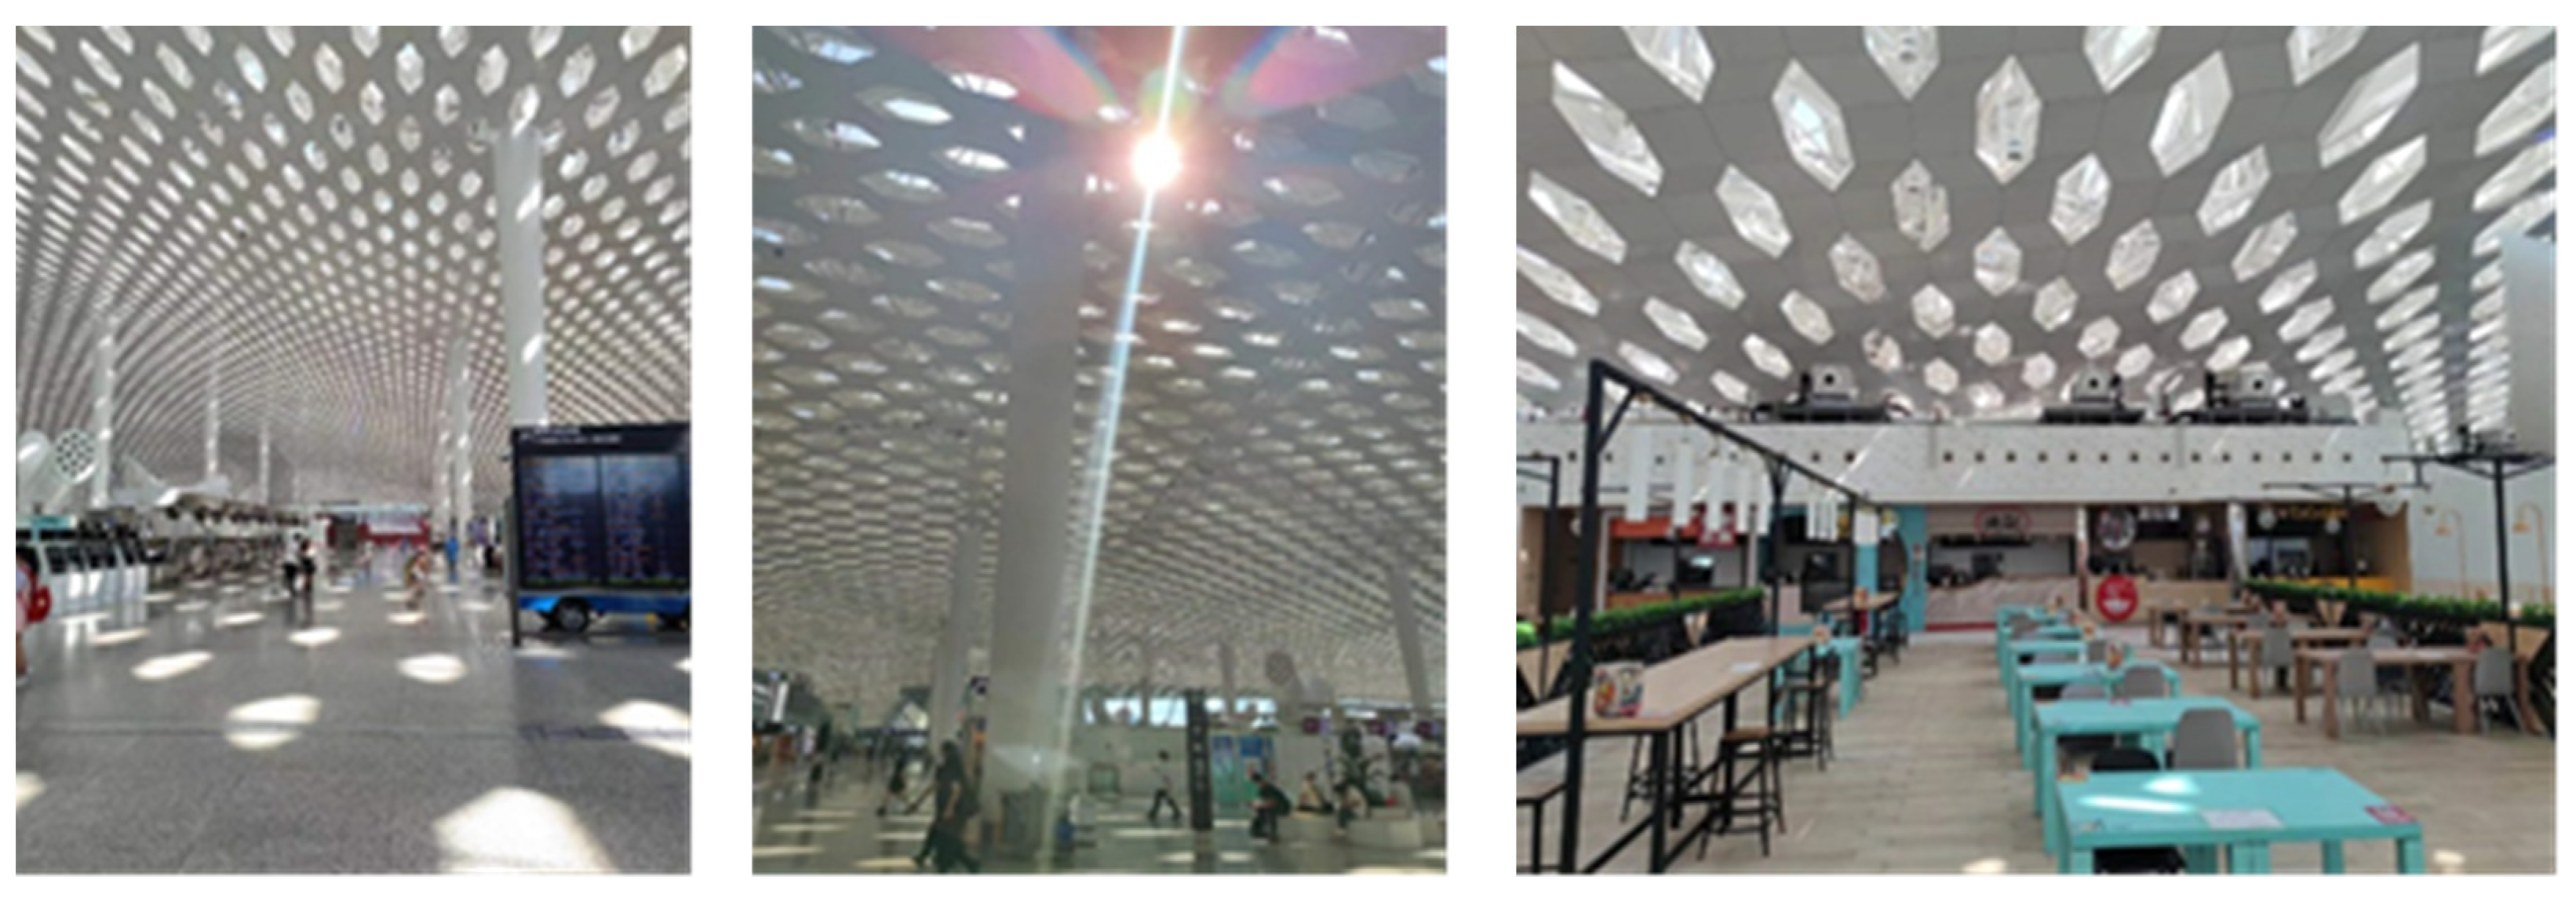
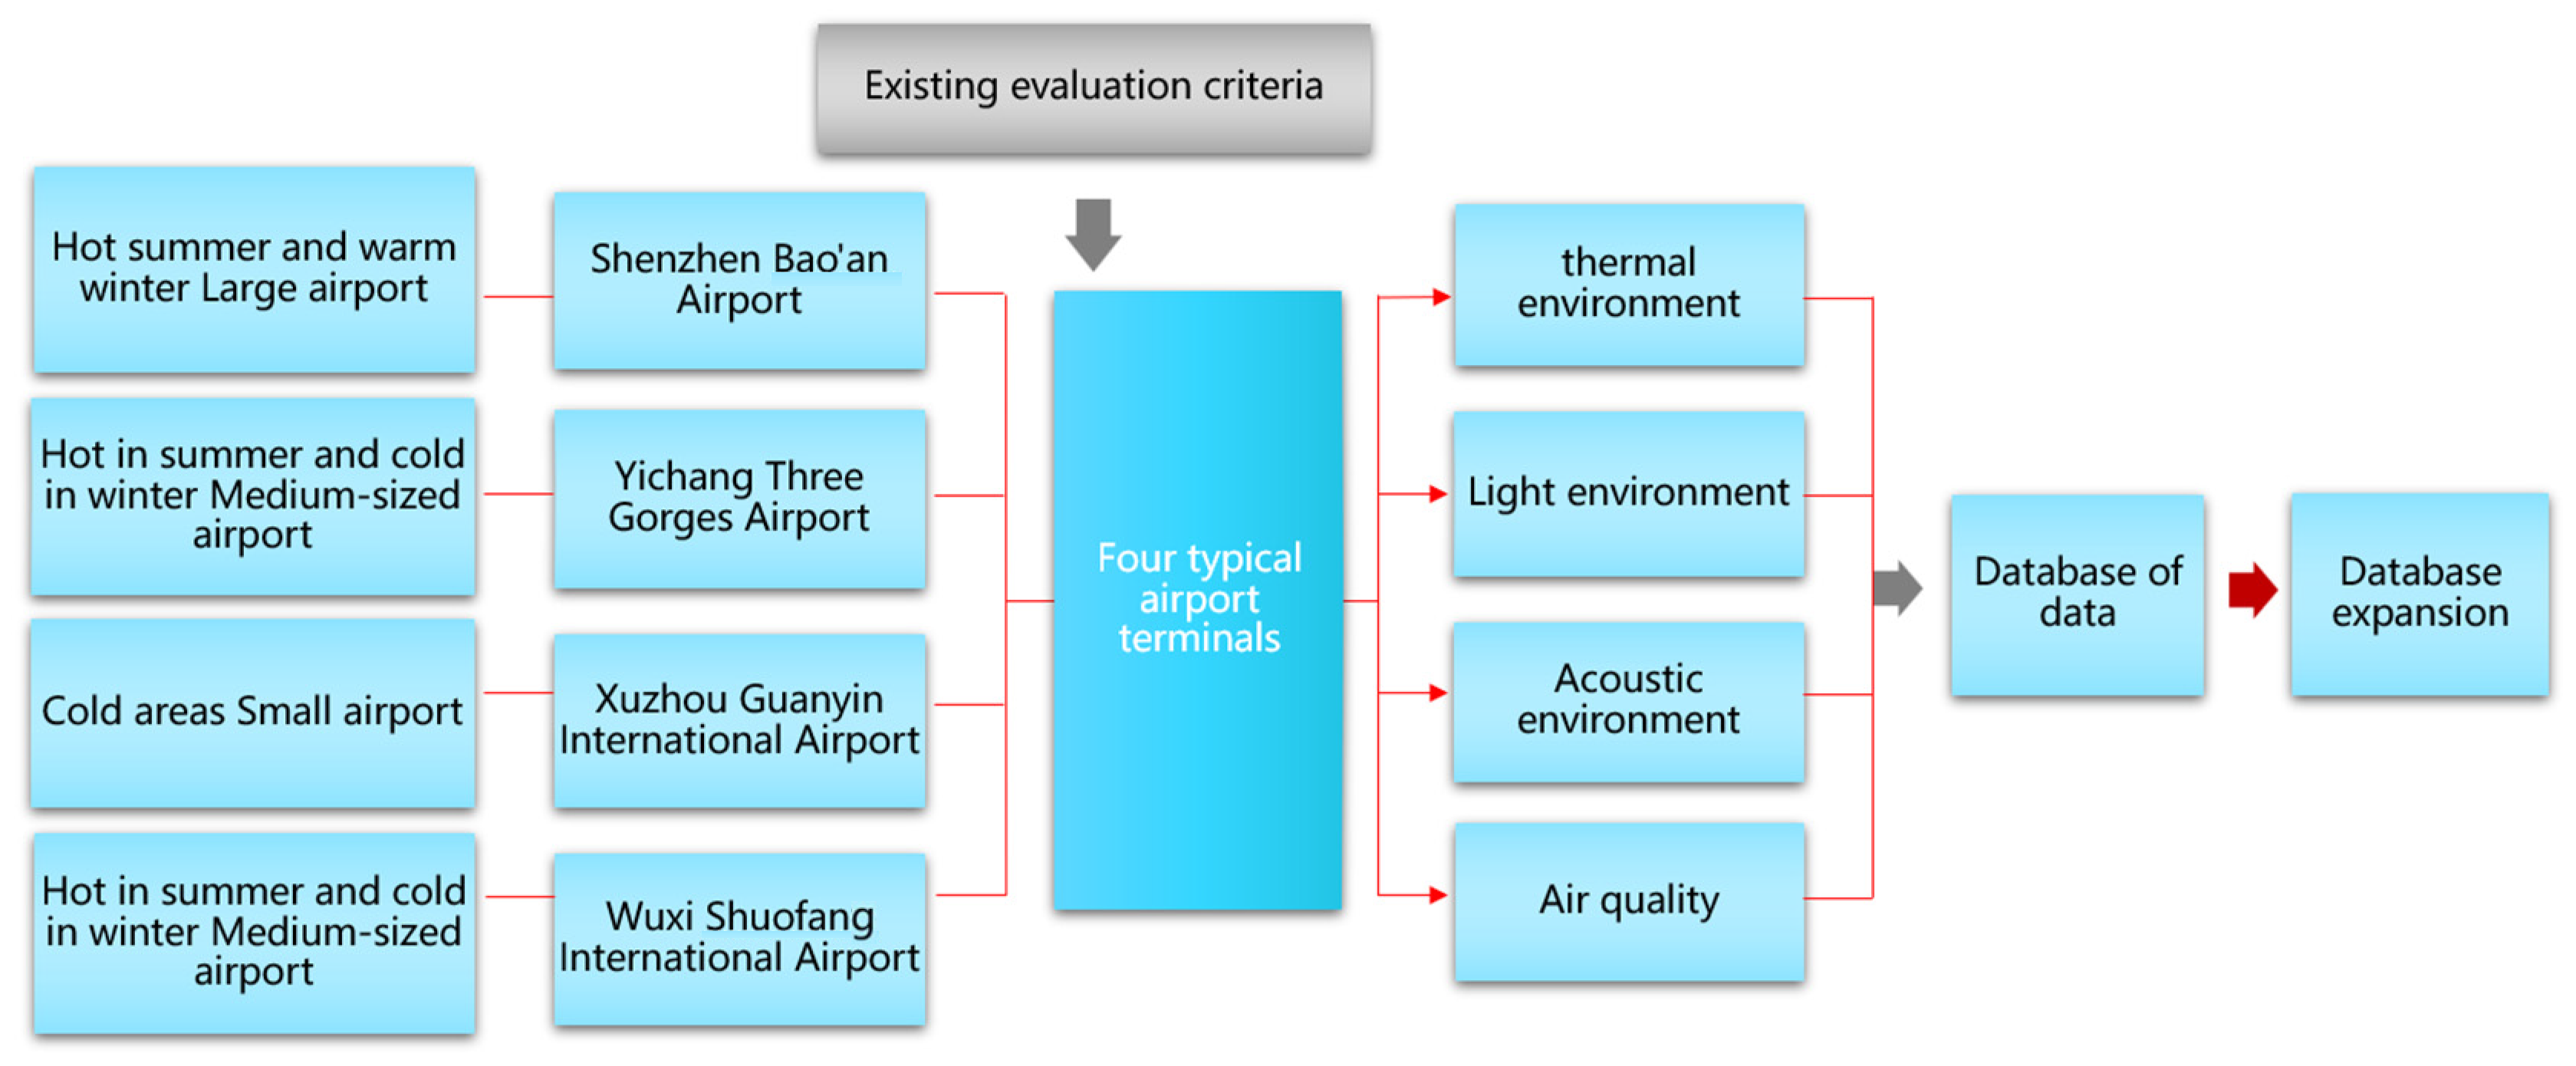
This topic conducts on-site research and the analysis of four airports in different climate zones. As shown in Figure 1, they are Terminal T3 of Shenzhen Bao’an Airport, Terminal T2 of Yichang Three Gorges Airport, Terminal T2 of Xuzhou Guanyin International Airport, and Terminal T2 of Wuxi Shuofang International Airport. Among them, the T3 terminal of Shenzhen Bao’an Airport is located in an area with a hot summer and warm winter, the T2 terminal of Yichang Three Gorges Airport and the T2 terminal of Wuxi Shuofang International Airport are located in areas with a hot summer and cold winter, and the T2 terminal of Xuzhou Guanyin International Airport is located in a cold area. Table 1 summarizes the basic information of the four target airports.
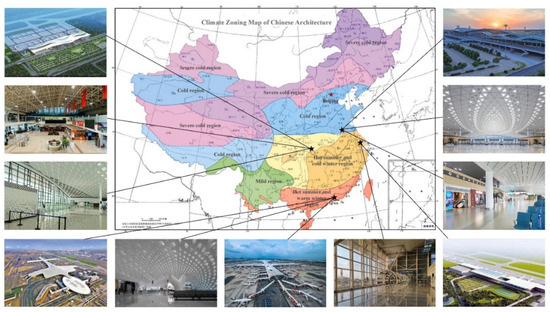
Figure 1.
Research airport selection.

Table 1.
Research the basic information of the target airport.
2.2. Research Program Formulation
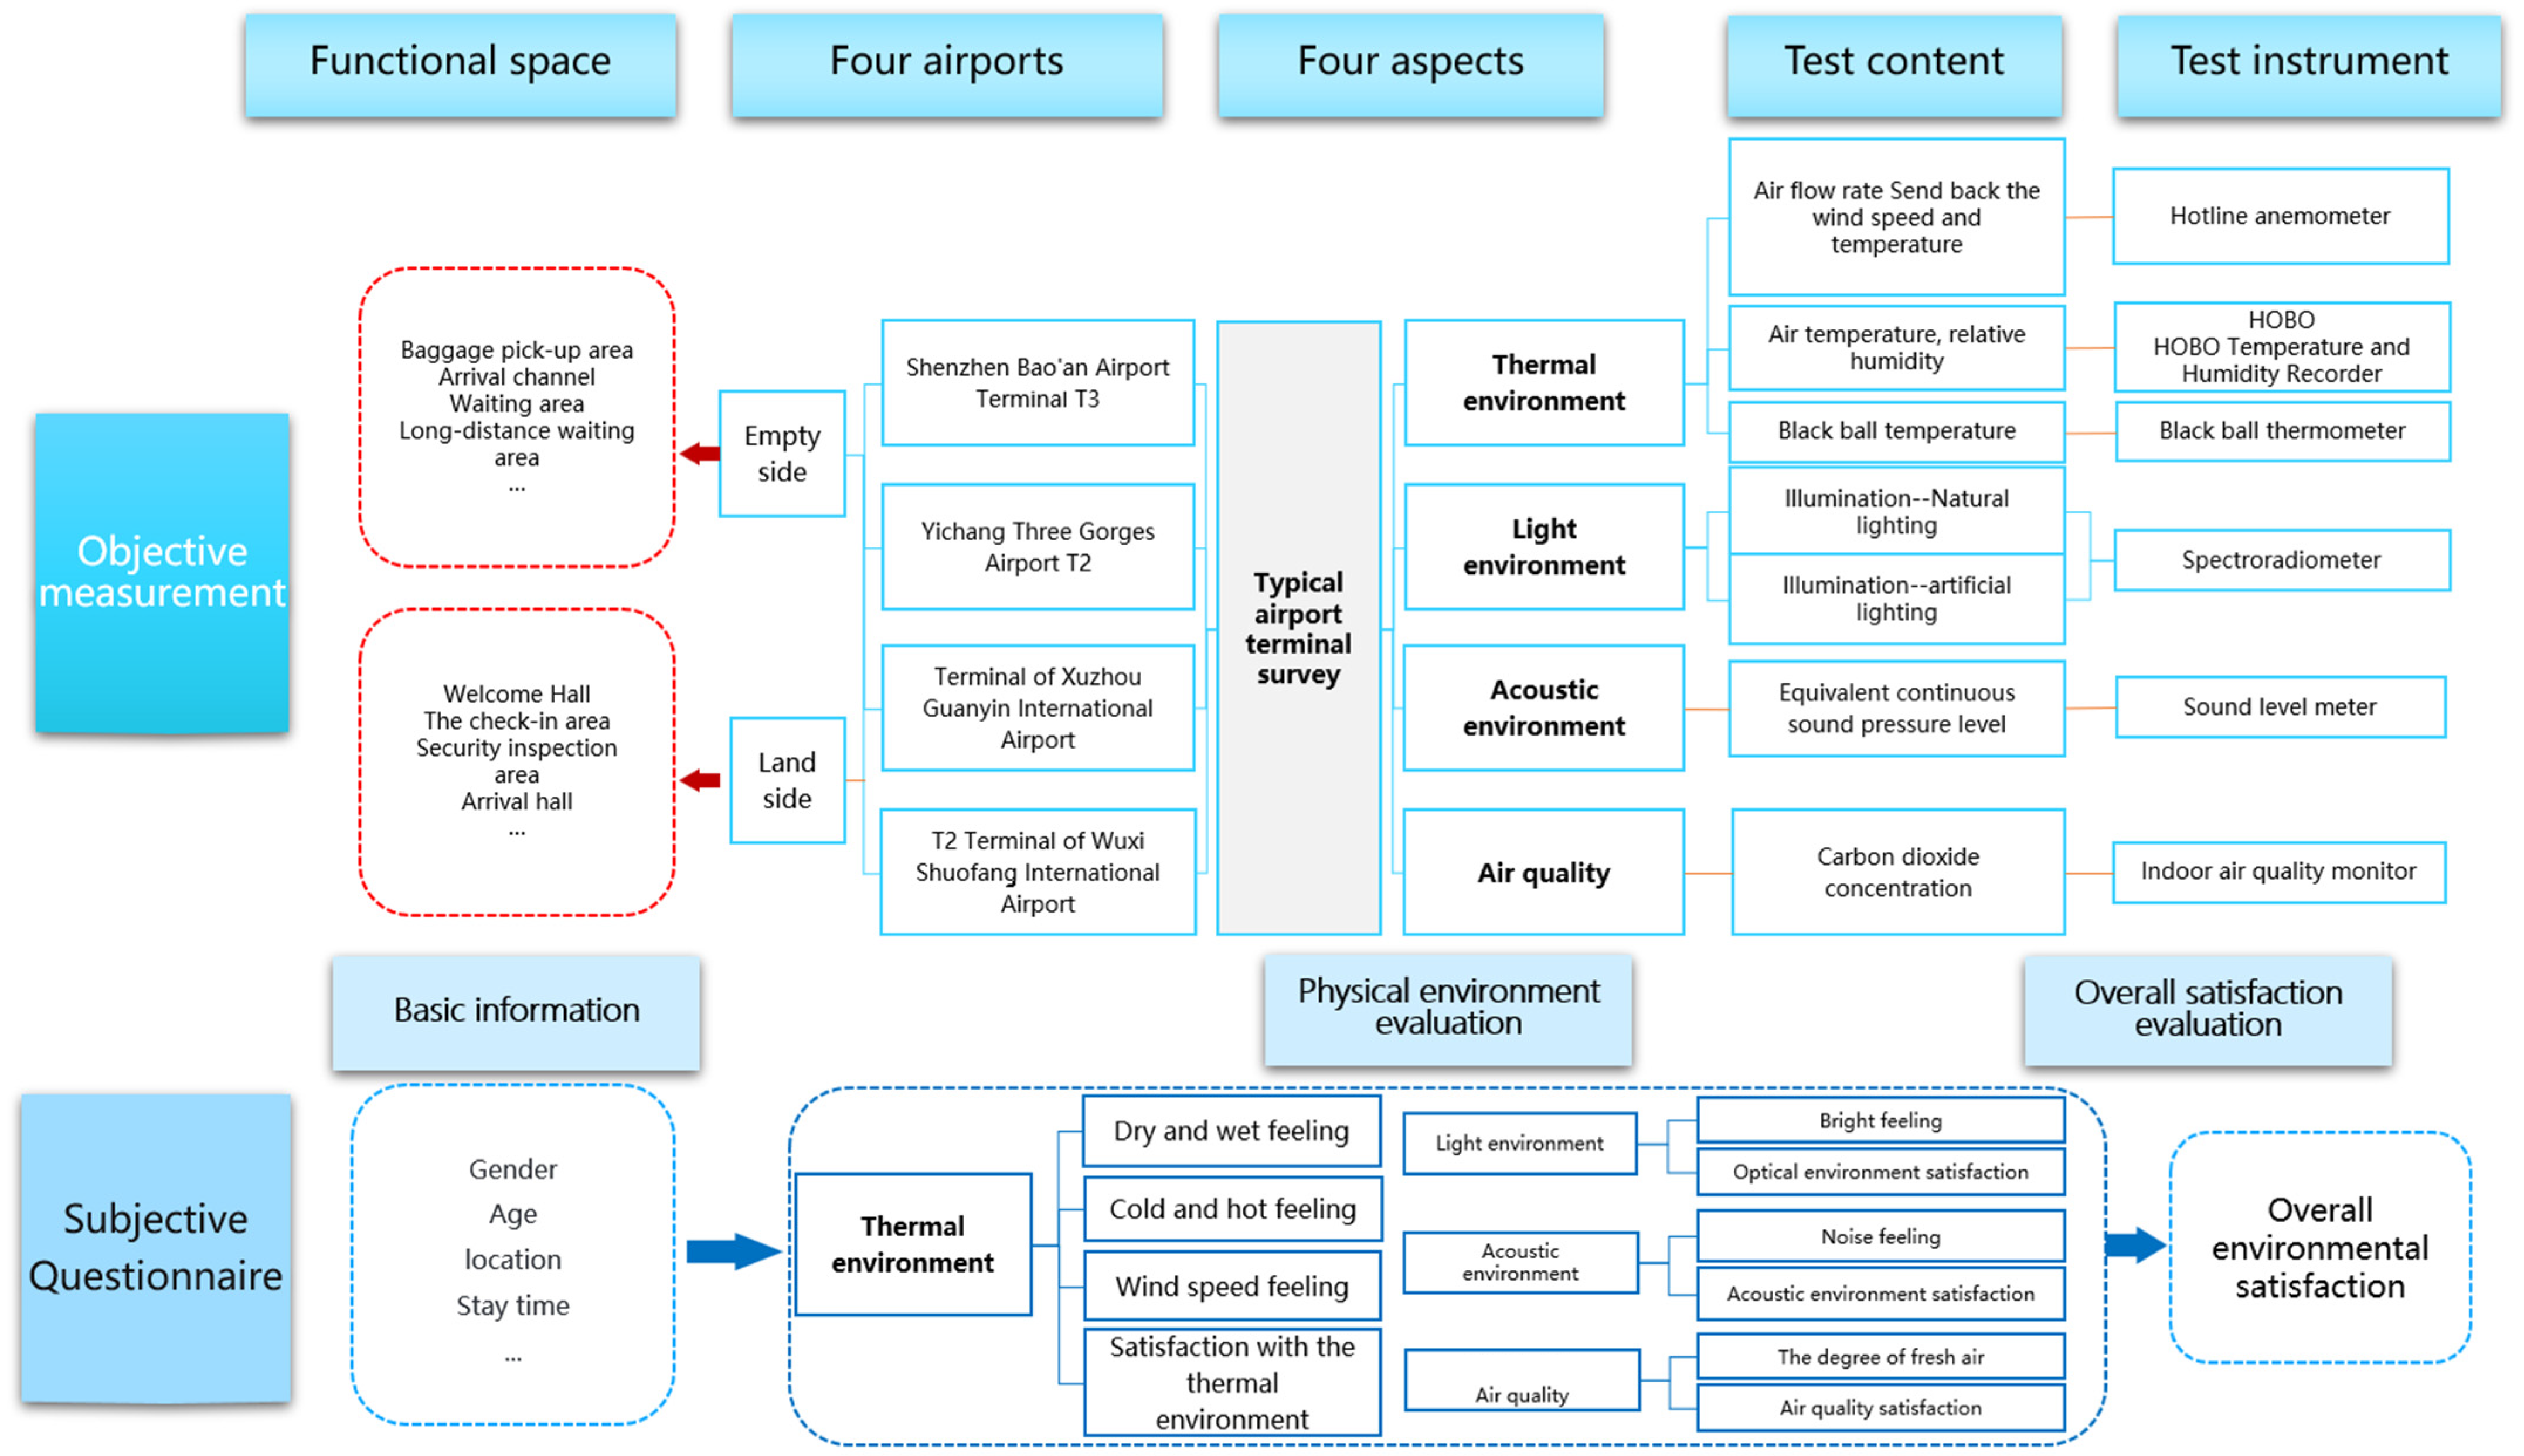
Considering the differences between seasons and high and low peak passenger flow, the research conditions of a single-seater airport are divided into summer and winter. The main research content includes two parts, namely, the actual measurement of the objective physical environment of the terminal and the subjective questionnaire-based evaluation of passengers. Among them, the actual measurement of the specific objective physical environment involves monitoring the thermal environment in many circulation spaces, such as the check-in hall, the terminal hall, the luggage collection hall, the welcome hall, the security hall, etc. This includes the parameters of air temperature, relative humidity, black ball temperature, and air flow rate. The main parameter of the light environment test is working face illuminance; the test of the acoustic environment mainly includes the equivalent A weighted noise level, reverberation time, and language clarity. Figure 2 summarized the main formulation of the research [5].
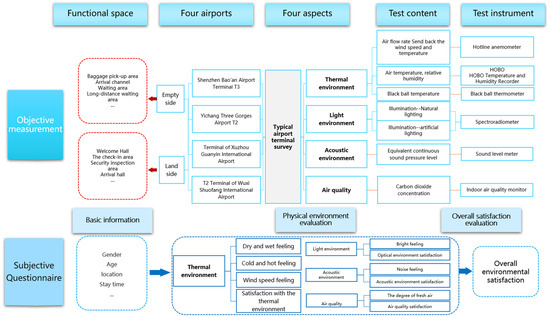
Figure 2.
A schematic diagram of the research plan.
2.3. Research and Measurement Methods
According to the actual needs of the research, the research group formulates the corresponding research plan and adopts a combination of subjective and objective methods to carry out the evaluation work. Data related to the use and operation status of the terminal are obtained through on-site measurement. A combination of interviews and questionnaires is used to obtain a preliminary understanding of the overall use status of selected typical airport terminals. Through in-depth interviews, we can fully understand the use of the internal space of the building and the overall energy consumption of the building. This information can be combined with the questionnaire to understand the evaluation and satisfaction of airport passengers and staff regarding the use of the building. Finally, based on the current physical environment evaluation standards of the airport, the physical environment results are objectively evaluated. Combined with the subjective evaluation results of the existing physical environment by some passengers, the comprehensive subjective and objective evaluation results of the physical environment are obtained. This information is used as a detailed diagnosis of the existing problems of the building physical environment [6].
2.4. Research Content
The whole research content consists of two parts: objective testing and subjective investigation. These parts are carried out in relation to four aspects: the thermal environment, light environment, acoustic environment, and air quality in the airport terminal [7,8]. The details are as follows:
- (1)
- Objective test
- (A)
- Thermal environment: specific indicators include air temperature, relative humidity, radiation temperature, air flow rate, air conditioning wind speed, and temperature.
- (B)
- Light environment: specific indicators include the indoor illuminance distribution of natural lighting/artificial lighting conditions.
- (C)
- Sound environment: the specific indicator is the sound pressure level.
- (D)
- Air quality: the specific indicator is the indoor CO2 concentration.
- (2)
- Subjective investigation
The questionnaire is distributed through on-site electronic questionnaires, specifically targeting people of different ages and genders, so as to understand their assessment of the indoor environmental quality of the airport. Among subjects, a distinction is also made between staff and passengers in the design of the questionnaire. The specific questionnaire assessment includes the following 6 parts and enables the corresponding respondents to evaluate items based on the 7-level scale (−3, −2, −1, 0, 1, 2, 3):
- (A)
- Basic information: gender, age, location, length of stay, etc.
- (B)
- Thermal environment: dry and wet feeling, hot and cold feeling, wind speed, and overall satisfaction with the hot environment.
- (C)
- Light environment: bright feeling and overall satisfaction with the light environment.
- (D)
- Acoustic environment: overall satisfaction with noise and the acoustic environment.
- (E)
- Air quality: air freshness and overall satisfaction with air quality.
- (F)
- Overall satisfaction evaluation: overall environmental satisfaction.
2.5. Research Route
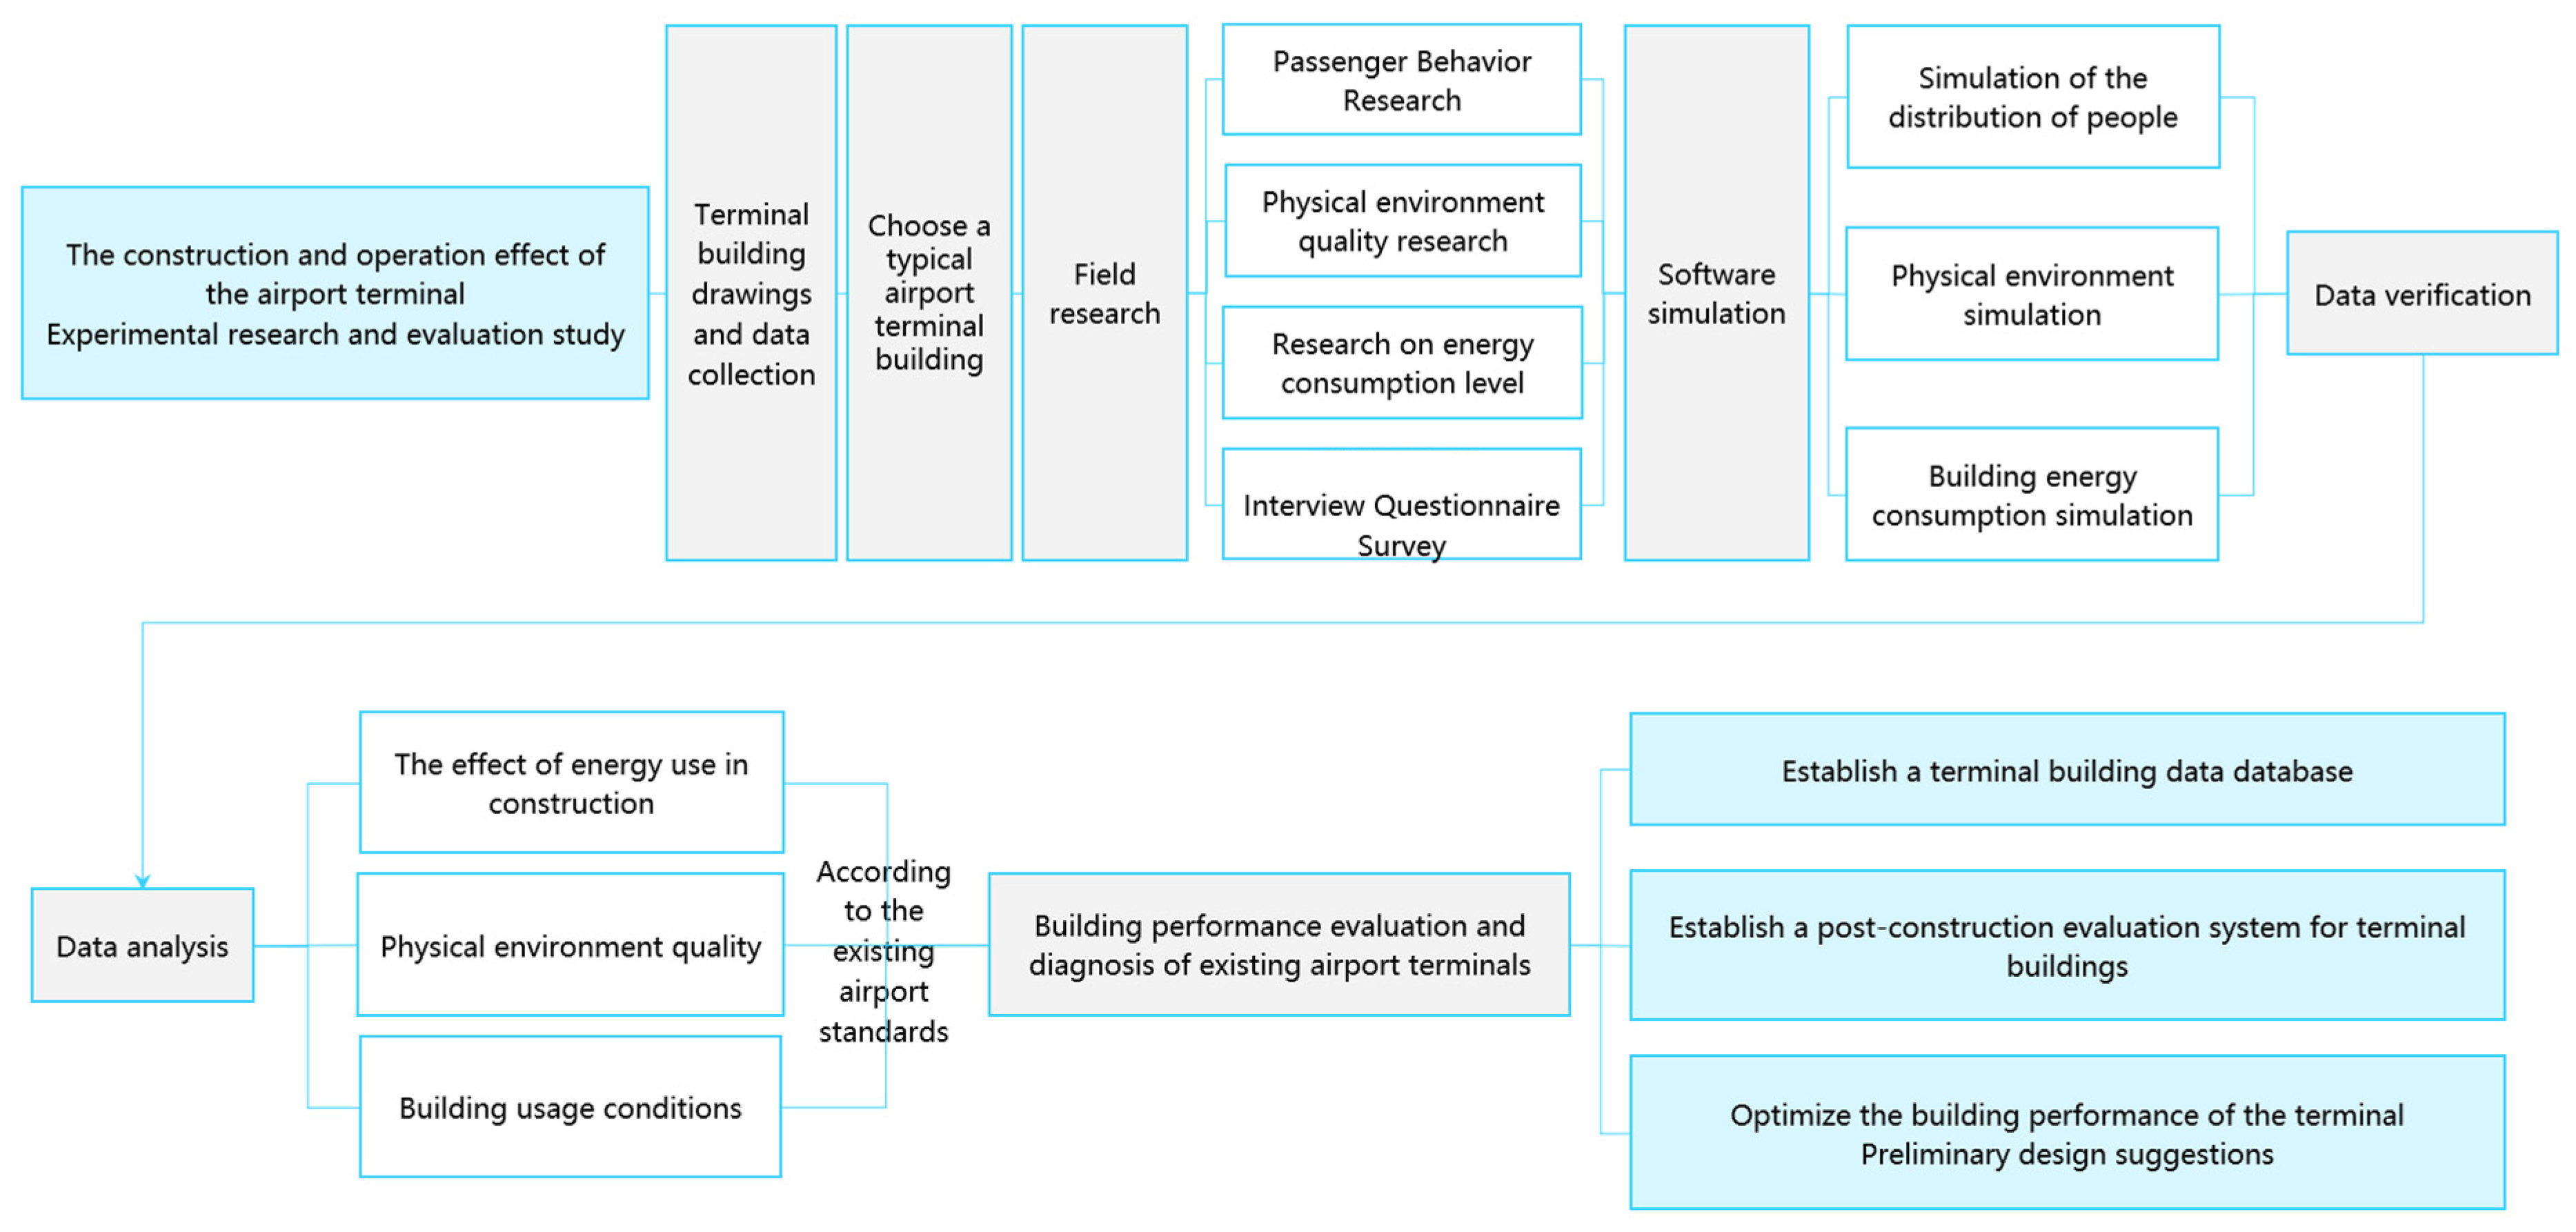
Before the official start of the research project, the research group formulated a detailed research road map. They sought to achieve the research goal of mutual adaptation between post-terminal evaluation and architectural design. Figure 3 summarized the research route of the research.
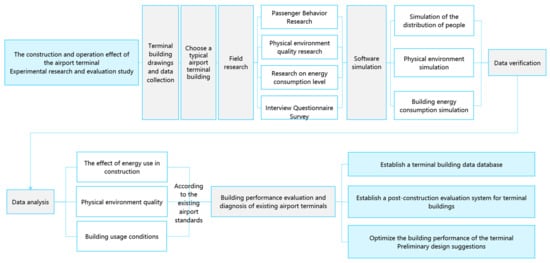
Figure 3.
Research route.
3. On-Site Research and Actual Testing of Terminals
3.1. Specific Research and Test Plan
First, we select a single-seat airport for research in summer and winter.
The physical environment measurement is carried out in key areas, mainly including the terminal check-in hall, the waiting hall, the baggage claim hall, the welcome hall, the security check hall, and other circulation spaces. The content monitored includes the thermal environment, the light environment, and the space quality, and the comprehensive scoring of each region is performed through questionnaires.
3.2. Research Results
3.2.1. Objective Test
- (1)
- Thermal environment
- (1)
- Temperature fluctuationsThrough field measurements, it can be determined that the room temperature is too high or too low in the terminal.
- (2)
- Operating temperature calculation and standard comparison
Only some of the indoor hot and humid environments in some of the cabins meet the evaluation criteria during the measurement time, and other spaces have different degrees of deviations from the measured heat and humidity environment and standards.
- (2)
- Light environment
The natural lighting of the space of the terminal is insufficient, and manual lighting needs to be turned on all day or for parts of the day. In addition, there is also insufficient manual lighting in the airport.
- (3)
- Sound environment
For important spaces, we estimated the measured environmental sound pressure level and the superimposed sound pressure level of the environment and sound reinforcement system, and we investigated the difference between the sound pressure level and the ambient sound pressure level of the sound reinforcement system in the airport near the same time. Through data comparison, it can be found that, under the influence of noisy environmental noise, passengers cannot hear what is broadcast by the sound reinforcement system clearly. In severe cases, this will directly affect the evacuation of passengers in emergency situations. In Table 2, you can see the difference in SPL and SPL difference in different areas.
Table 2.
Sound pressure level and sound pressure level difference in typical areas in the airport (dB(A)).
- (4)
- Air quality
Through on-site measurement, the following data can be obtained, including the concentration of carbon dioxide in different regions and the comparison with the standards.
3.2.2. Subjective Questionnaire
During this test, a total of 126 passenger questionnaires were collected, including 44 in the check-in hall, 50 in the waiting area, and 32 in the arrival hall. The following Figure 4 shows the results of the research on the expected thermal environment of the terminal building.
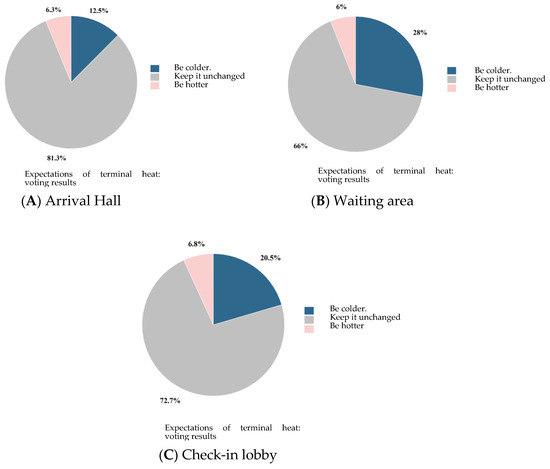
Figure 4.
Expectations of terminal heat: voting results.
- (1)
- Hot and humid environment
Through questionnaires, the basic physical sensations of passengers are collected to obtain relevant data and information, including the scoring of wet, windy, and hot environments and expectations relating to heat.
- (2)
- Light environment
The main information collected includes light environment scoring and voting results on light environment expectations. The following Figure 5 shows the results of the research on the expected lighting environment of the terminal building.
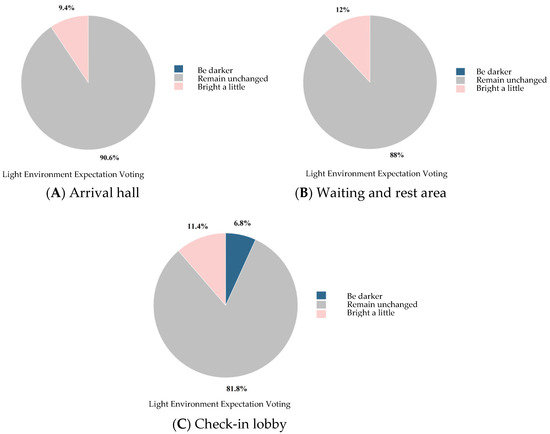
Figure 5.
Expected voting results on the light environment of the terminal.
- (3)
- Sound environment
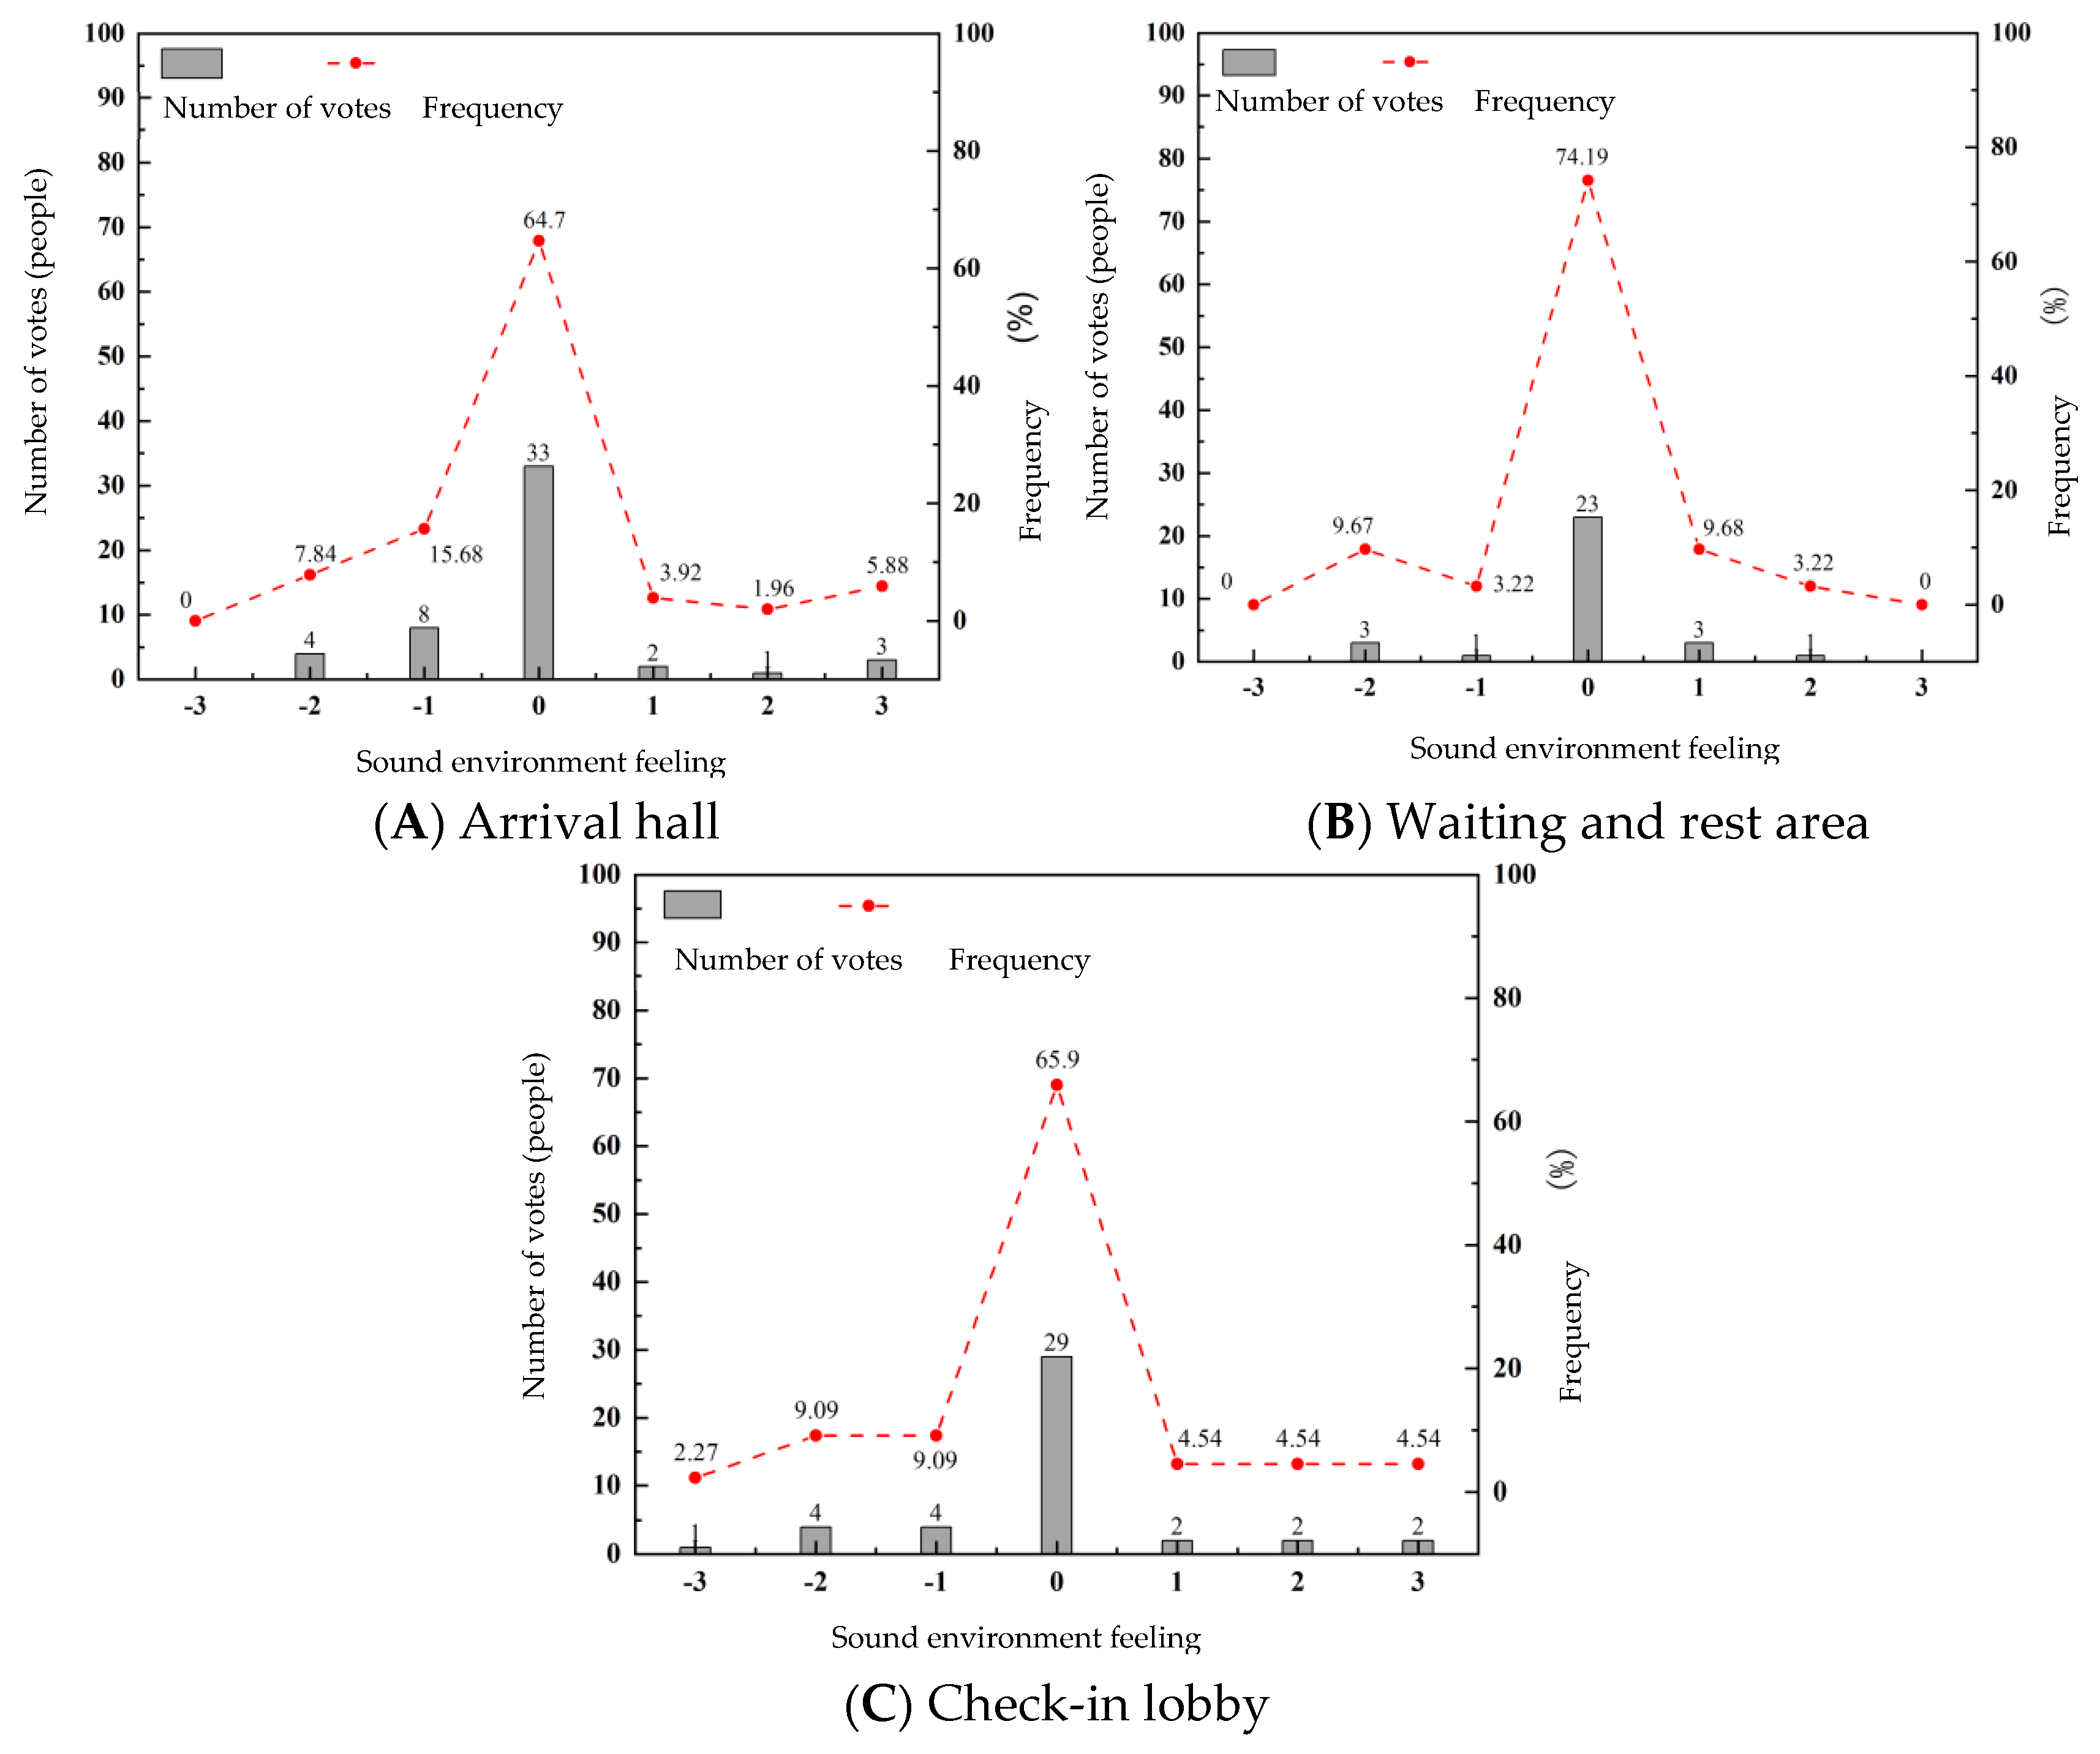
The main information collected includes indoor acoustic environment scoring. The following Figure 6 shows the results of the research on the expected sound environment of the terminal building.
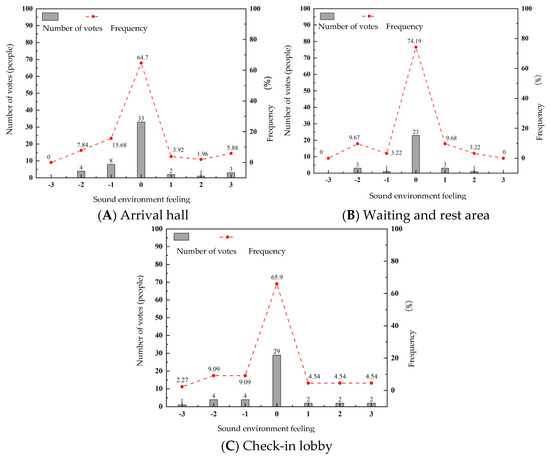
Figure 6.
The voting results of the indoor acoustic environment in the terminal.
- (4)
- Air quality
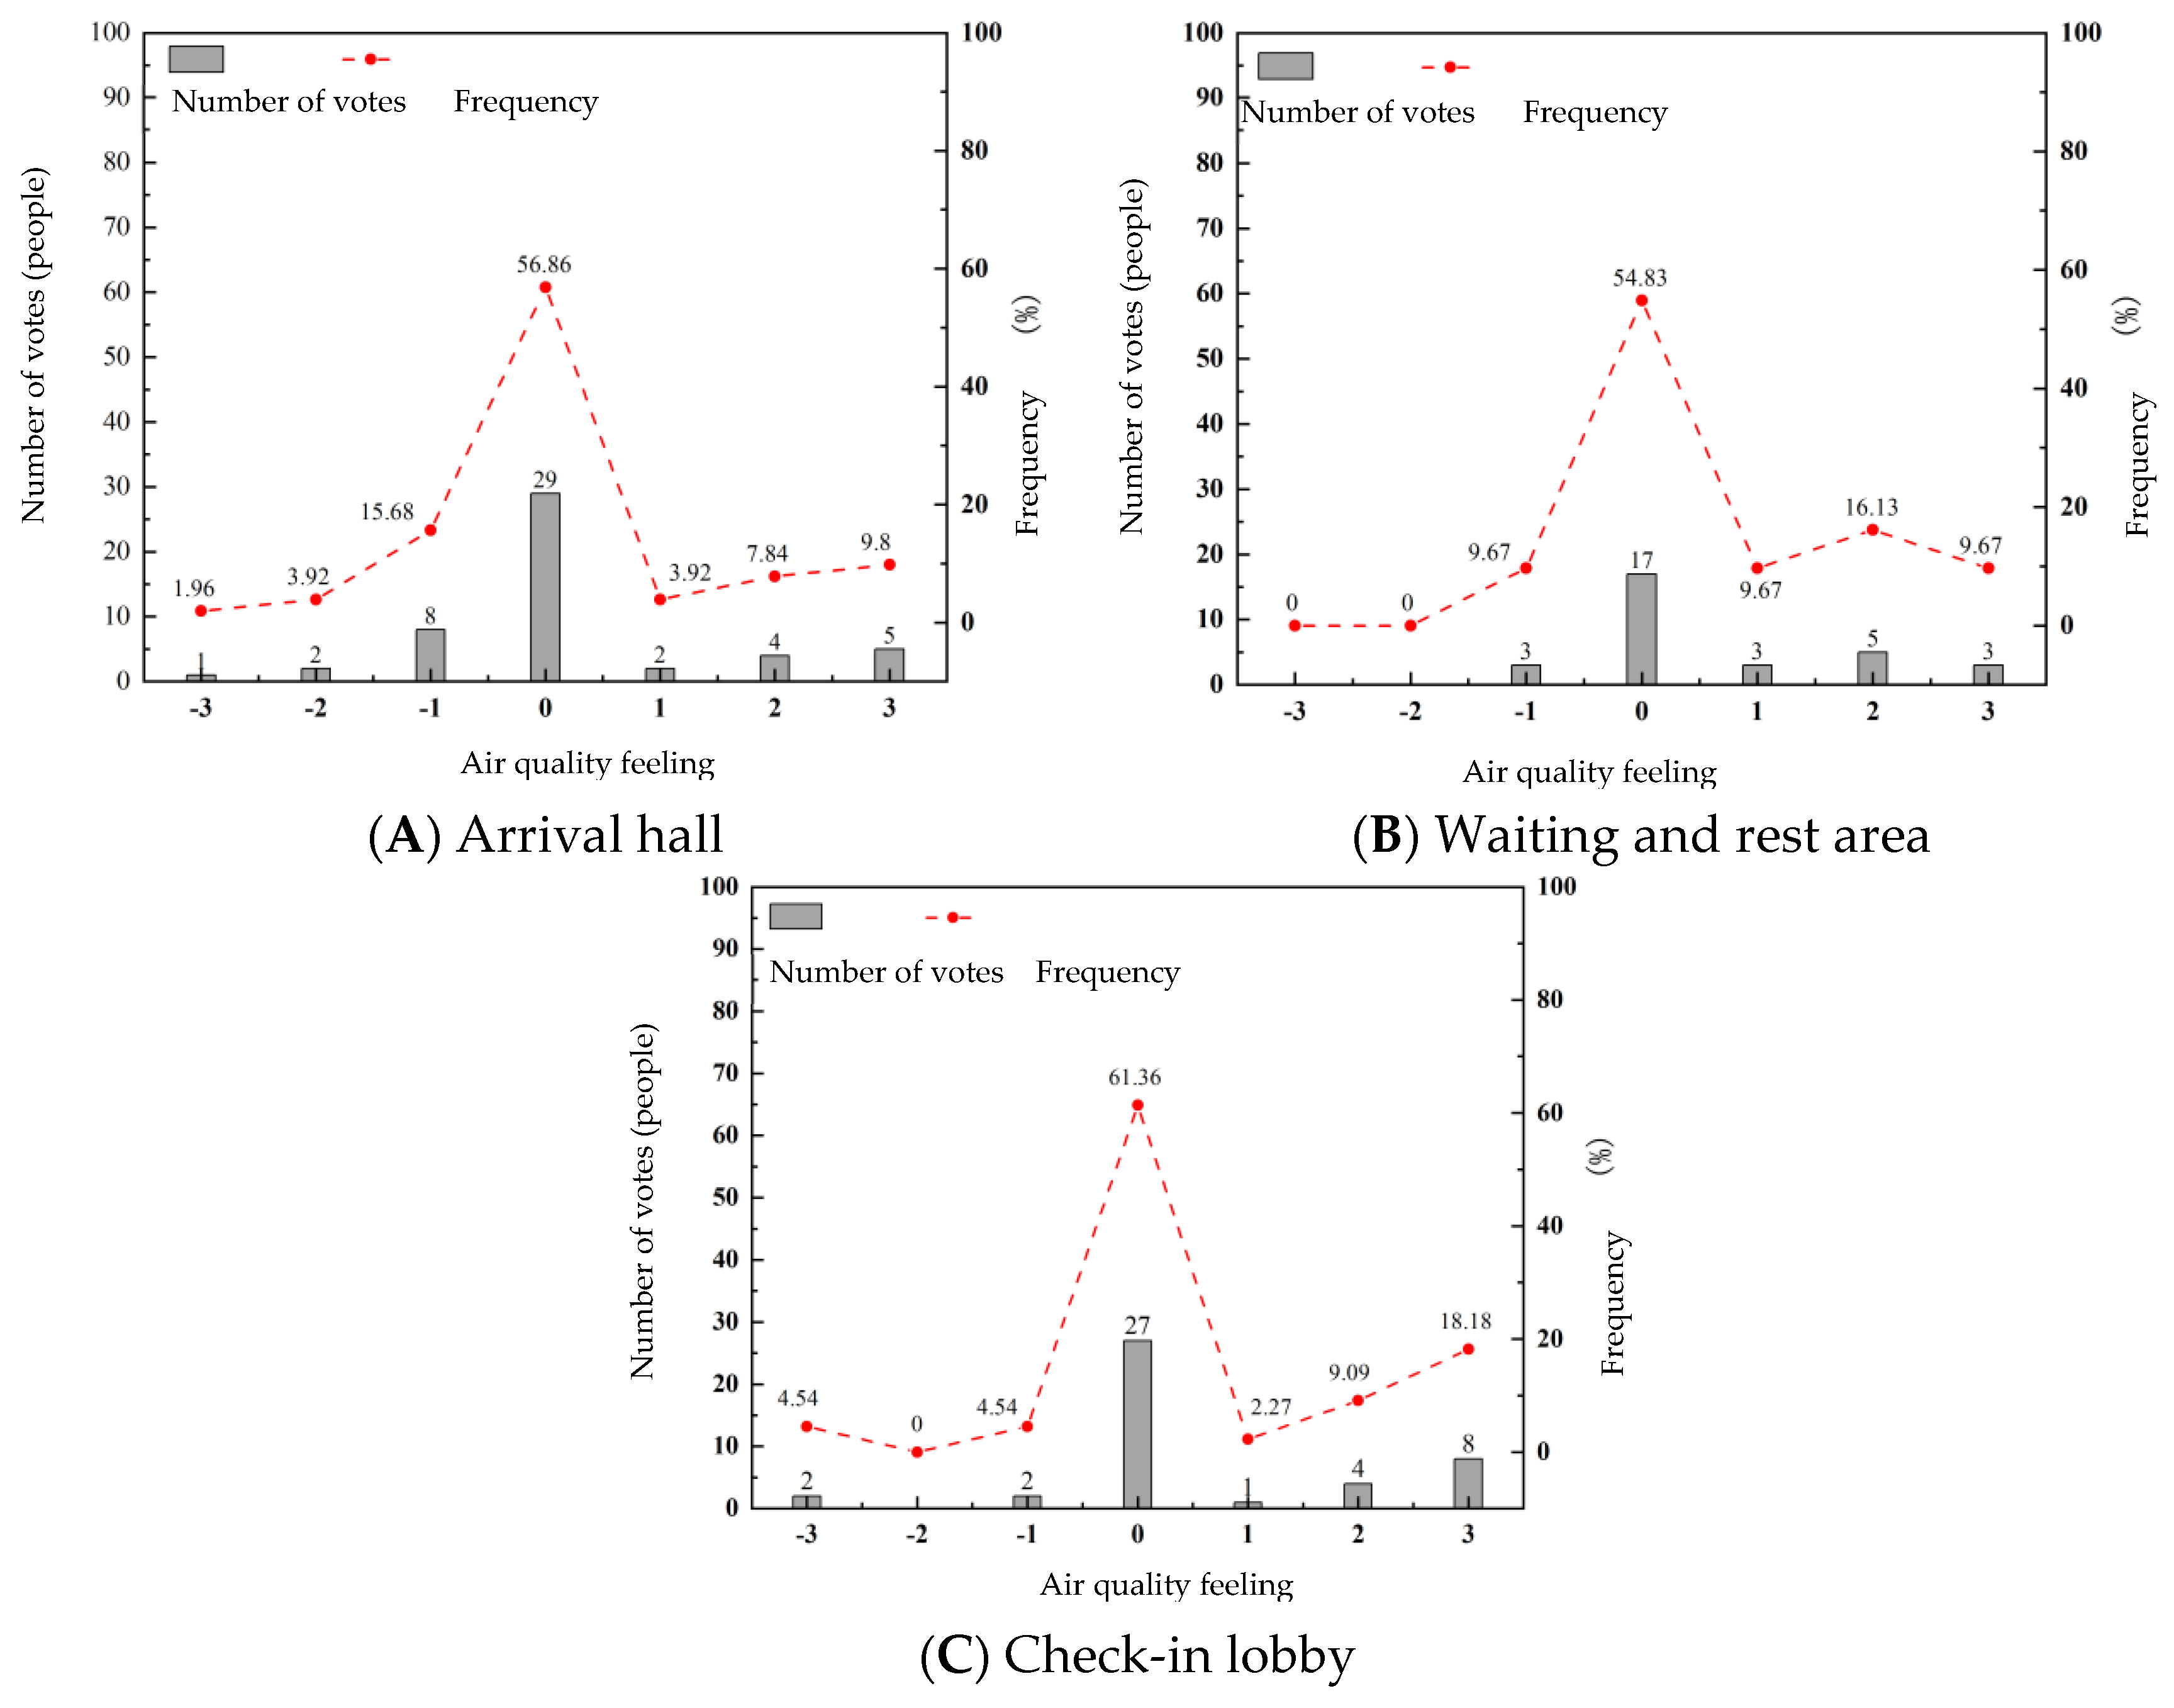
The main information collected includes indoor air quality scoring. The following Figure 7. shows the results of the research on the expected air quality of the terminal building
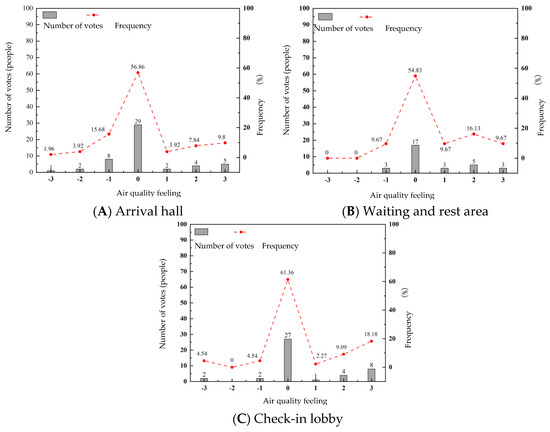
Figure 7.
Indoor air quality poll results.
- (5)
- Environmental satisfaction analysis
For the statistical results of moderate and varying degrees of satisfaction with the indoor environment, please refer to the table below. On the whole, the result is basically the same as that seen in the physical survey in each region. Figure 8 below shows the analysis of environmental satisfaction. Figure 9 shows satisfaction voting results of each area of the overall indoor environment of the terminal.
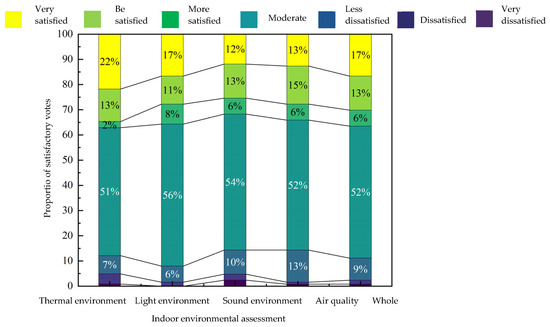
Figure 8.
A schematic diagram of the overall indoor environment satisfaction voting results of the terminal.
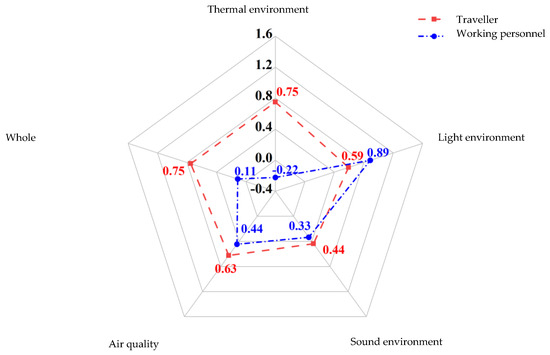
Figure 9.
A schematic diagram of the satisfaction voting results of each area of the overall indoor environment of the terminal.
- (6)
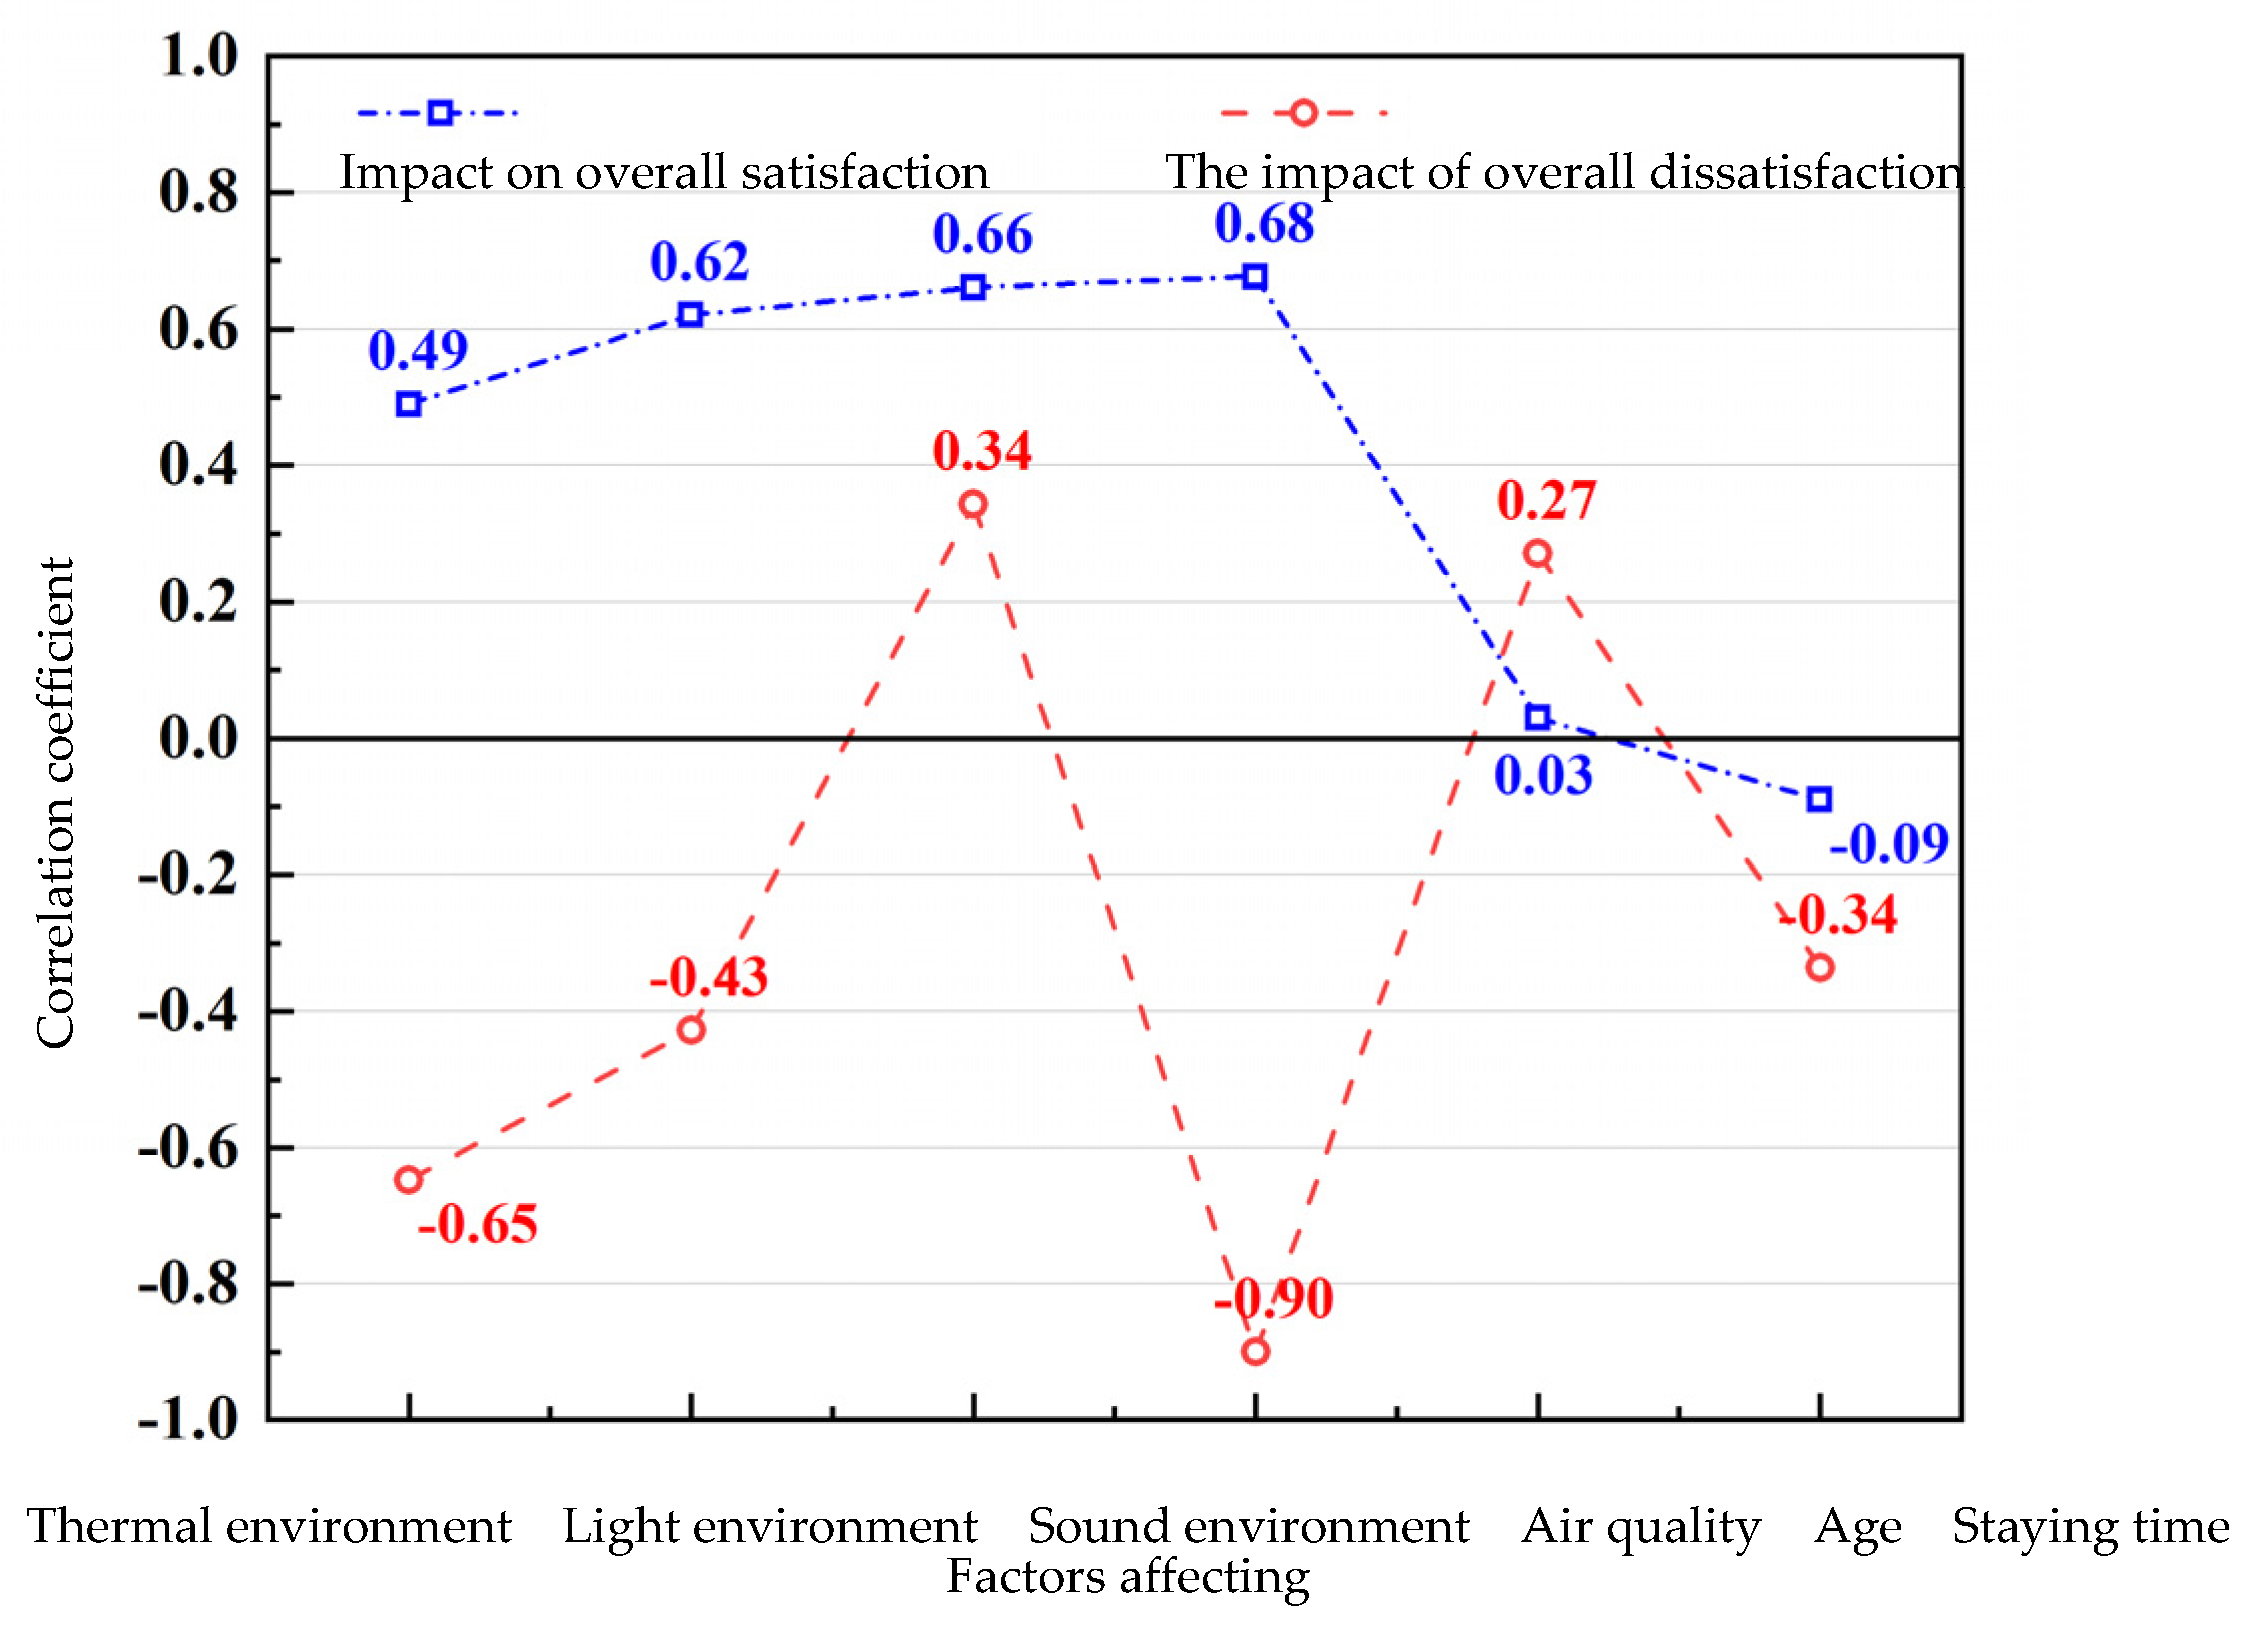
- The relationship between overall satisfaction and itemed satisfaction
The thermal environment satisfaction, light environment satisfaction, acoustic environment satisfaction, air quality satisfaction, passenger age, and passenger’s stay time in the airport are linearly regressed with overall satisfaction. The correlation analysis and analysis results of passengers’ overall satisfaction evaluation of airport indoor satisfaction and environmental satisfaction evaluation and other influencing factors, as shown in Figure 10, are obtained. It can be seen that there is a strong correlation between passengers’ satisfaction with the evaluation of the light environment, acoustic environment, and air quality of the airport, and overall satisfaction with the airport; there is a moderate correlation between passengers’ satisfaction with the evaluation of the thermal environment and the overall satisfaction of the airport; and there is no obvious correlation between the age of passengers and the stranding time and the overall satisfaction of passengers in the airport. When passengers are dissatisfied with the overall evaluation of the indoor environment of the airport, there is a strong correlation between air quality dissatisfaction, thermal dissatisfaction, and overall dissatisfaction; there is a moderate correlation between dissatisfaction and the light environment, dissatisfaction with acoustic environment and detention time, and overall dissatisfaction; and there is a weak correlation between age and overall dissatisfaction.
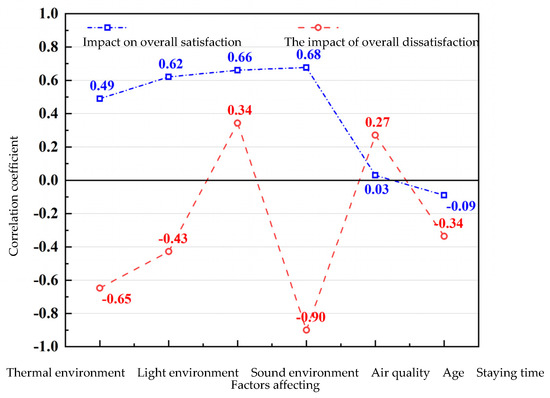
Figure 10.
Correlation analysis of overall satisfaction and its influencing factors.
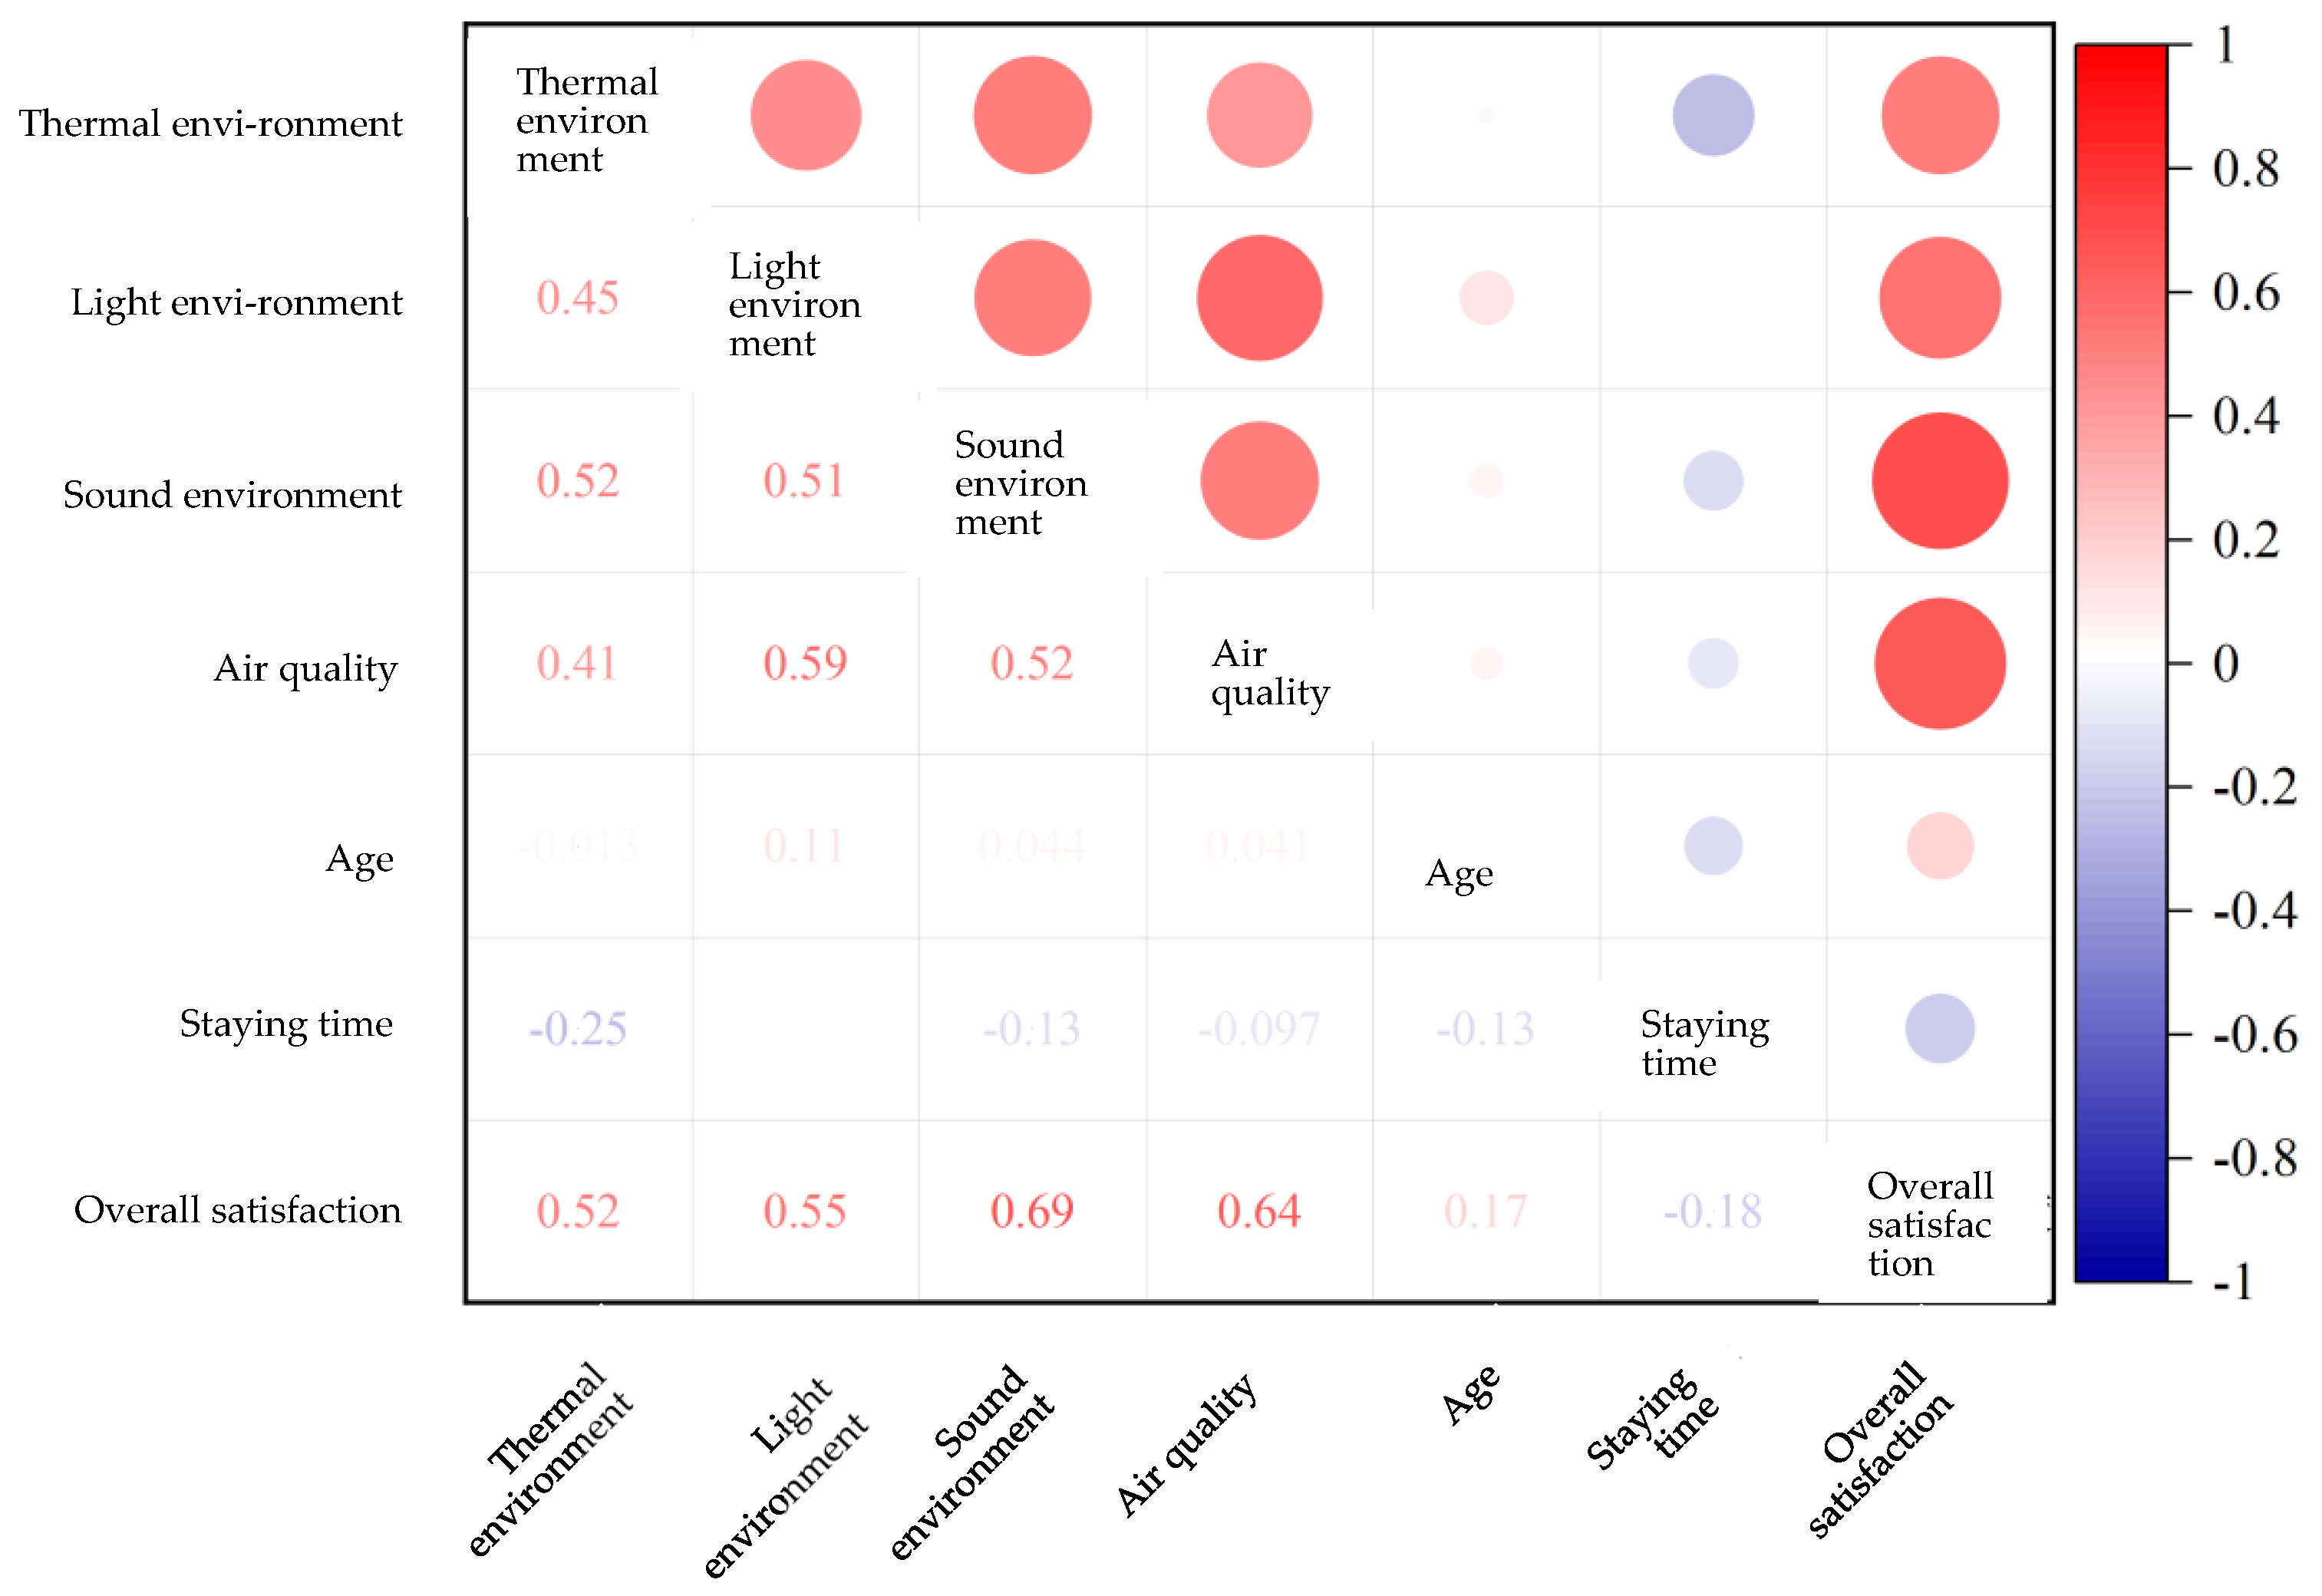
- (7)
- Analysis of the correlation between environmental satisfaction and age and retention time
Figure 11 shows the correlation analysis results between environmental satisfaction and age and retention time. It can be seen that there is not only a moderate correlation between thermal environment, light environment, acoustic environment, air quality, and overall satisfaction, but that there are also varying degrees of correlation between these factors and environmental satisfaction.

Figure 11.
The analysis of the correlation between environmental satisfaction and age and detention time (passenger).
3.3. Basis for Evaluation
The environmental data obtained from the test will be compared with China’s current design specifications to determine whether the indoor environmental quality meets the standards.
The evaluation of the indoor thermal environment is based on the evaluation standard for Indoor Hot and Humid Environment of Civil Buildings GB/T50785-2012 [9] and the design specification for Heating, Ventilation and Air Conditioning for Civil Buildings GB50736-2016 [10]. The operative temperature of different test areas is calculated according to formula (1), and the relative humidity at this time is compared with the summer indoor thermal environment evaluation standard (temperature is 24–28 °C, relative humidity is 40–70%, and the wind speed does not exceed 0.25 m/s).
The evaluation standards for the light environment refer to the Architectural Lighting Design Standard GB50033-2013 [11] and the Architectural Lighting Design Standard GB50034-2013 [12], respectively. Among them, the natural lighting standard values are 450 lx for the waiting hall and check-in hall and 300 lx for the arrival channel and the arrival hall. The standard value for manual lighting is 200 lx for the check-in area, the arrival hall, and the baggage pick-up area and 150 lx for the terminal hall and arrival channel.
The evaluation standard of the acoustic environment is based on the public transportation waiting room hygiene standard GB9672-1996 [13]. The noise in the waiting hall should be less than 70 dB. The reference standard for indoor air environment is the Indoor Air Quality Standard GB/T18883-2002 [14], and the CO2 concentration should not exceed 1000 ppm.
3.4. Simulation
From the field research results, it can be seen that there are many problems in the thermal environment and light environment of the terminal. In order to show the problems in the terminal in more depth, this project also simulated the photothermal environment of the terminal under the most unfavorable conditions. ANSYS (version 21.2) is mainly used for the thermal environment simulation of the terminal. Specifically, the following simulations of the terminal are carried out at 13:00 on the summer solstice day:
- (1)
- We simulate the vertical temperature difference caused by a large curtain wall, a skylight, and a large space.
- (2)
- Due to the arrangement and regulation of the end of the air conditioner, the space temperature field and speed field are simulated.
For the light environment in the terminal, Rhino + Grasshopper is used to simulate the natural lighting status of the terminal at 12:00 on the winter solstice, and the glare simulation is carried out in the check-in hall and waiting hall. At the same time, DIALux evo is used to carry out artificial lighting in the night light environment.
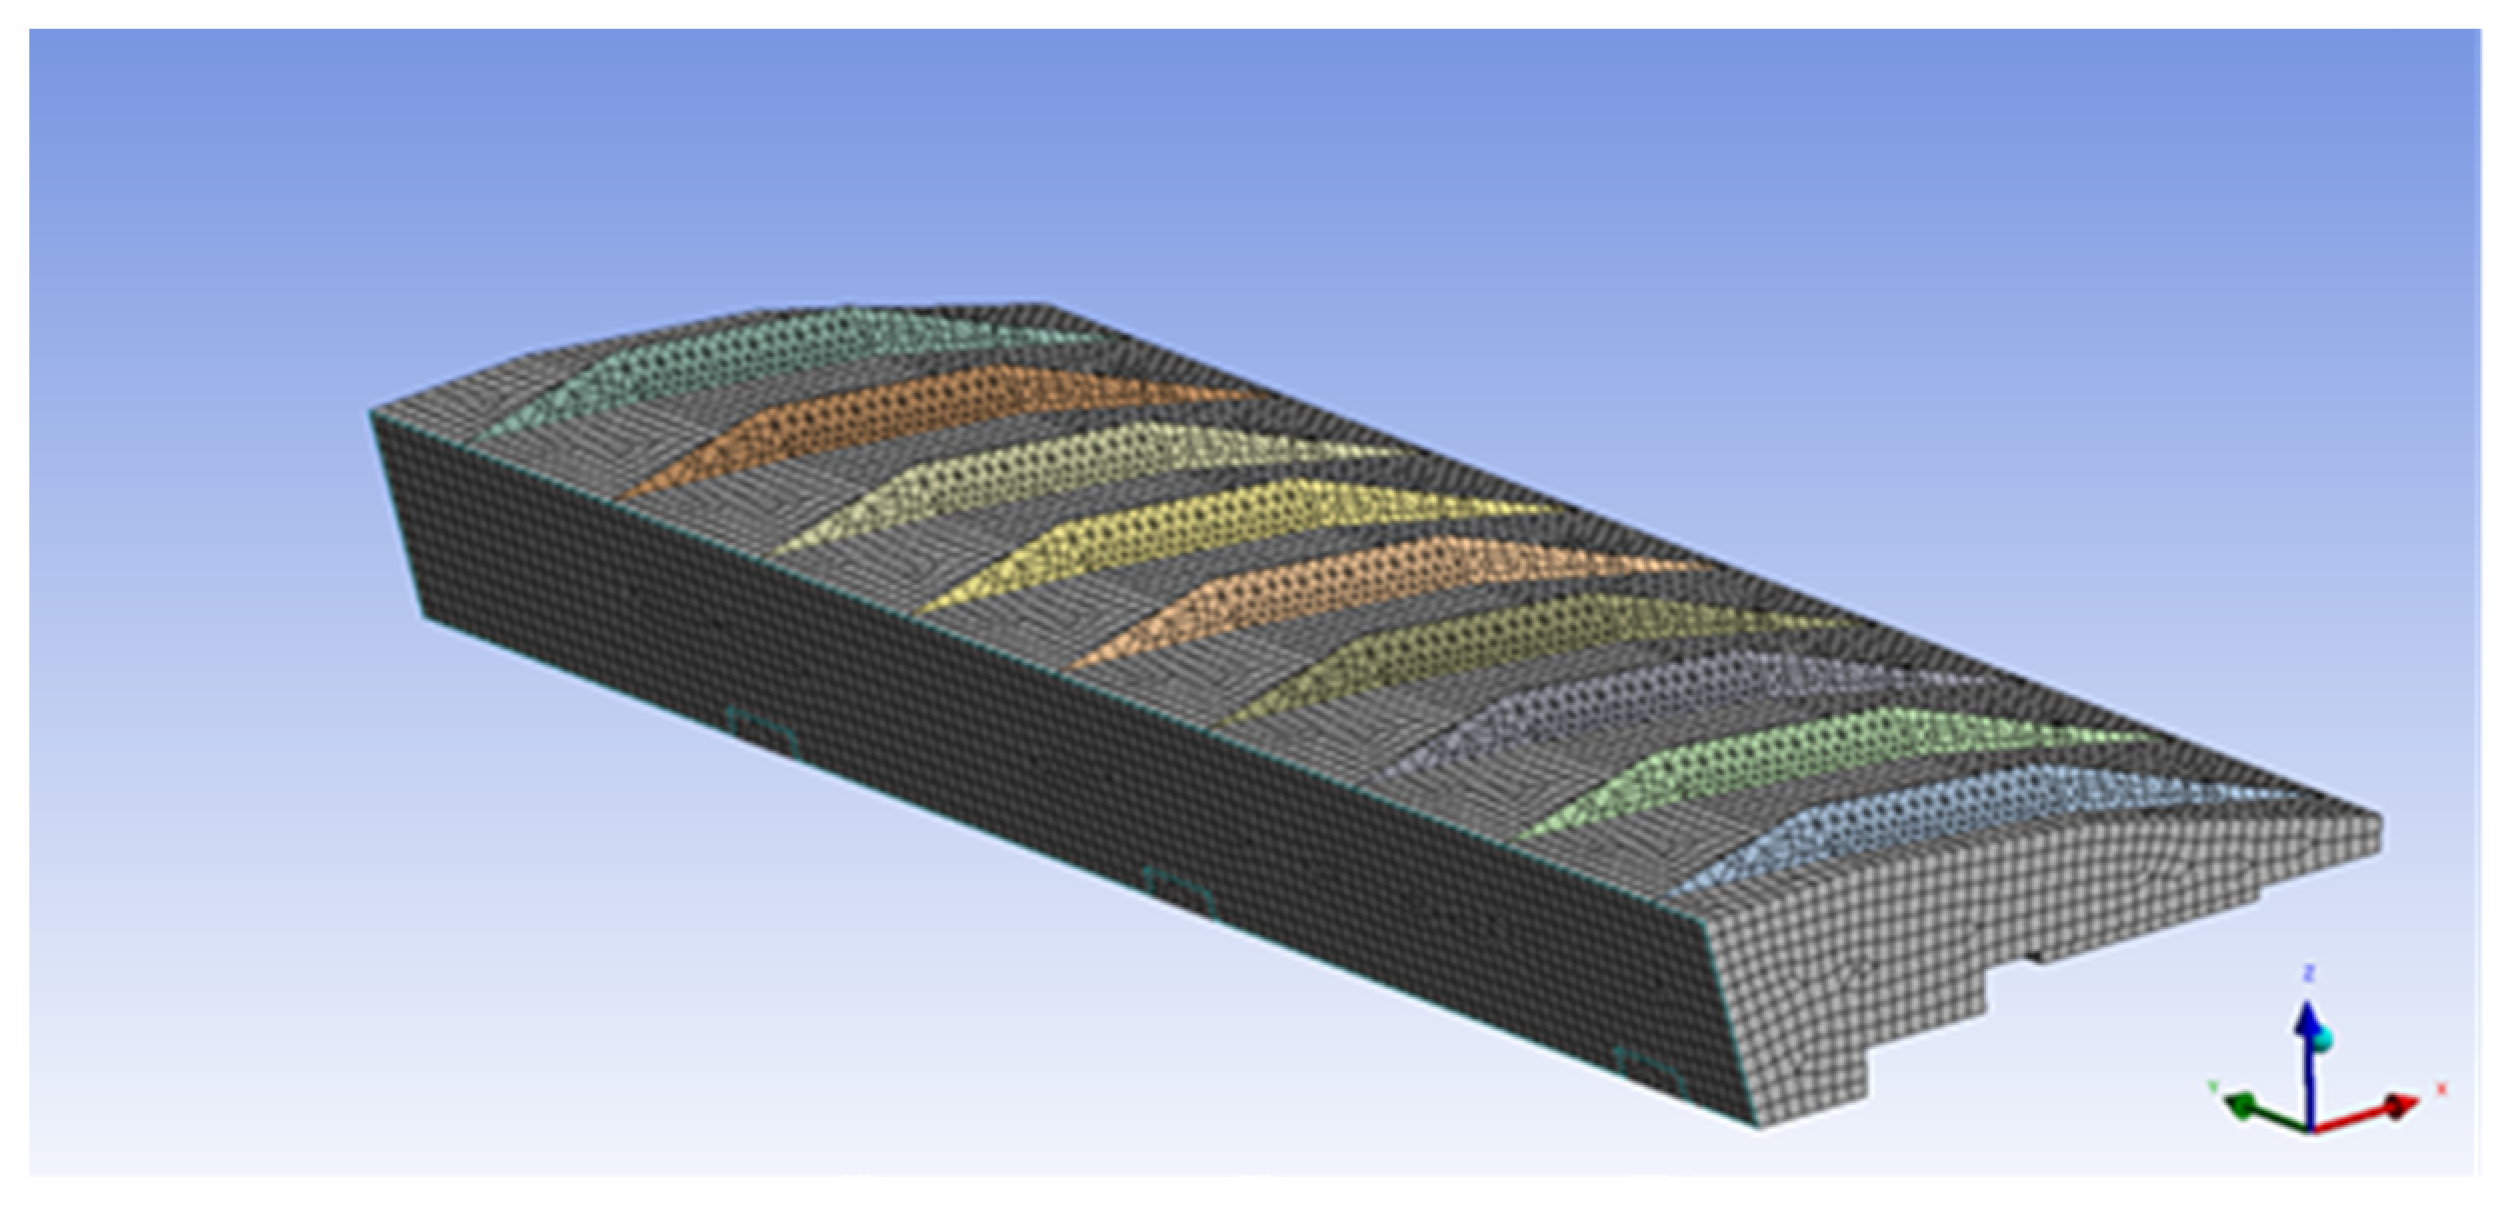
3.5. Model Building and Simulation Content
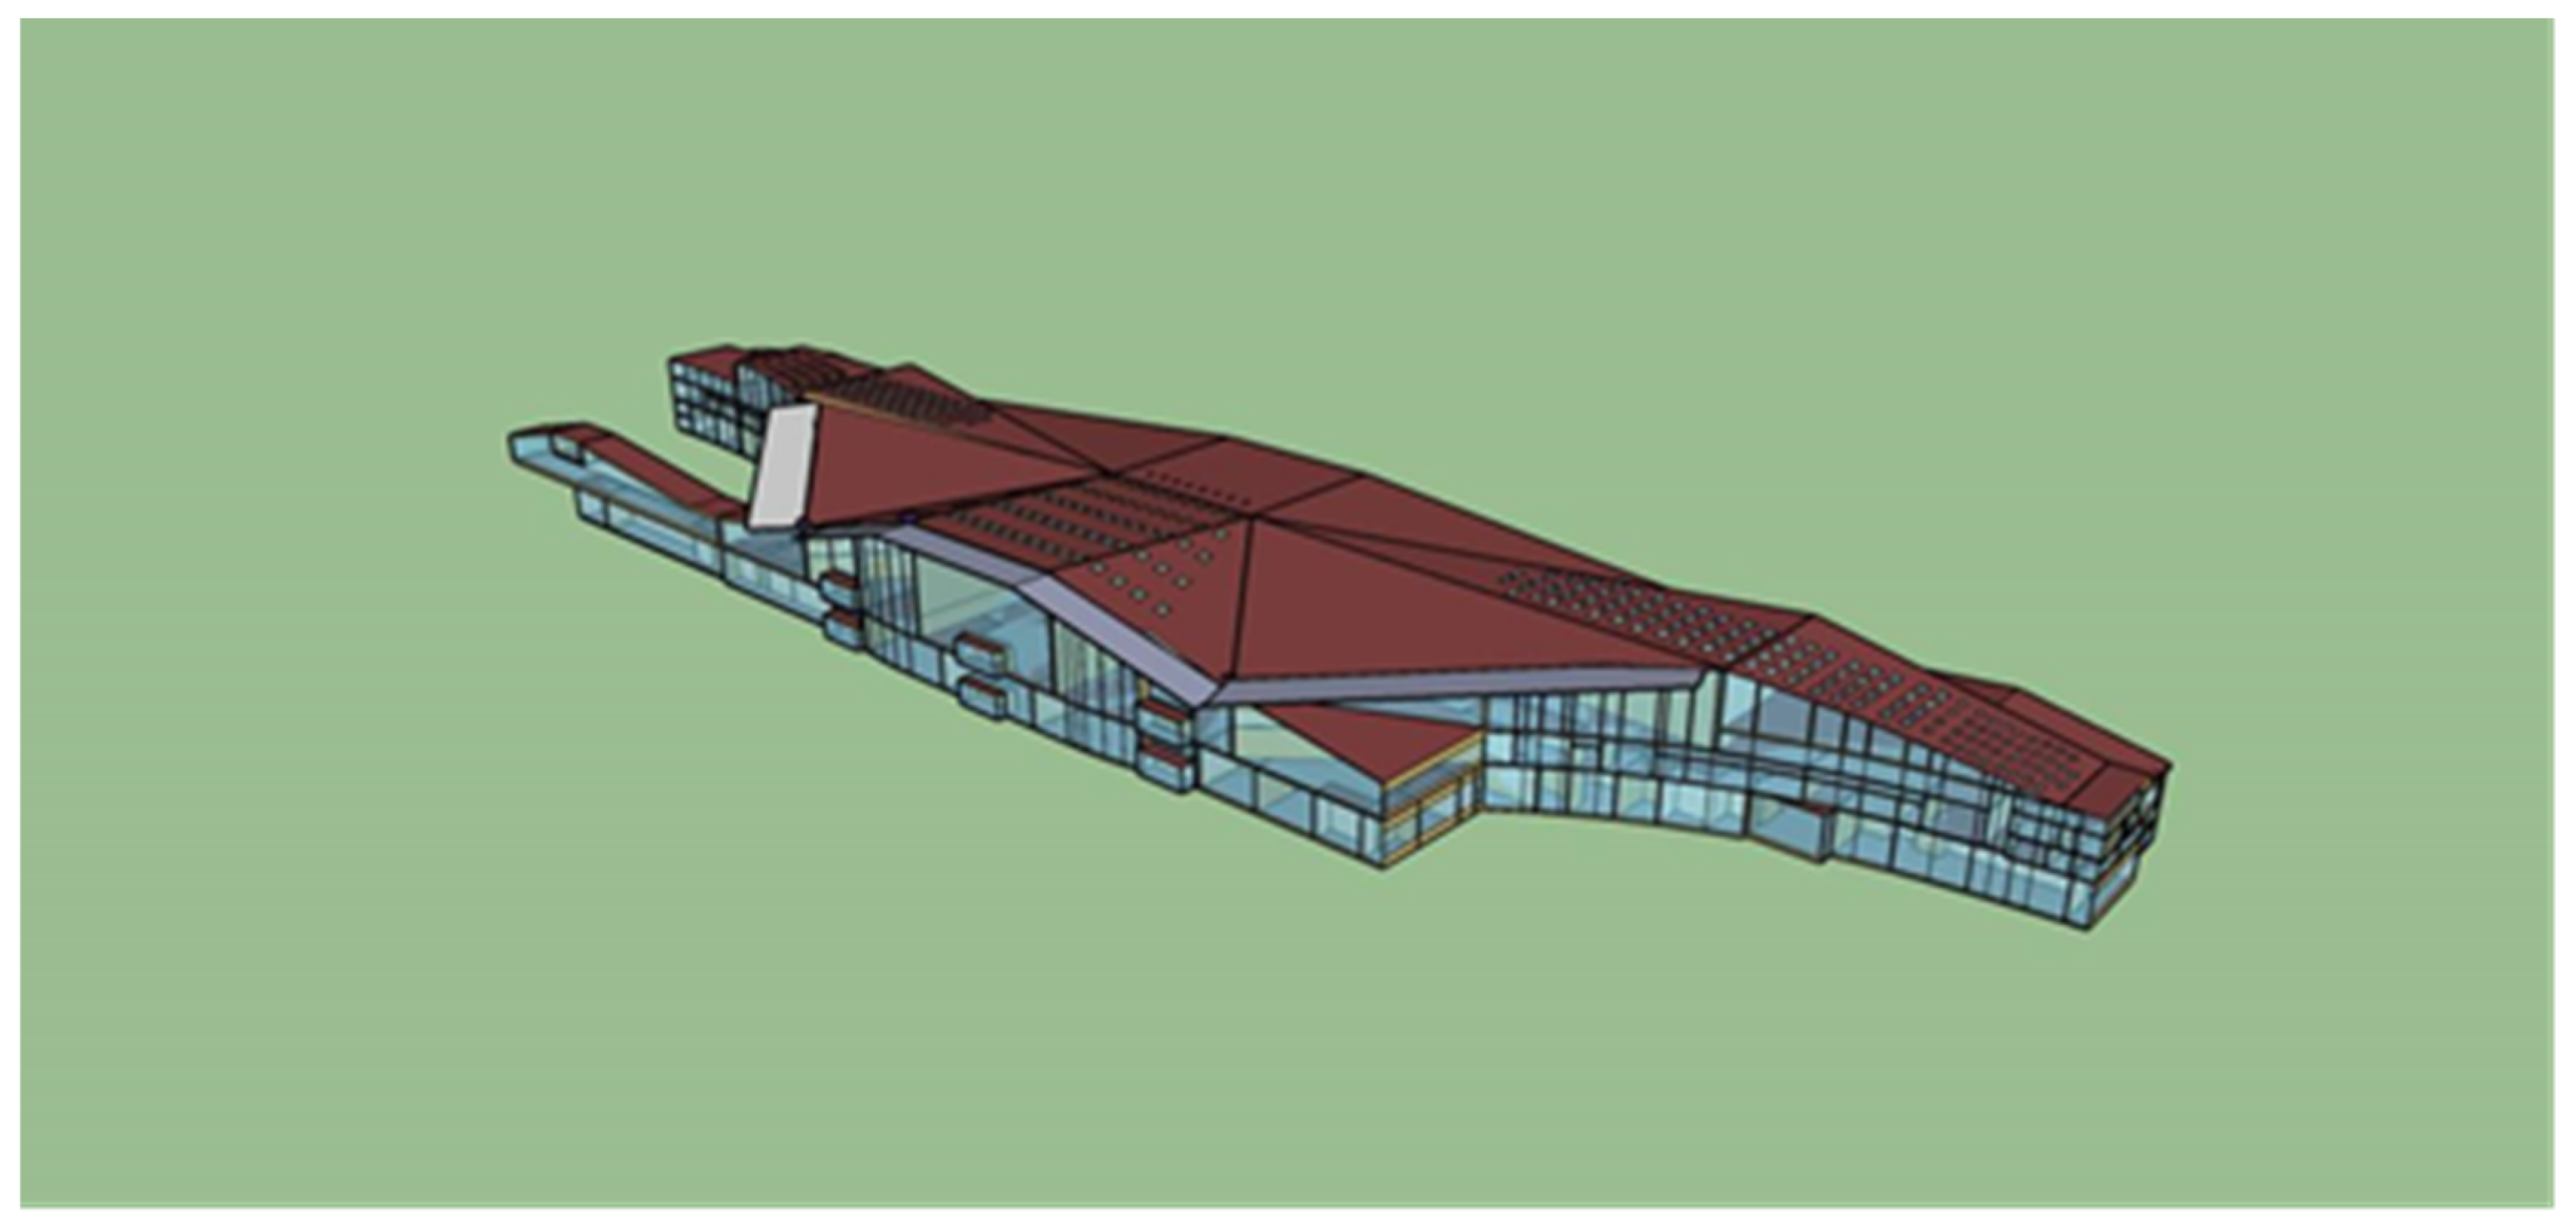
After information collection, we model the basic information of the building based on the drawing information, and obtain a digital model of the building. Figure 12 shows an example of the digital model.

Figure 12.
The basic model of the terminal.
3.6. Simulation Results and Analysis
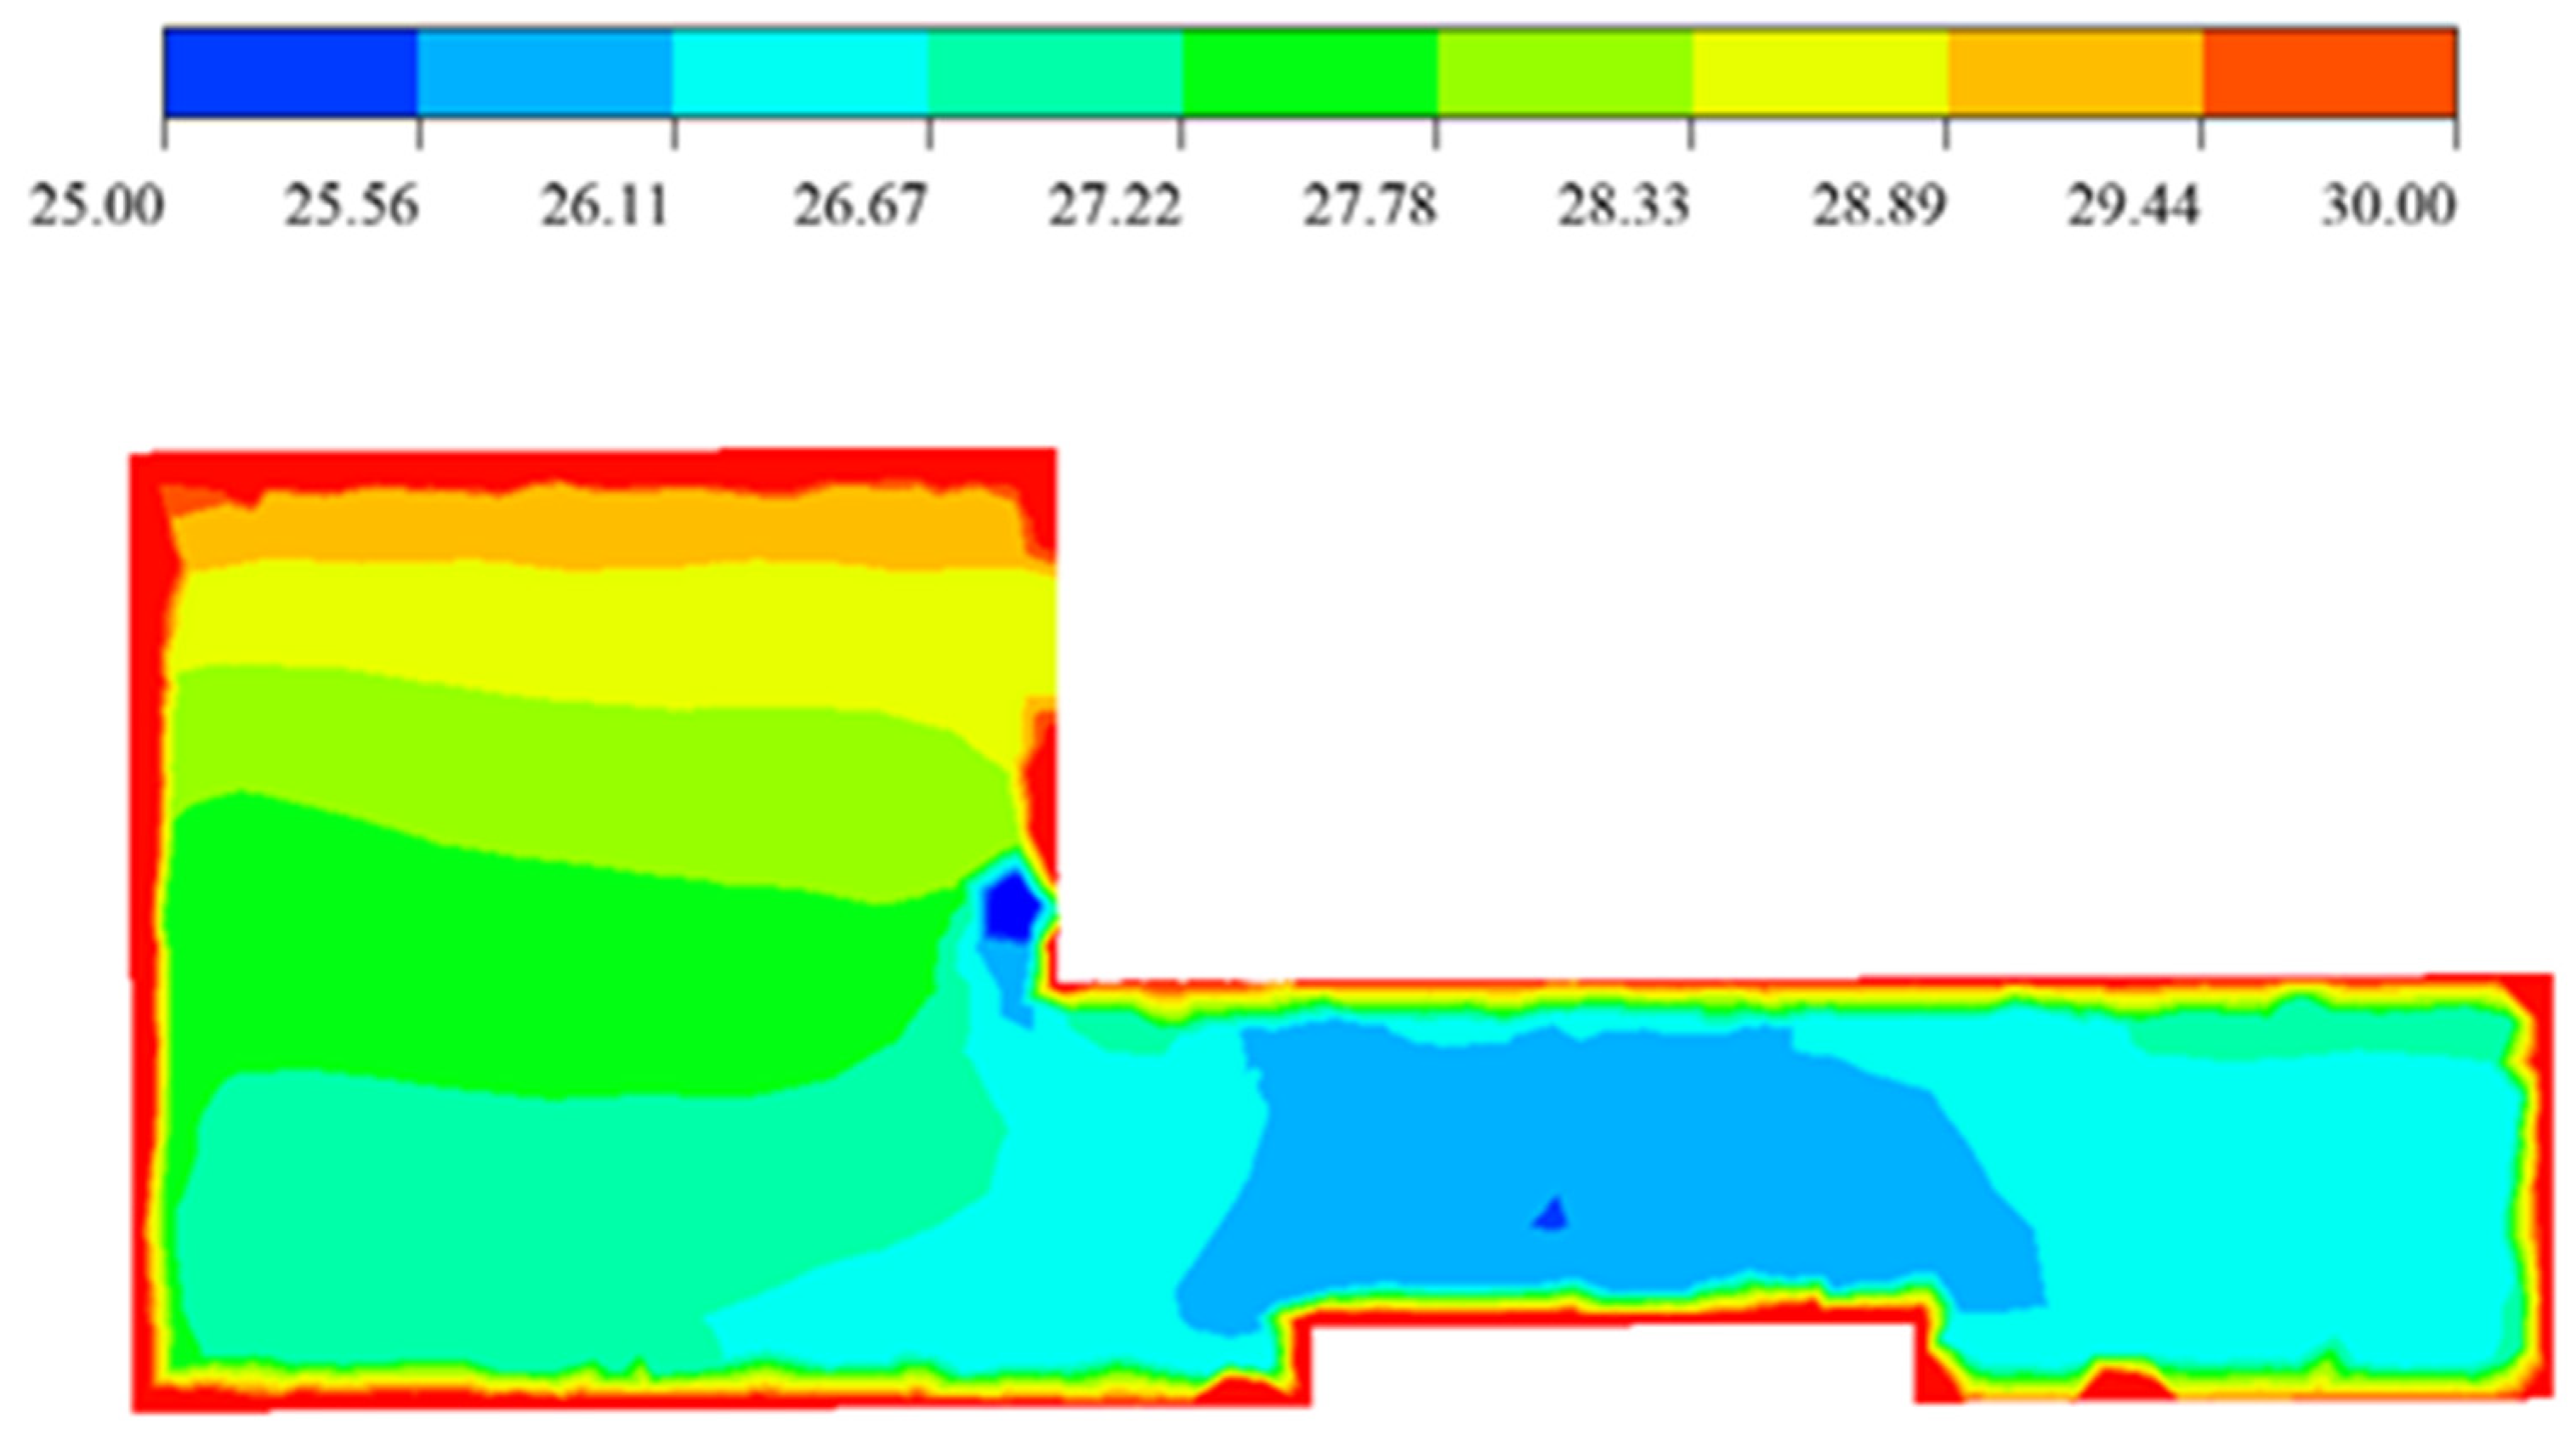
- (1)
- Hot and humid environment
Here shows the temperature distribution in the terminal building. You can see the distribution of different temperature zones in Figure 13.

Figure 13.
Spatial temperature distribution.
- (2)
- Light environment
Here shows the distribution of the light environment inside the terminal building, Figure 14 show examples of the light environment distribution in terminal building.
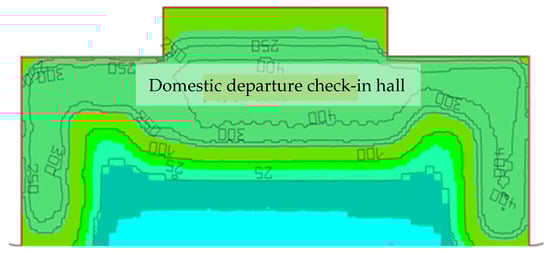
Figure 14.
Light distribution map.
3.7. Summary of Questions
3.7.1. Thermal Environment
- (1)
- Spatial temperature distribution is uneven
According to the field survey, the temperature difference in each space of the terminal is obvious, and the temperature difference is evident not only in the vertical direction, but also in the horizontal direction.
- (2)
- Severe air penetration at the entrance
During the normal use of the terminal, in order to facilitate the entry of passengers into the station, the entrance glass door is open for a long time during operation, resulting in serious air penetration. Figure 15 shows the common issues in the usage of the terminal building.
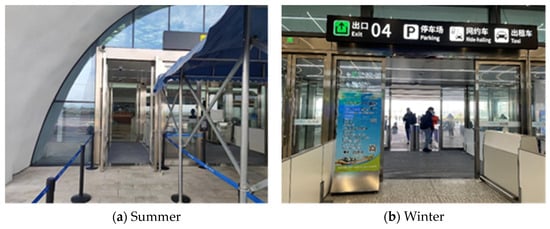
Figure 15.
The entrance of the terminal.
The operation of HVAC equipment does not exactly match the needs of the indoor environment.
- (3)
- The operation strategy of the existing HVAC equipment in the terminal has not been fully adapted to the needs of users in the environment.
3.7.2. Optical Environment
- (1)
- There is glare in the sunroof part and the environment is overheating.
Airport terminals often use large-scale sunroofs to increase natural lighting and create spatial effects, but existing sunroofs easily cause local glare and cause a large amount of solar radiation to enter the room in summer, causing local temperatures to be too high.It can be clearly seen from Figure 16 that the glare problem.

Figure 16.
Skylight glare.
- (2)
- The control of the lighting equipment of some spaces is disorderly
On the one hand, many areas of the existing terminal can fully use natural lighting to meet lighting needs during the day without turning on manual lighting.
On the other hand, some spaces are not open when the artificial light source needs to be turned on, resulting in darkness in the room.
3.7.3. Sound Environment
- (1)
- Large ambient noise pressure level
On the one hand, the noise of the terminal comes from the operation of complex indoor equipment and the conversation of indoor personnel, and on the other hand, it comes from the taxiing of outdoor passenger planes. During this survey, we found that the internal environmental noise level of the terminal is relatively high.
- (2)
- The difference between the sound pressure level and the ambient sound pressure level of the sound amplification system is small.
Another typical problem in the acoustic environment of the terminal is that the difference between the sound pressure level and the ambient sound pressure level of the sound amplification system is small. The research data show that the actual difference between the sound pressure level and the ambient sound pressure level of the sound amplification system is less than 15 dB.
3.8. Suggestions and Effects of Improvement
- (1)
- Establishment of geometric models
The EnergyPlus thermal model is established for the main activity areas of passenger personnel in the terminal to calculate the hot and cold loads in the main activity areas of passengers [15]. Figure 17 shows an example of geometric model.

Figure 17.
EnergyPlus geometric model.
- (2)
- Boundary condition setting
The relevant parameters of the enclosure structure are set [16], which mainly include the heat transfer coefficient, airtightness and the ratio of each facing the window wall. The temperature schedule of lighting, equipment, personnel and air conditioning is set in accordance with the Energy-Saving Design Standards for Public Buildings (GB50189-2015) [17]. Table 3 reflects the parameter categories for the thermal performance of enclosure structure.
Table 3.
Schematic diagram of thermal performance of enclosure structure.
- (3)
- Improvement measures
Suggestions for the improvement of existing terminals are put forward with regard to the elements of lighting schedule, external shading, door bucket intrusion wind, the optimization of transparent enclosure structure factors, cold and heat sources, and the air conditioning system.
- (4)
- Improved effect
The simulation effect of the improvement scheme is compared with the current data to obtain the efficiency ratio of reducing energy consumption.
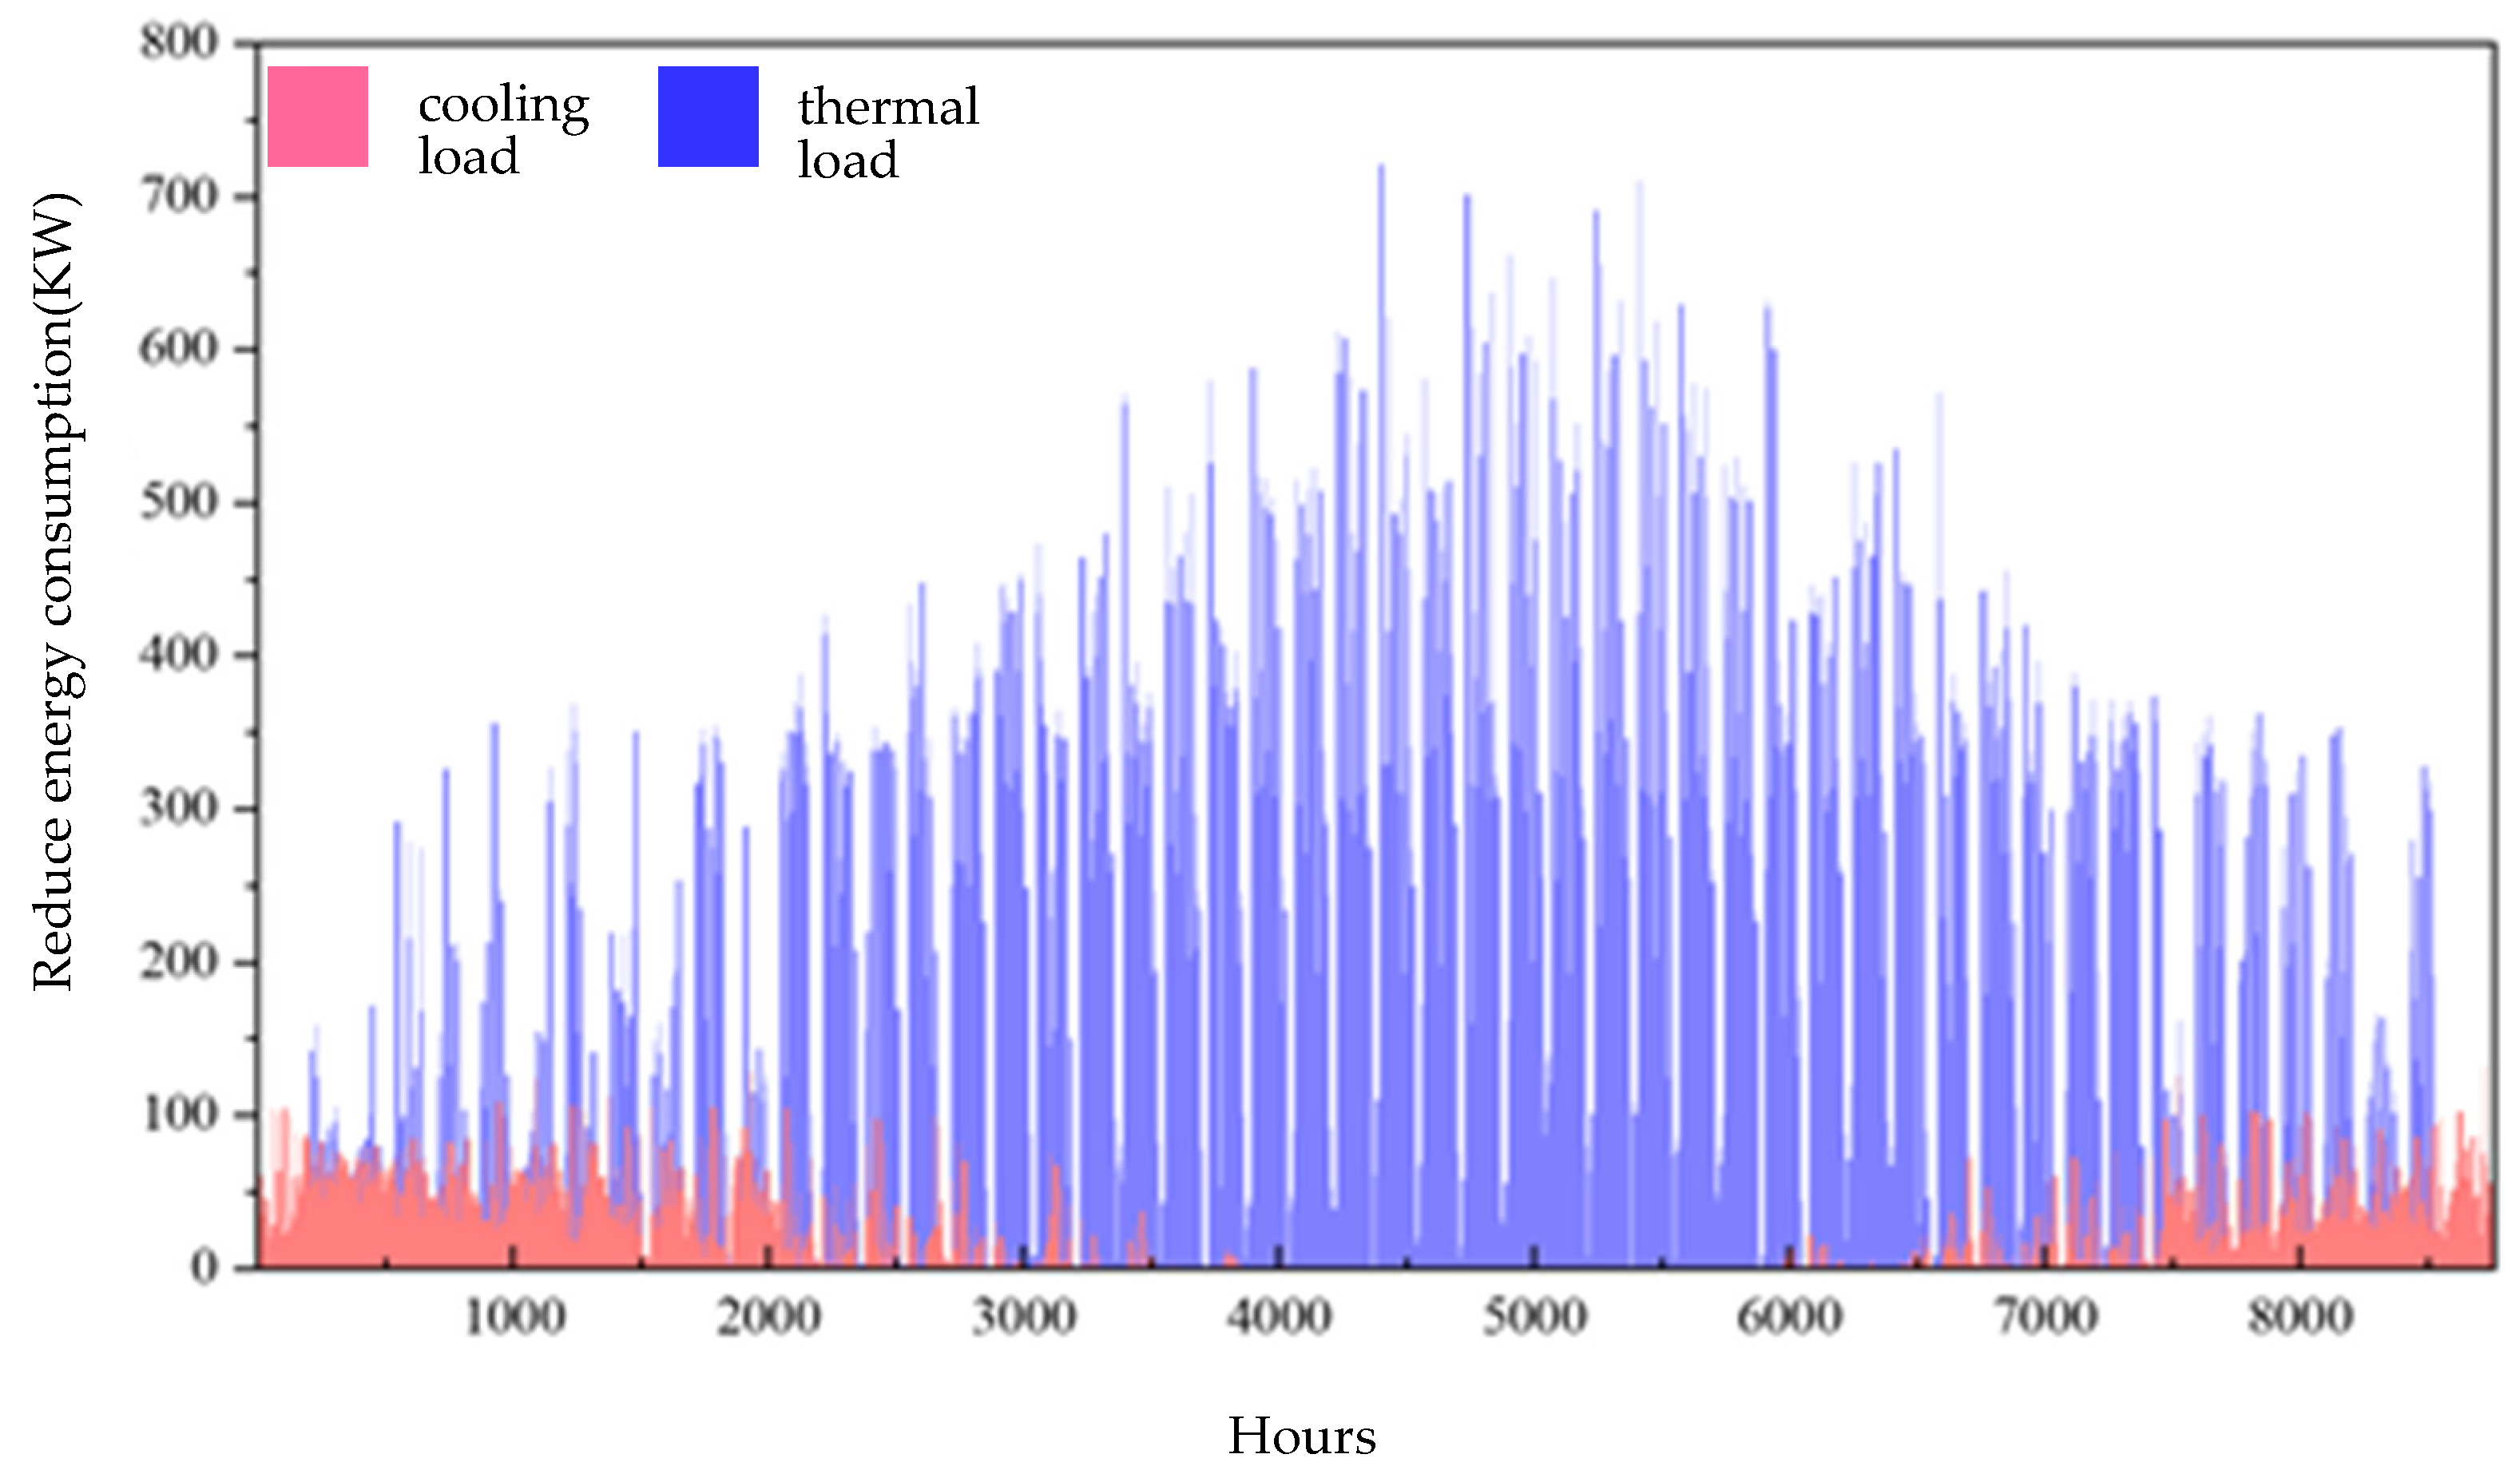
With the correction and update of subsequent models, digital simulation can provide a more realistic indoor physical environment, helping operators to find the key to improving the comfort of the terminal and reducing the problem. Figure 18 shows the improvement of the load [18].
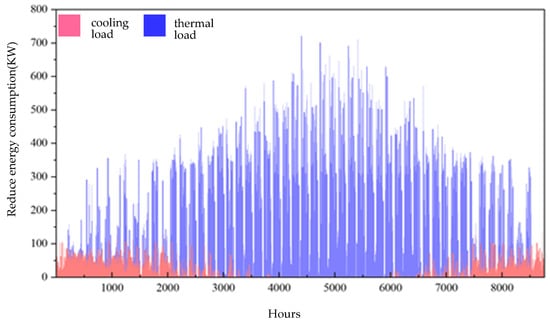
Figure 18.
Schematic diagram of improved indoor load reduction.
4. Summary of Post-Station Evaluation Research
4.1. Indicators of Achievement
This topic has formed a complete evaluation system. Using terminals in different climate zones, it focuses on the evaluation of the physical environment and evaluates the deviation values of the use and design of the terminal. Multi-dimensional comprehensive evaluation is carried out with multiple factors. Comprehensive research methods are adopted, including questionnaire surveys, on-site simulation, data induction analysis, etc.
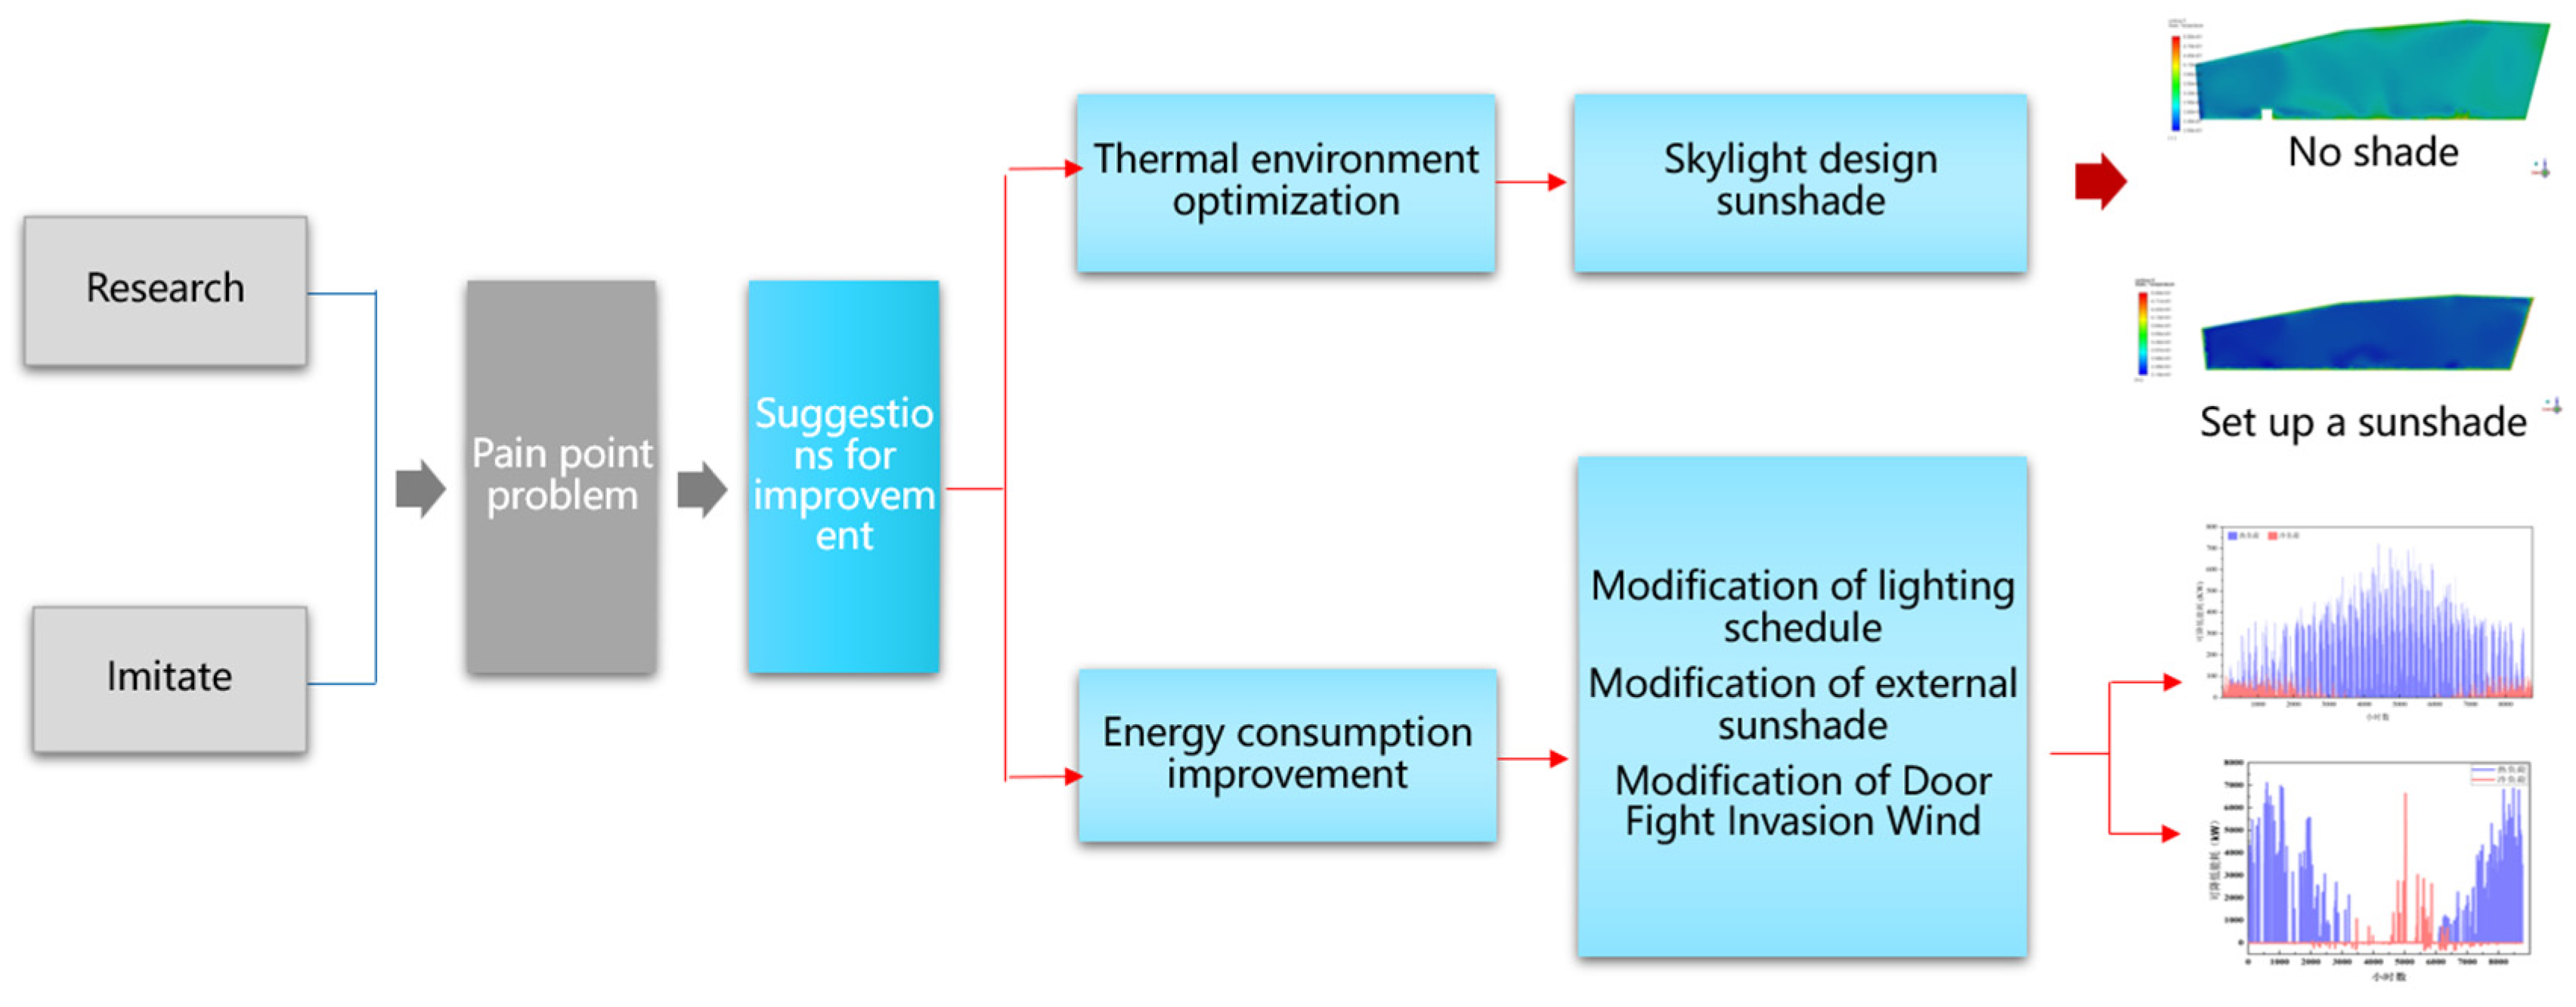
Through on-site research, a post-assessment data database of China’s terminals is built, and a high-precision simulation method suitable for airport terminal design is proposed to provide guidance for the transformation and design of construction projects. Post evaluation process could be summarize in Figure 19. The high-precision simulation methods used in the post evaluation system are detailed in Figure 20. Its guiding role in design is shown in Figure 21.
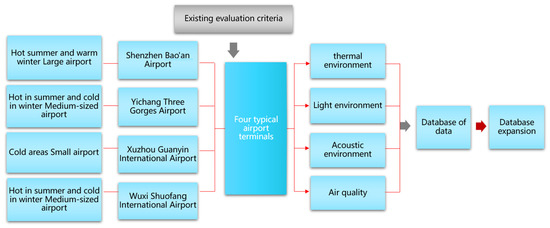
Figure 19.
Post-evaluation method system and database schematic diagram.
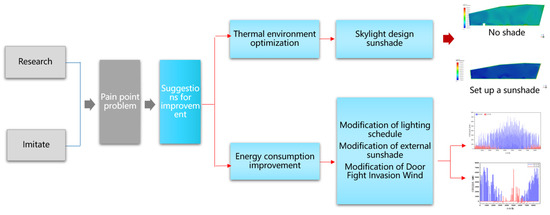
Figure 20.
Schematic diagram of high-precision simulation method.
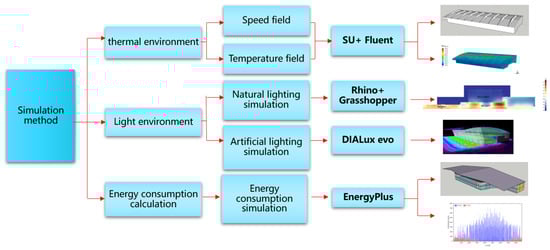
Figure 21.
Schematic diagram of post-assessment.
4.2. Conclusions
- (1)
- The main purpose of this paper is to build an original technical research system of “post-terminal evaluation”, to establish a post-evaluation method system and data database for typical airports, and to provide data support for the improvement of building performance. A comprehensive evaluation of the use effect of the terminal is required from the perspective of passengers and staff.
- (2)
- This study provides strong support for the architectural design of similar projects, investigates diagnostic methods and solutions for the architectural performance of existing airport terminals, and provides guidance, consultation, and solutions for the renovation and design of new airport terminal construction projects.
- (3)
- Subsequent research will also try to adopt intelligent optimization algorithms to achieve key technology optimization and will employ multiple technology combinations based on the contribution rate of each individual technology to meet the safety, low-carbon, economy, and other energy use goals of airport terminals, scientifically support the operators and designers of the airport, and effectively solve existing aviation problems. The pain points and difficulties of the design of the station building improve the design and use effect of the existing terminal.
Author Contributions
Conceptualization, P.X. and Q.Z.; methodology, Q.Z.; software, Y.Y.; validation, Y.Y. and Q.Z.; formal analysis, Y.Y.; investigation, Q.Z.; resources, Q.Z.; data curation, Y.Y.; writing—original draft preparation, Q.Z.; writing—review and editing, Q.Z.; visualization, Y.Y.; supervision, P.X.; project administration, P.X.; funding acquisition, P.X. All authors have read and agreed to the published version of the manuscript.
Funding
This research received no external funding.
Institutional Review Board Statement
Not applicable.
Informed Consent Statement
Informed consent was obtained from all subjects involved in the study.
Data Availability Statement
No new data were created.
Conflicts of Interest
Author Pingli Xu and Qing Zhang were employed by the company Pingli XU Studio, China Aviation Planning and Design Institute (Group) Co. The remaining author declares that the research was conducted in the absence of any commercial or financial relationships that could be construed as a potential conflict of interest.
References
- Liu, Y. Research on the Spatial Morphology Design of Small and Medium-Sized Terminals in China; Xi’an University of Architecture and Technology: Xi’an, China, 2011. [Google Scholar]
- Ren, G. Design Research of the Departure Hall of the Terminal; Tsinghua University: Beijing, China, 2012. [Google Scholar]
- Deng, W. Analysis of the Energy-Saving Design of Terminal Buildings; Xi’an University of Architecture and Technology: Xi’an, China, 2015. [Google Scholar]
- Liu, K. Dynamic Load Simulation and Characteristic Analysis of Terminal; Tianjin University: Tianjin, China, 2009. [Google Scholar]
- Liu, Y.; Zhong, L.; Chen, R. Research on space comfort and green energy-saving design of terminals. J. Archit. 2019, 9, 18–23. [Google Scholar]
- Yu, J.; Lin, B.; Huang, Y.; Zhao, H.; Zhu, Y. Research and analysis of the energy consumption and indoor environmental quality of China’s terminals. J. Tsinghua Univ. (Nat. Sci. Ed.) 2020, 60, 977–984. [Google Scholar]
- Huang, Y.; Zhu, Y.; Lin, B. Analysis of the relationship between passenger satisfaction and space in terminals. Archit. Sci. 2021, 37, 8–14. [Google Scholar]
- Liu, P.; Yang, C.; Zhang, J. Suggestions for analysis and design improvement of indoor thermal environment problems in typical terminals in China. HVAC 2020, 50, 1–7. [Google Scholar]
- GB/T50785-2012; Evaluation Standard for Indoor Hot and Humid Environment of Civil Buildings. China Standards Press: Beijing, China, 2012.
- GB50736-2016; Design Specification for Heating, Ventilation and Air Conditioning for Civil Buildings. China Standards Press: Beijing, China, 2016.
- GB50033-2013; Evaluation Standards for the Light Environment Refer to the Architectural Lighting Design Standard. China Standards Press: Beijing, China, 2013.
- GB50034-2013; Architectural Lighting Design Standard. China Standards Press: Beijing, China, 2013.
- GB9672-1996; Public Transportation Waiting Room Hygiene Standard. China Standards Press: Beijing, China, 1996.
- GB/T18883-2002; Indoor Air Quality Standard. China Standards Press: Beijing, China, 2002.
- Chao, J.; Hu, J.; Pan, Y. Design and operation status of the terminal system of ventilation and air conditioning in the airport terminal. HVAC 2021, 51, 7. [Google Scholar]
- Wang, W.; Wu, J. Research on the energy consumption analysis method of airport terminals based on eQUEST. J. Civ. Aviat. Univ. China 2013, 31, 34–37+53. [Google Scholar]
- GB 50189-2015; Design Standard for Energy Efficiency of Public Buildings. China Standards Press: Beijing, China, 2015.
- Meng, Q.; Chen, Z. Simulation and Research on Indoor Environment Control Mode Basing on Thermal Comfort: A Case Study in the Aviation Building in Sanya Airport. In Proceedings of the Building Simulation 2007, Beijing, China, 27–30 July 2007. [Google Scholar]


Disclaimer/Publisher’s Note: The statements, opinions and data contained in all publications are solely those of the individual author(s) and contributor(s) and not of MDPI and/or the editor(s). MDPI and/or the editor(s) disclaim responsibility for any injury to people or property resulting from any ideas, methods, instructions or products referred to in the content. |
© 2025 by the authors. Licensee MDPI, Basel, Switzerland. This article is an open access article distributed under the terms and conditions of the Creative Commons Attribution (CC BY) license (https://creativecommons.org/licenses/by/4.0/).