1. Introduction
The world marine framework contains an extremely rich amount of environmental and biological diversity, which is constantly threatened by interaction with man. It represents a complex system that requires constant monitoring in order to preserve and safeguard its integrity. As an essential tool to perform environmental surveys, remote sensing is one of the most recognized technologies employed to probe the marine environment, assess its health status and promptly understand the extent of potentially critical threats.
Data collected through satellite missions usually enable a number of quantitative assessments such as biogeochemical measurements, marine traffic estimation, including vessel classification and kinematics estimation, the analysis of the physical processes to fine tune predictive meteorological models, etc. The latter topic assumes a key role also within a decision-making framework, since correct outcomes of predictive models can be effectively exploited to foster a sustainable economy and, simultaneously, ensure marine preservation. To this purpose, it is crucial to address the physical phenomena that imply the emergence of specific scenarios and learn their distinctive features to design systems for the recognition of the various observable circumstances. The dynamical processes responsible for the peculiar combination of marine masses with different biophysical properties can be observed through the analysis of Sea Surface Temperature (SST) imagery [
1].
These geolocated temperature maps are collected through radiometers installed aboard satellite missions (METOP, MODIS Terra/Aqua), and provide information with a fine spatial and temperature resolution (respectively, 1 km and 0.01 °C), at a relevant capture rate (up to three images per day). From the analysis of the SST images, it is possible to identify specific spatial configurations, whose occurrence is repeatedly observed through time, and that may relate to particular evolutions of the environmental scenario. The objective of this work is the implementation of algorithms for the detection and recognition of specific patterns in SST data that emerge as relevant for the understanding of the physical, chemical and biological evolution of a given marine region. The proposed methodology is based on the observation of the spatial relationships between the pixels in the SST maps integrated with temporal information provided by the observation of the same area at several consecutive time steps.
The rest of the document is arranged as follows:
Section 2 introduces the employed data typology and the methods implemented for the classification purpose;
Section 3 concludes the paper by discussing some preliminary results concerning the application of the presented methods.
2. Materials and Methods
As a case study, we focused on the south-western coast of the Iberian Peninsula, near Cape S. Vicente, which is one of the most interesting and least-studied upwelling ecosystems [
2]. The dataset used in our analysis consisted of SST maps of this region coming from both NASA’s Aqua and EUMETSAT’s METOP satellites. In this scenario, experts visually identified different typologies of mesoscale events that occurred in the analysed time range, caused by upwelling phenomena. An event was assigned to one of these classes depending on the presence and the direction of cold water filaments or warm counter-currents (see [
3] for more details). The objective was to start from this ground truth and design and develop dedicated image processing methods to automatically detect and classify these mesoscale patterns.
We developed a small suite of Python scripts that extracted information from the satellite SST data, so that we could examine the dynamics of the SST in a small area in the period of time preceding the occurrence of an event. In particular, the tool produced a spaghetti plot in the following way:
The area that consisted of an adaptable rectangular bounding box was subdivided into small squares of fixed dimension, typically hundredths of latitude/longitude degrees (see figures in
Section 3);
For each square, the sequence of temperature values corresponding to the selected period was plotted against time, where a temperature value at a given time was obtained by averaging all the data with geographical coordinates contained in the square;
The plots relative to all the squares were superimposed on a common reference system.
A colour was assigned to each small square so that neighbouring squares had similar colours, and a single graph in the spaghetti plot had the same colour as the square it referred to. This way, it was easier to identify trends in different zones of the target area.
The tool took into account some difficulties that could arise when dealing with satellite SST maps. For example, the presence of some atmospheric conditions (e.g. clouds) may interfere with the sensor’s scan and produce unreliable data. In fact, the datasets described the quality of their data by assigning a quality level to each measured temperature value. Our tool allowed discarding bad quality data or computing a weighted average in step 2 above, where a lower weight was given to bad quality data.
Once the spaghetti plots were computed, we analysed them in conjunction with the classification provided by experts, in order to identify different dynamic patterns associated with specific types of events; thus, laying the groundwork for an automatic supervised association.
3. Preliminary Results and Conclusions
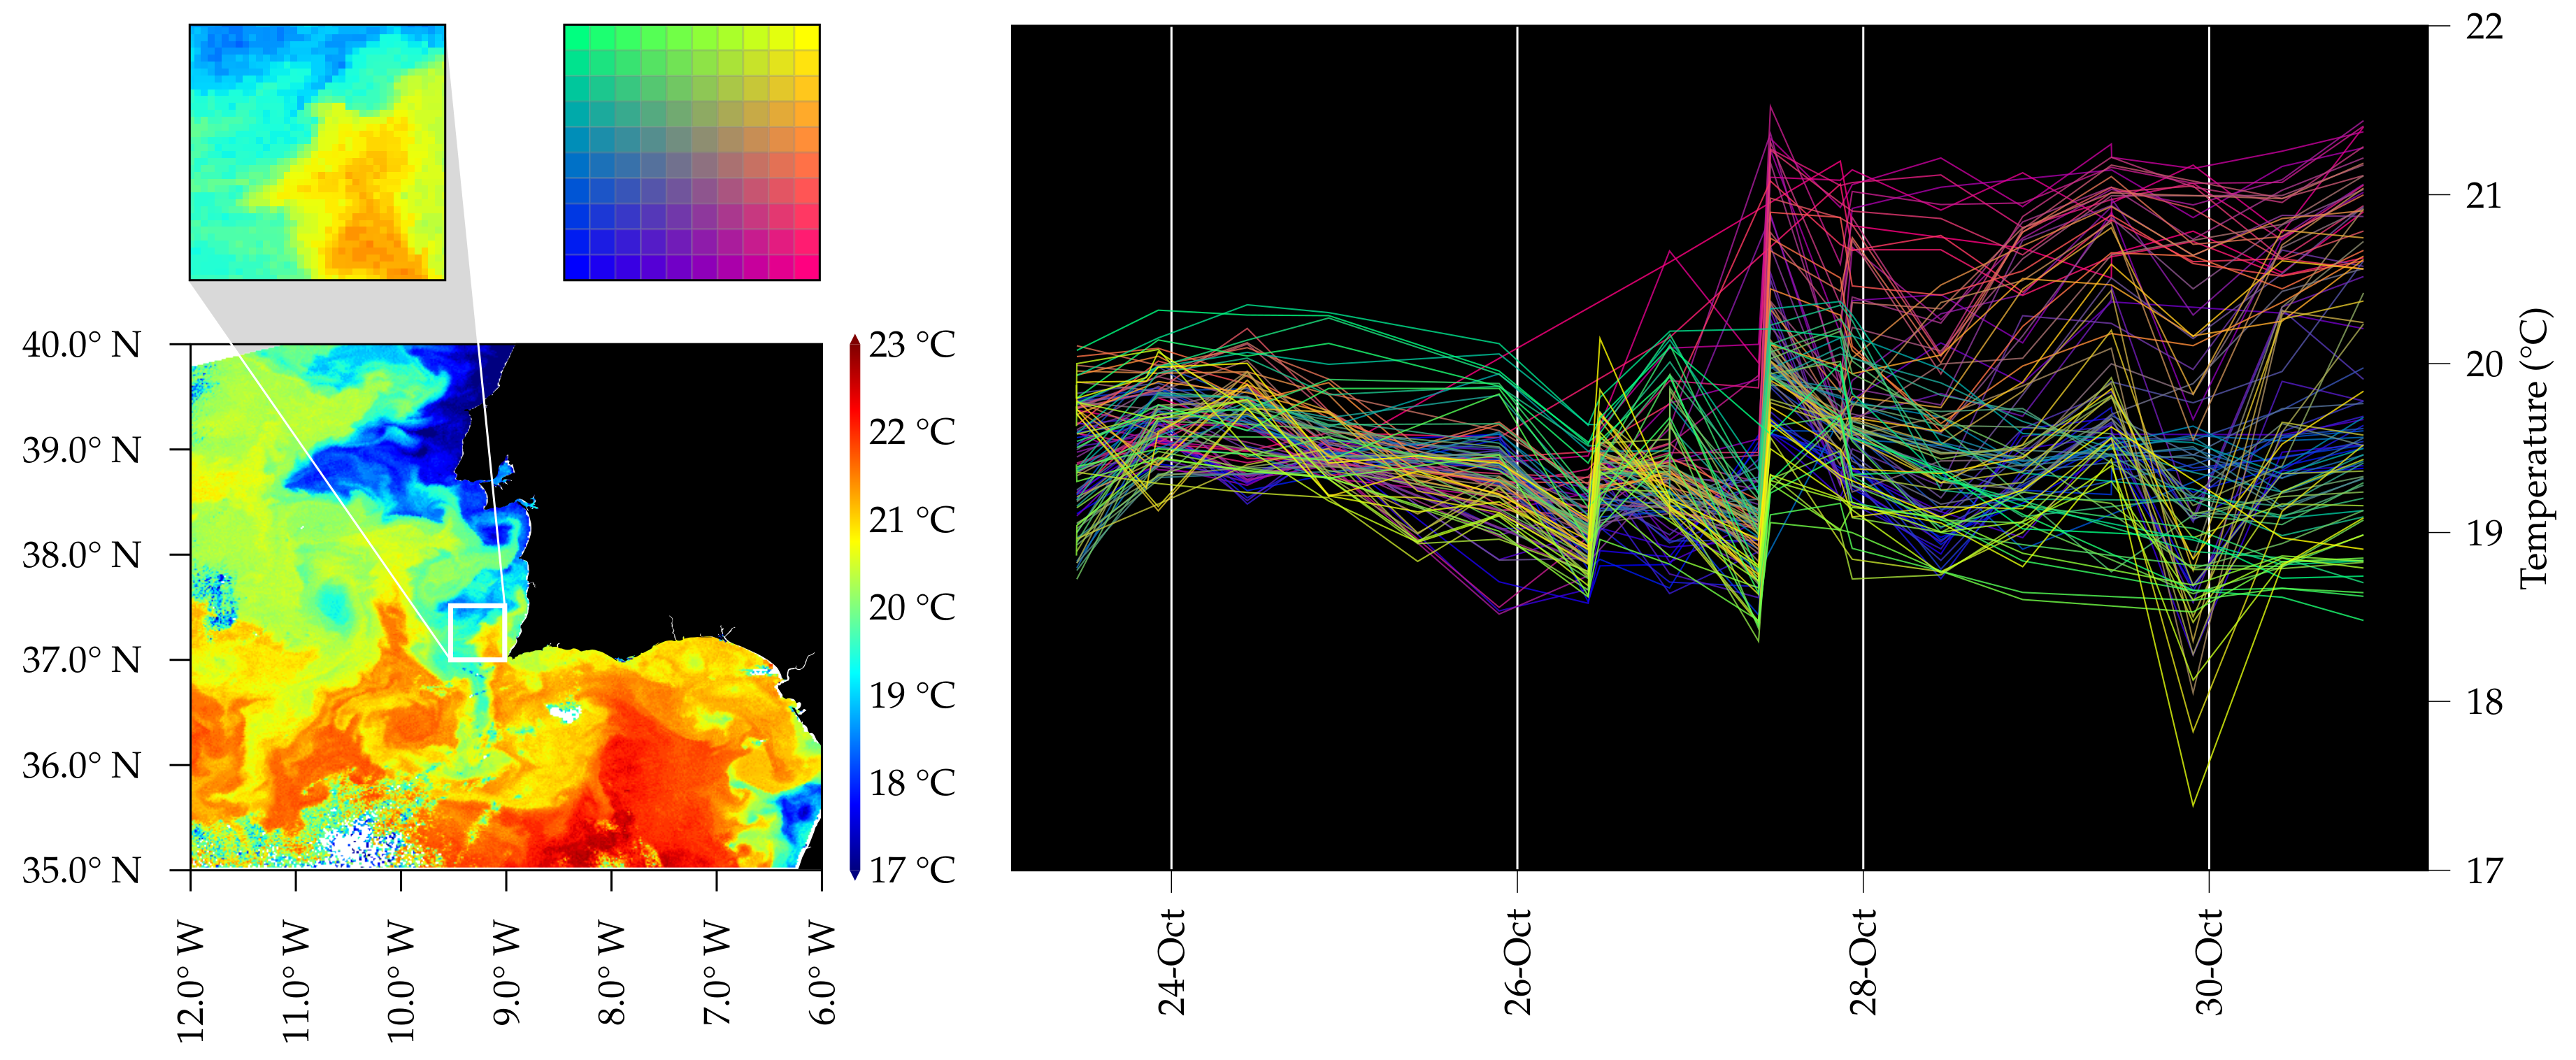
Several processing steps were carried out on the selected dataset. In particular, the year 2017 was selected as a first case study. Following the classifications provided by the experts, with a series of different events identified on specific dates, the dynamics of the upwelling phenomena were analysed in detail by considering an interval of 10–14 days before the classified event, focusing on the geographical areas where relevant upwelling features were detected. The produced spaghetti plots were then associated with the classifications assigned to the specific events and analysed with the experts to identify significant patterns. Following the application of our methodology, results in the form of spaghetti plots are shown below, for each selected event and period. As discussed above, the small grid in each figure represents the colour code for the respective spaghetti plot, with each line in the diagram referring to the square with the corresponding colour.
The first example (
Figure 1) is a typical mesoscale event, consisting of a warm counter-current that went westward from the Gulf of Cadiz south to the tip of the Iberian Peninsula, crossing Cape S. Vicente, and then heading north along the coast. As can be seen from the related spaghetti graph, the temperatures in the lower right corner (near Cape S. Vicente) increased with a much more pronounced gradient (red and magenta lines) with respect to the other surrounding areas—this identified a possible first dynamic pattern.
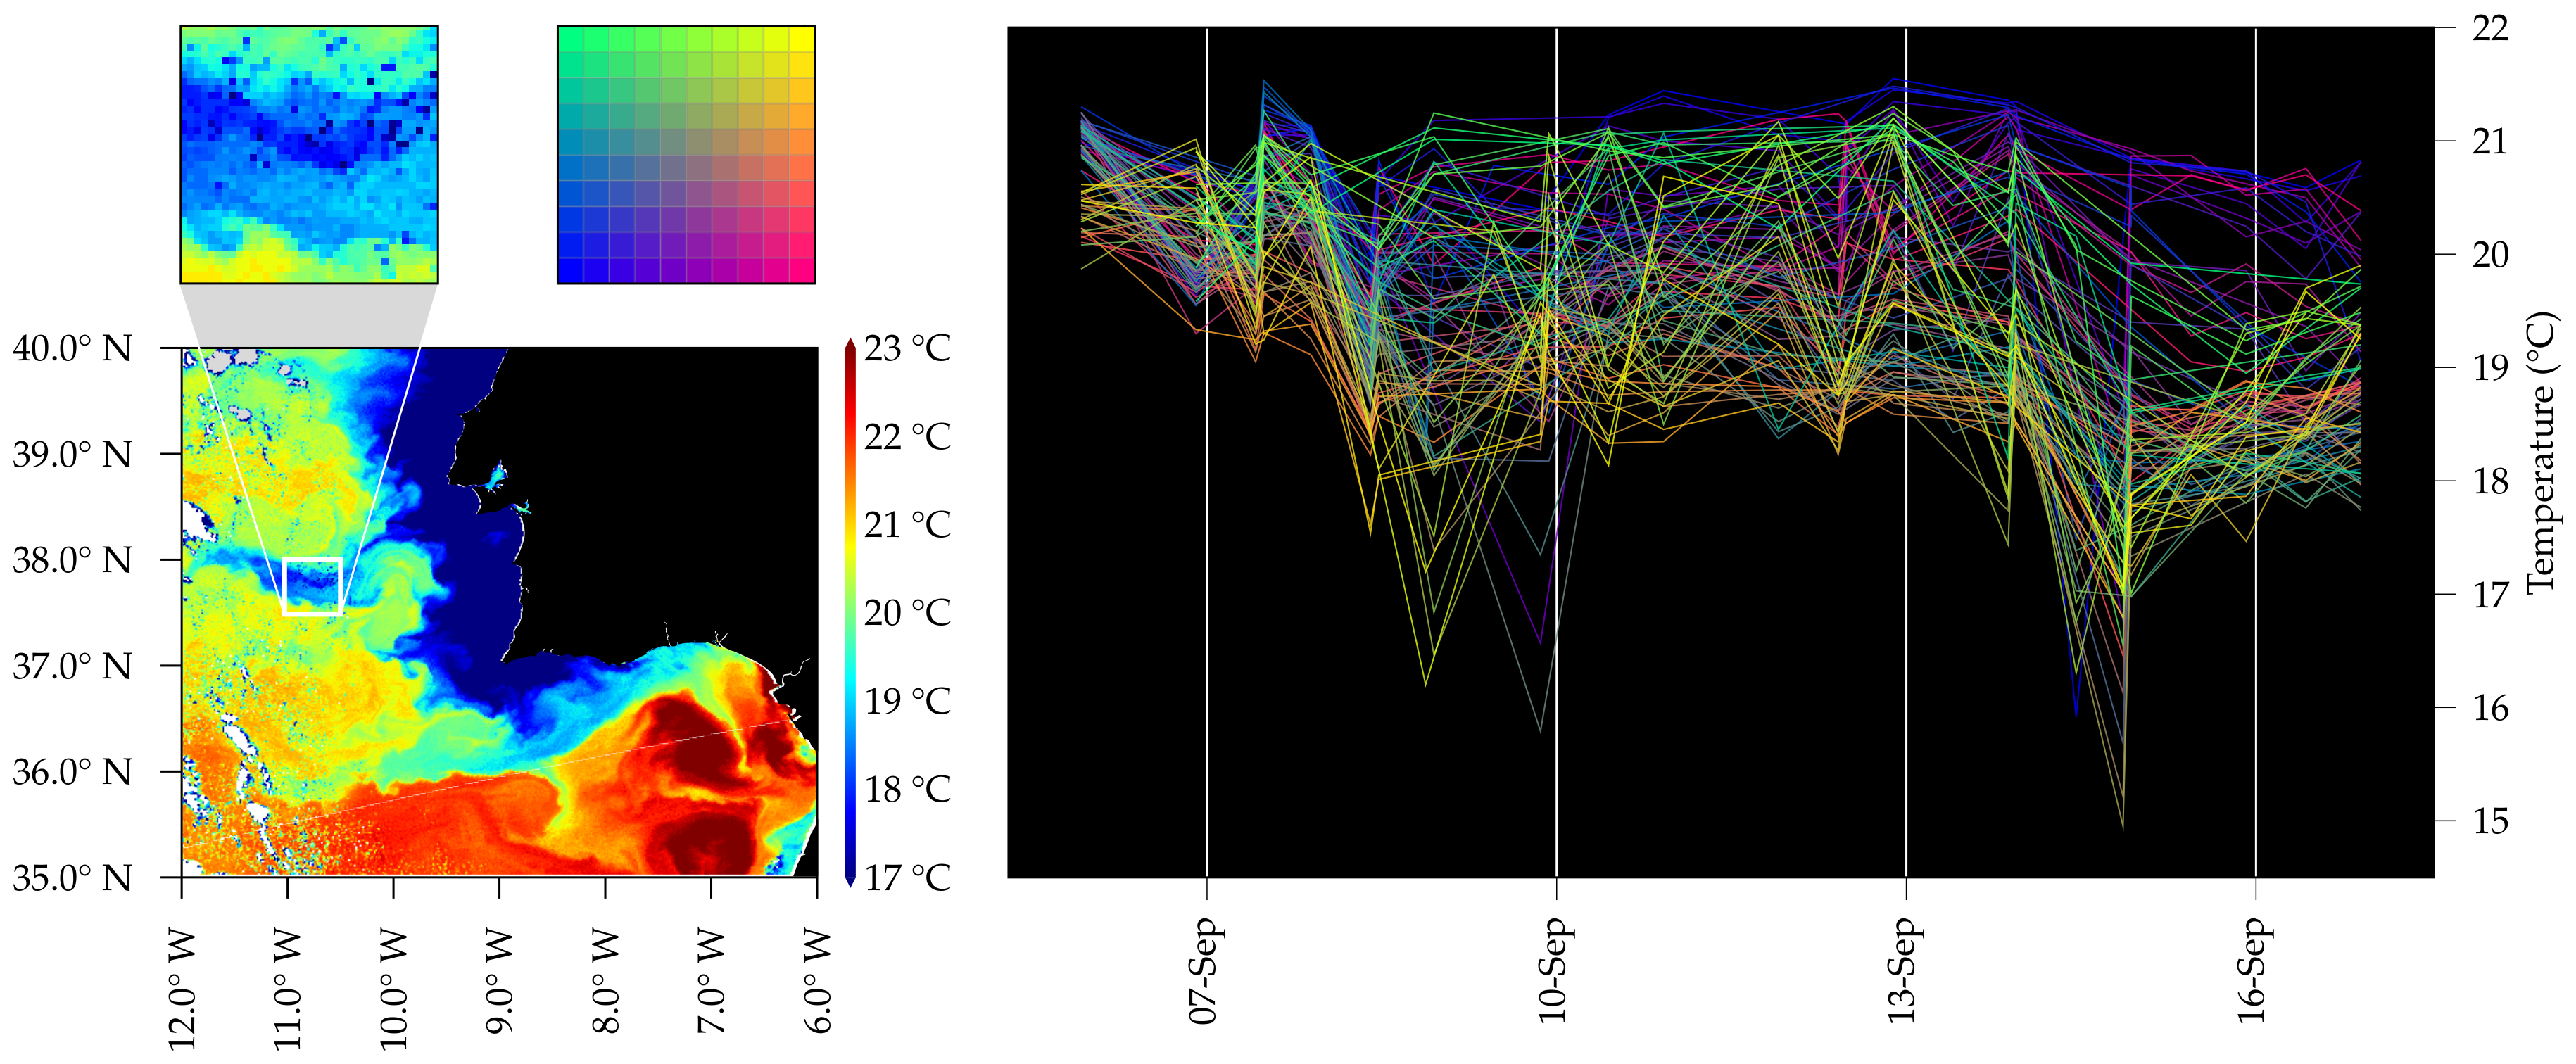
As a second example, we showed a different type of event, consisting of a cold filament moving west from the coast of Portugal into a warmer area (
Figure 2). For this case study, the spaghetti plot outlines a dynamic trend of the north-eastern area (yellow lines) which decreased its temperature more rapidly and before the westernmost one (blue and green lines) (i.e., a higher negative gradient with respect to the western area).
The method was applied to different time intervals before the specified events to understand if they could be associated with specific dynamic patterns. In addition, we also ran the same analysis on periods where no events were identified to analyse a different specific pattern related to a “no event” period.
The preliminary results of this ongoing study were promising and showed possible differentiation patterns between different mesoscale events occurring in the analysed area. Future work will extend these preliminary patterns identification results to more distinct and extended events to define a complete collection of patterns. A relevant issue that is worth addressing in future work concerns the presence of large regions of missing data in the input imagery. Indeed, the signal received by the satellite may be so disturbed that the sensor’s quality control decides to discard it altogether, leaving a zone of missing data in the SST map. This, combined with the fact that a satellite provides only two to three images per day, may lead to misleading plots due to data undersampling. At present, our tool cannot deal with this issue. One possible solution is to increase the number of considered datasets, possibly from other remote sensing missions, to try to fill the gaps.
The test and validation of the proposed algorithm was carried out and will continue as part of the activities of the EU H2020 project NAUTILOS [
4].


