1. Introduction
Coatings are commonly used to improve the surface properties of individual parts. Various functional properties, such as corrosion resistance, wear resistance, sliding properties, heat resistance, and biochemical resistance, may be changed by the application of coatings.
One of the most important parameters is coating thickness. Thickness influences whether the required properties are met. An insufficient coating thickness may cause the part to fail, for example, due to its insufficient protection against corrosion, heat, etc. Coating thickness is, thus, a commonly measured quantity. Many different nondestructive techniques were created in recent years. Commonly, coating thickness is measured from one point by contact devices, based on eddy current or magnetic principle. Nonetheless, measurement is limited to suitable material combinations (e.g., for an eddy current, the substrate must be from an electrically conductive material).
Successful coating inspection can also be performed by means of active thermography, as described in, e.g., [
1,
2,
3]. One of the most-used techniques is flash pulse thermography. The technique is based on specimen excitation by a short pulse (few ms) with a high-power flash lamp and the recording of temperature response by an infrared camera. The response can show changes in heat transfer connected to variations in coating thickness. The detection of coating thickness variations using flash pulse thermography was, for example, reported in [
4,
5,
6]. Thickness inspection was mostly performed via the application of fast Fourier transform. A suitable phasegram (result of FFT-phase) showed differences in coating thickness. In studies [
1,
7], the result was transformed from phasegram form to thickness maps via calibration. A similar approach was described in [
2] where, instead of FFT, a time transformation method was used, which provided slightly better results
The problem with flash heating is that the heating is not homogenous and, thus, some parts heat up differently. This can mask small temperature-response differences in layers with different coating thicknesses. This problem may be solved by using a laser, which can provide a superior repeatability. Many different types of laser excitation can be included in laser thermography. The type of suitable excitation primarily depends on the material being tested, the type of defect (or material properties) and, last but not least, on the laser itself.
The proposed technique is based on scanning the specimen point by point, and transforming the sequence to a sequence similar to flash pulse thermography, and then applying well-known and tested pulse thermography-processing algorithms (such as the FFT-phase).
2. Methods
The principle of the proposed technique is in the excitation of sample, which is performed point by point by a laser scanning head. Each area is excited only by one pulse Three main conditions must be met.
The first one is that, after a point is excited, the area in which point is placed must completely cool down before it is excited again. If this condition is not met, each point is excited differently. The second condition is that the laser must always provide the same energy. Otherwise, the laser excitation leads to inhomogeneous heating (similar to flash excitation).
The third condition is that the beginning of each laser excitation must be in sync with the capture of frames by IR camera.
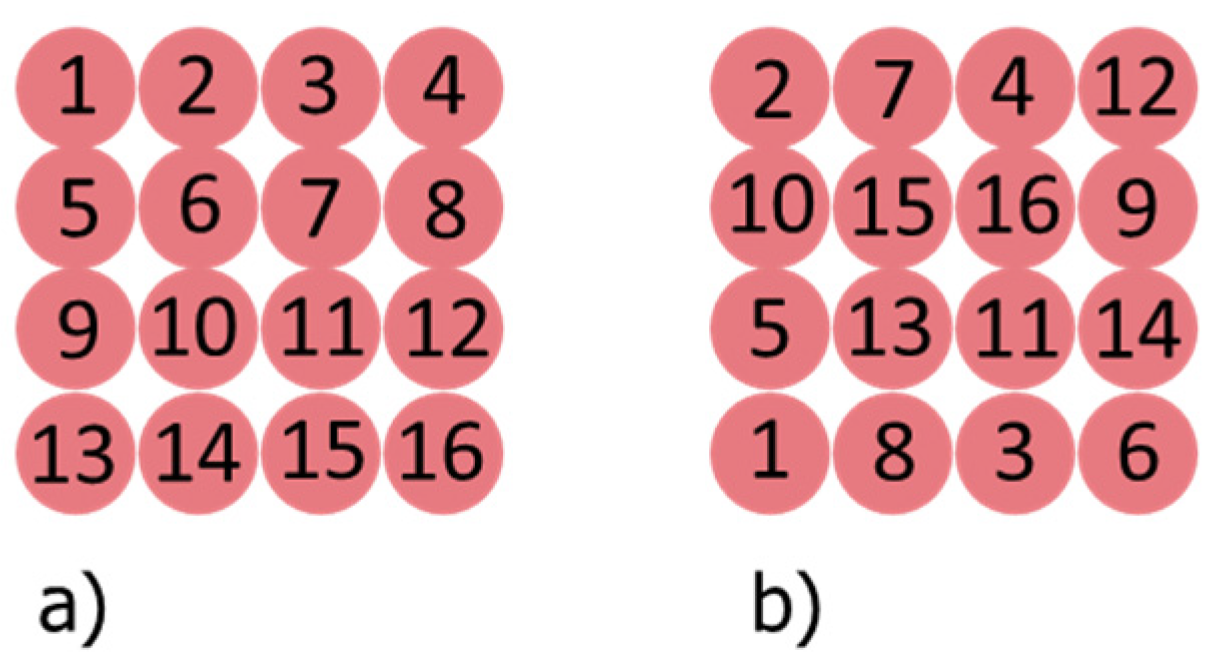
A standard sequential heating of the neighboring places shown in
Figure 1a would lead to very long measurement times, as the next point is in an already heated area. Therefore, an optimization of the scanning procedure was applied, according to
Figure 1b.
Optimization was performed via the Matlab algorithm. This accounted for the excited area, excitation duration and duration of cooling. The next step was the creation of a modified sequence. That is performed by moving the beginning of each laser spot to time zero. In this way, the temperature responses from each point start at the same time, and many processing algorithms that were developed for flash pulse thermography can be used.
3. Experimental Procedure
Experiments were performed on a specimen made of a 4.91 mm thick steel substrate with a Cr13%Fe coating manufactured by twin-wire arc spraying technology. The specimen contained four areas (each 20 × 25 mm) with different average coating thicknesses: 0.14, 0.28, 0.39 and 0.48 mm.
The specimen was measured by means of laser thermography and flash thermography. An excitation source for flash thermography was a flash lamp Hensel 6000 J (6 ms pulse length). IR camera Flir SC7651 (MWIR) was used for temperature response measurement after flash excitation. The framerate was set to 250 Hz and 4 s (1000 frames) after excitation was recorded.
For laser excitation, laser system containing a UV continuous wave laser Oxxius LBX-375 HPE (wavelength 375 ± 5 nm, stability 0.24%, max power 400 mW, divergence 2.2 mrad) with scanning head Scancube 14 was used. Point distribution (order) was calculated with Matlab algorithm. Excitation duration was set to 50 ms and output power was set to 225 mW. The same IR camera (Flir SC7651) was used to record temperature response after laser excitation. Camera framerate was set at 250 Hz. An area of 80 × 30 mm was excited by 270 laser spots. Measurement took 18.94 s. Artificial sequence (after spot time shift) was 500 ms long. The specimen was measured in two positions—standard and rotated by 180°, which was made to confirm the stability and repeatability of the measurement. Processing was performed by fast Fourier transform.
4. Results
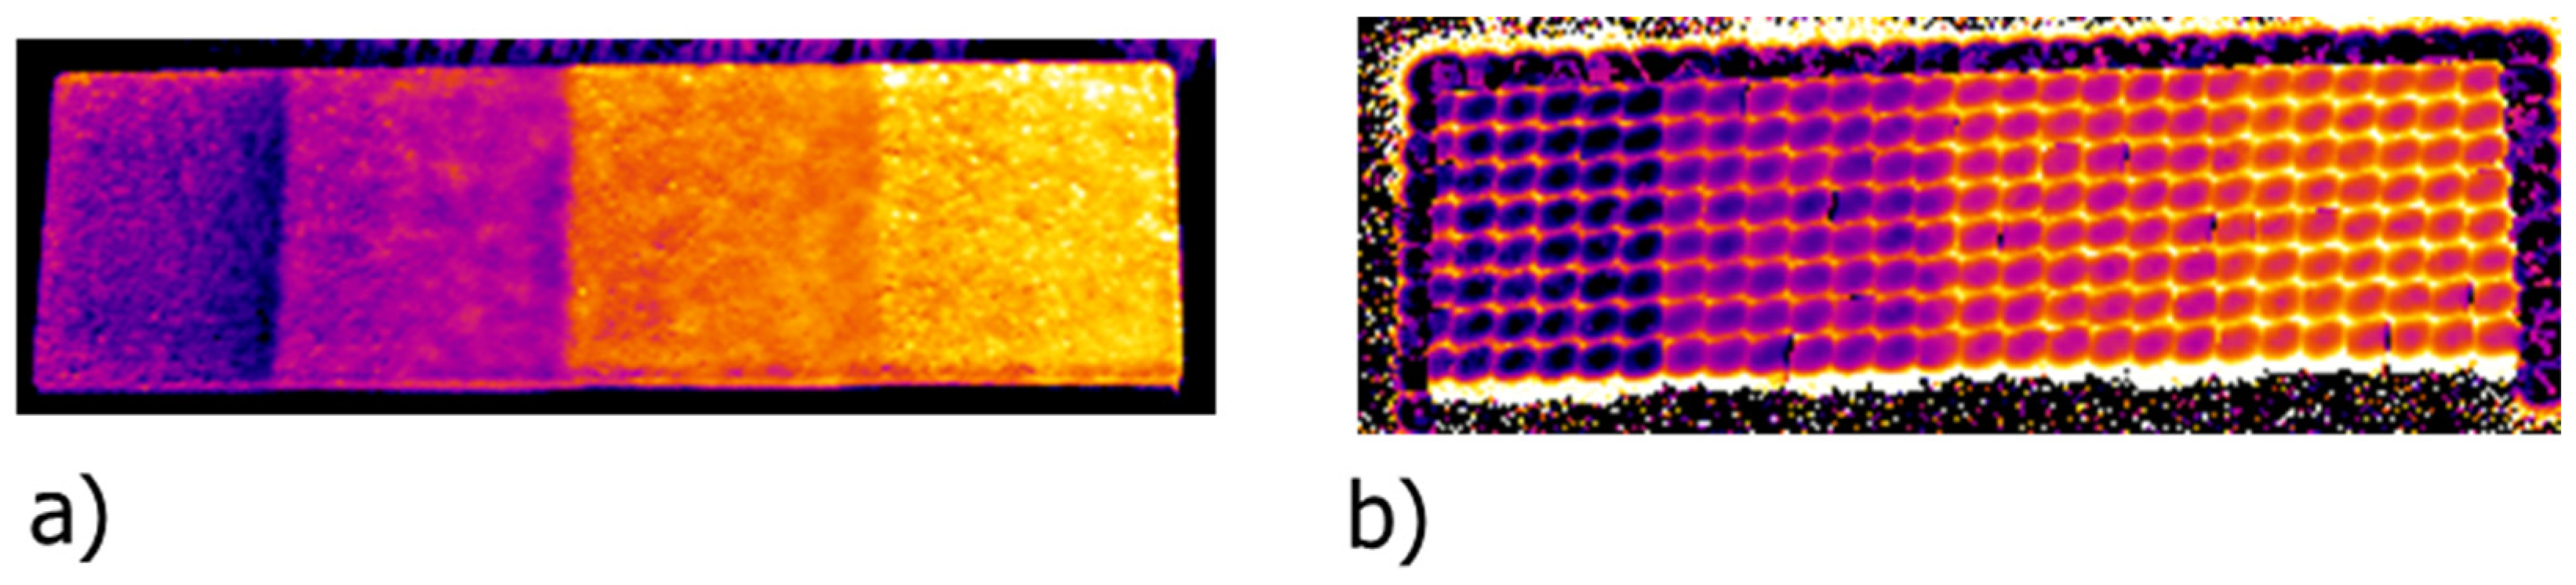
Figure 2 shows the results of the experiment. Areas with different coating thicknesses could to distinguished by both flash and laser thermography. Average values from areas with different thicknesses are given in
Table 1. The table also shows the results for specimens rotated by 180°.
The results in
Figure 2 and
Table 1 show that the differences between standard and rotated measurements are evidently higher for flash thermography—the average difference in flash thermography measurement is 0.020, whereas the average difference for laser thermography is 0.004. It was shown that the difference was biggest for areas close to the edges.
The comparison confirms the higher stability and repeatability of the suggested laser thermography procedure. The worse result of the flash thermography measurement is mainly caused by non-homogenous heating by the flash lamp. In contrast, each point illuminated by the laser was excited with the same power. The main disadvantage of the laser system compared to flash thermography measurements are longer measurement times (time of measurement was approximately 19 s and 4 s for the laser and flash thermography, respectively).
5. Conclusions
The paper described the laser thermography approach to coating inspection. The system consisted of a low-power laser with a scanning head. The approach was based on point-by-point surface scanning and the creation of an artificial sequence where all excitation starts at one time. Processing was carried out with Fast Fourier Transform.
It was shown that this processing technique can be used with the proposed laser thermography. Comparison with a standard flash-pulse thermography procedure confirmed that the main advantage of the laser system is a homogenous excitation under the laser head. Both methods allowed for the different thicknesses of the tested Cr13%Fe coating to be distinguished. However, a comparison of experiments with the rotated Cr13%Fe coating samples showed that the repeatability and homogeneity of the laser thermography can be up to five times better compared to standard flash-pulse thermography. This can bring essential advantages to the excitation of areas with small differences in thermal properties, where flash lamp heating can mask the small differences in heat transfer caused by inhomogeneous heating.
It was shown that, with a rather simplistic approach, laser thermography could improve the excitation for active thermography measurements. Notably, almost every laser with a decent stability (around 5%) could ensure a more uniform and repeatable excitation than a flash lamp. Lasers that meet these conditions are quite common, as they are typically used for laser marking.


