Proceeding Paper

Investigation of Tooth Friction Conditions of Electric Vehicle Gearbox with Plastic Gears †

Department of Road and Railway Vehicles, Audi Hungaria Faculty of Vehicle Engineering, Széchenyi István University of Győr, 9026 Győr, Hungary
Presented at the Sustainable Mobility and Transportation Symposium 2024, Győr, Hungary, 14–16 October 2024.
Eng. Proc. 2024, 79(1), 85; https://doi.org/10.3390/engproc2024079085
Published: 12 November 2024
(This article belongs to the Proceedings of The Sustainable Mobility and Transportation Symposium 2024)

Abstract

:
Earlier, I created a mathematical model of the gear unit, in which the value of the tooth friction was determined during precalculation and then entered into the model as a constant parameter. In this paper, I investigate how much viscosity oil is required at different operating points for a single-stage gear unit with plastic gears to function properly and how this affects the tooth friction and, hence, the loss of energy in the gear unit. Once the investigations are complete, the tooth friction is determined using an automated MATLAB function, which allows the tooth friction to be re-determined at each operating point. This allows for a more accurate strength dimensioning of the plastic gears in the gear unit and a more accurate model describing the gear unit’s behaviour.

1. Introduction

The aim is to design and optimise a powertrain that can be installed in an electric racing car. In many cases, an electric racing car is driven by a hub motor. The purpose of building and developing the current powertrain model is to be able to investigate other powertrain designs from an energy point of view.
Within the energy analysis of the powertrain, special emphasis will be given to the study of the gear tooth friction and its impact on the energy loss of the powertrain. Since the gearbox is designed for an energy-efficient racing car, its design is different from classical solutions for road vehicle propulsion. This means that the gearbox does not have a separate housing, bearings and sealed oil lubrication, but the use of a lubricant is necessary, and the characteristic properties of the lubricant, such as its viscosity, need to be determined and its effect on the tooth friction investigated [1].
During the pre-design of the gearbox, the value of the tooth friction was determined during a precalculation and then entered into the model as a constant parameter. The problem with this approach is that it is not automated, so during the energy analysis or a possible optimisation of the gear unit, tooth friction is always present in the model as a constant value, whereas in reality, the value of the tooth friction is different at different operating points [2].

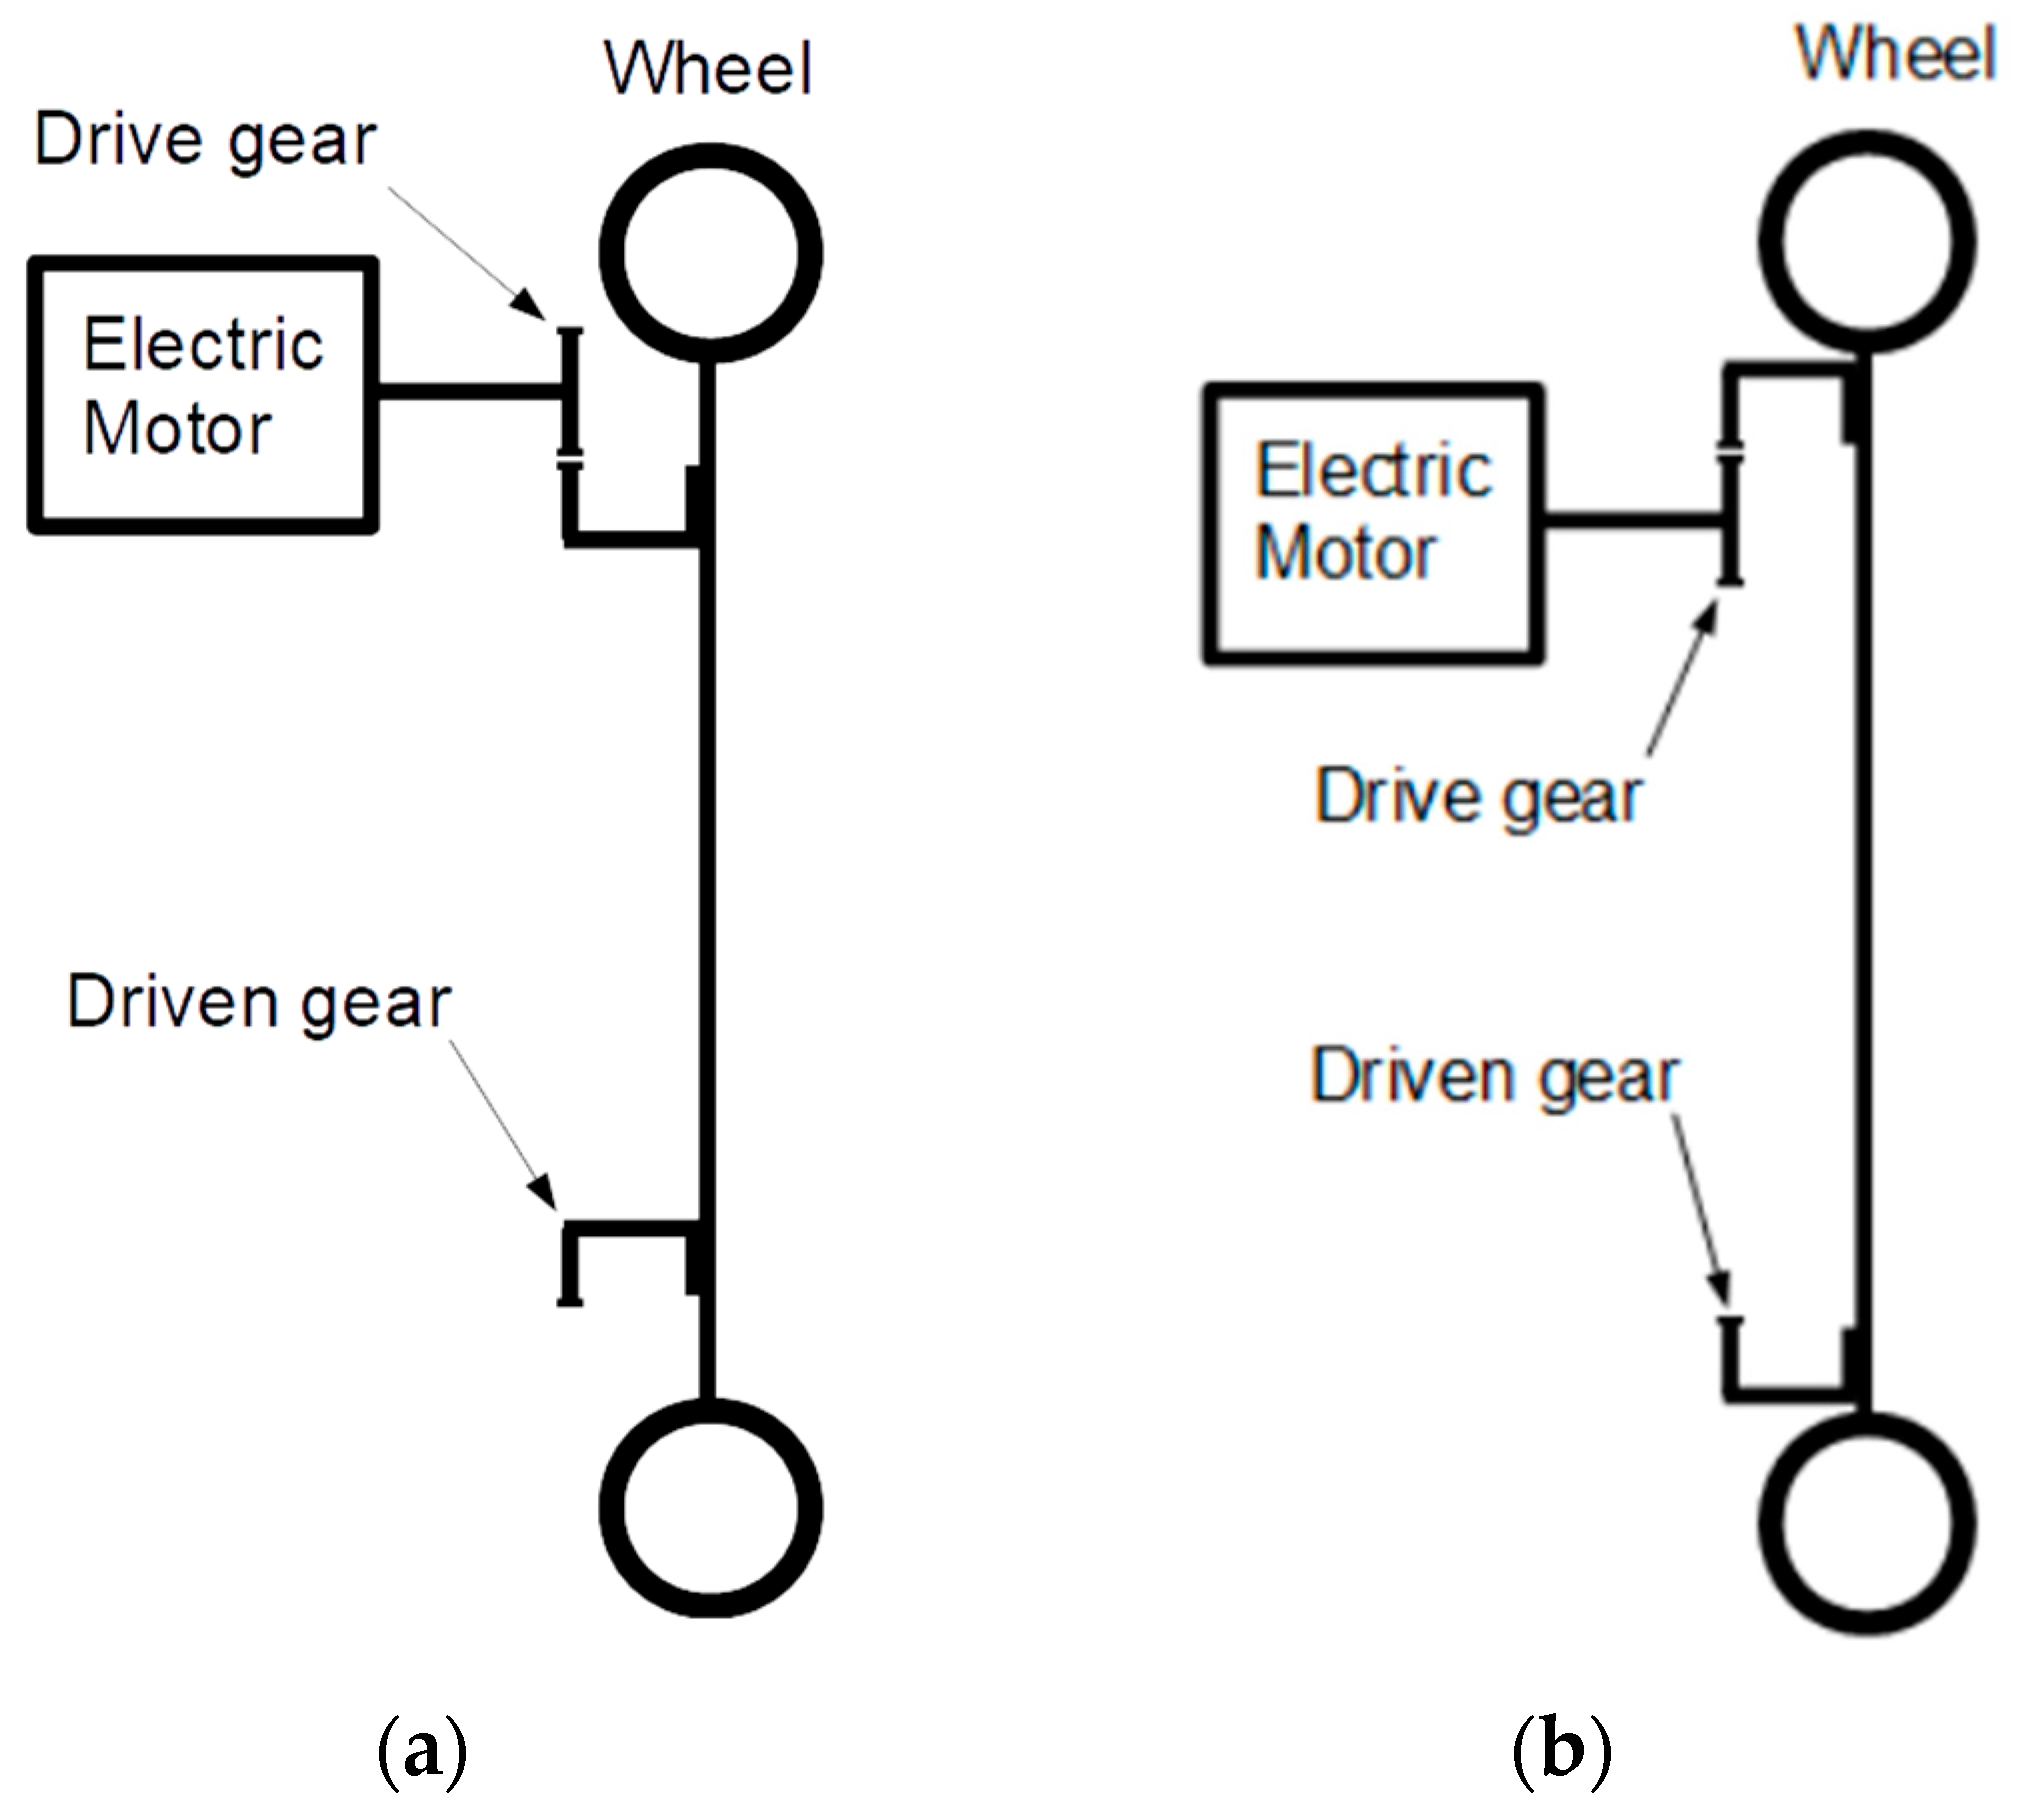
2. Presentation of the Concept of the Single-Stage Gear Unit Model

As already mentioned in the Introduction, the aim is to design and optimise a powertrain that can be installed in an electric racing car. The purpose of building and developing the current drivetrain model is to test the energetic behaviour of a drive train with plastic gears in the drivetrain. The following characteristics have been taken into account in the development of the mathematical model:
  • The power source is an internal-rotor permanent-magnet motor;
  • The gearbox is a single-stage unit with plastic gears;
  • The gearbox has no separate housing, bearings and sealed oil lubrication;
  • So, a rigid frame and running gear must be designed and constructed;
  • The bearing and seal friction loss on the drive side are reflected in the engine model;
  • The bearing and seal friction loss on the output side are reflected in the vehicle running resistance;
  • The lubrication of the gearbox is achieved by greasing every run.
Taking into account the characteristics listed above, the following two driveline variants should be considered:
  • Mathematical modelling of a single-stage gearbox with plastic gears for the case of an external gear connection, as shown in Figure 1a;
  • Creating a mathematical model of a single-stage gearbox with plastic gears for the case of external–internal gear contact, as shown in Figure 1b.

2.1. The Gear Materials

Plastic gears are used in applications where their load capacity is sufficient but other favourable properties may be important, such as the following:
  • Smooth, quiet running;
  • Corrosion resistance;
  • Wear resistance;
  • Impact resistance;
  • Low weight.
The abovementioned properties have led to the possibility of using plastic gears for the drive train designs described in the previous section [3].
Two types of plastic gears are generally used for gear manufacturing.
One is Polyoxymethylene, also known as Polyacetal (POM), a synthetic engineering plastic. Its technical properties are based on the fact that as a thermoplastic (partially crystalline), it is easy to process, and its chemical structure gives it a high tendency to crystallise. It is often used as a base material for plastic gears and plain bearings.
The other plastics typically used are polyamides (Pa), which are polymers whose monomers are linked by amide bonds. There are natural polyamides (e.g., proteins), but there are also known man-made polyamides, most of which are thermoplastic polycondensation plastics. The molecules of man-made polymers contain carboxyamide groups in a linear polymer chain, which are regularly spaced [4].
In general, they have a relatively high strength (70,110 MPa) and hardness (Rockwell hardness: M 85–M 98) and good fatigue strength, damping capacity and slip properties (μ = 0.15–0.5), as well as wear resistance. They can be used in a relatively wide temperature range (−40 °C to +140 °C).
Their main applications are bearing bushings, support bearings, guide and wear plates, conveyor rollers, rope pulleys, cams, stops, gears, racks and sprockets.
Gears mounted on the shaft of the driving electric motor are made of polyamide (Pa), and large gears mounted on the wheel are made of polyoxymethylene (POM).

2.2. Definition of the Lubrication System

Examining Figure 1a, it can be seen that the drive in this drive system is a single-stage gear drive using plastic gears. The gearbox does not have a closed housing, so oil lubrication is out of the question, which is why it is advisable to use plastic gears, because in this case, grease lubrication or, if necessary, dry running without lubrication is not a problem [5].
In the case of greasing, it is advisable to grease the gears at the beginning of each race.
When grease lubrication is used, as with oil lubrication, the viscosity of the chosen lubricant is of key importance. In the case of lubricating fats, this should be interpreted as the lubricant having a harder soap framework that encloses the base oil. During use, the soap skeleton breaks down and the base oil comes out, which performs the lubrication. For different types of grease, the viscosity of the base oil varies, typically depending on the use, as follows [6]:
  • The base oil viscosity of lubricating greases for bearings and gears under low loads and relatively high speeds is typically around 20 cSt at 40 °C.
  • For lubrication of general ball and roller bearings, a base oil viscosity of 80–200 cSt is appropriate.
  • For heavy-duty, low-speed equipment (industrial equipment), a base oil viscosity of 150–500 cSt is required. Greases with even higher base oil viscosities are also available for special conditions.

2.3. Drive Unit Parameter Vector Determination

The drive unit model is constructed so that the drive unit loss is determined by a steady-state examination at work points. This work point examination makes both dynamical and analytical mathematical model application possible during optimisation. Parameter determination has key importance in model construction, by which the drive unit can be optimised [7]. These parameters are independent variables, which can unambiguously determine a given drive unit [8]. Parameter vectors create a space, in which drive unit optimisation is achieved. The drive unit parameter vector is determined as in Equation (1):
p[i, m, aw, b, α, β]
where:
  • Transmission ratio, [−], i;
  • Module, mm, m;
  • Centre distance, mm, aw;
  • Gear width, mm, b;
  • Pressure angle, rad, α;
  • Helix angle, rad, β.

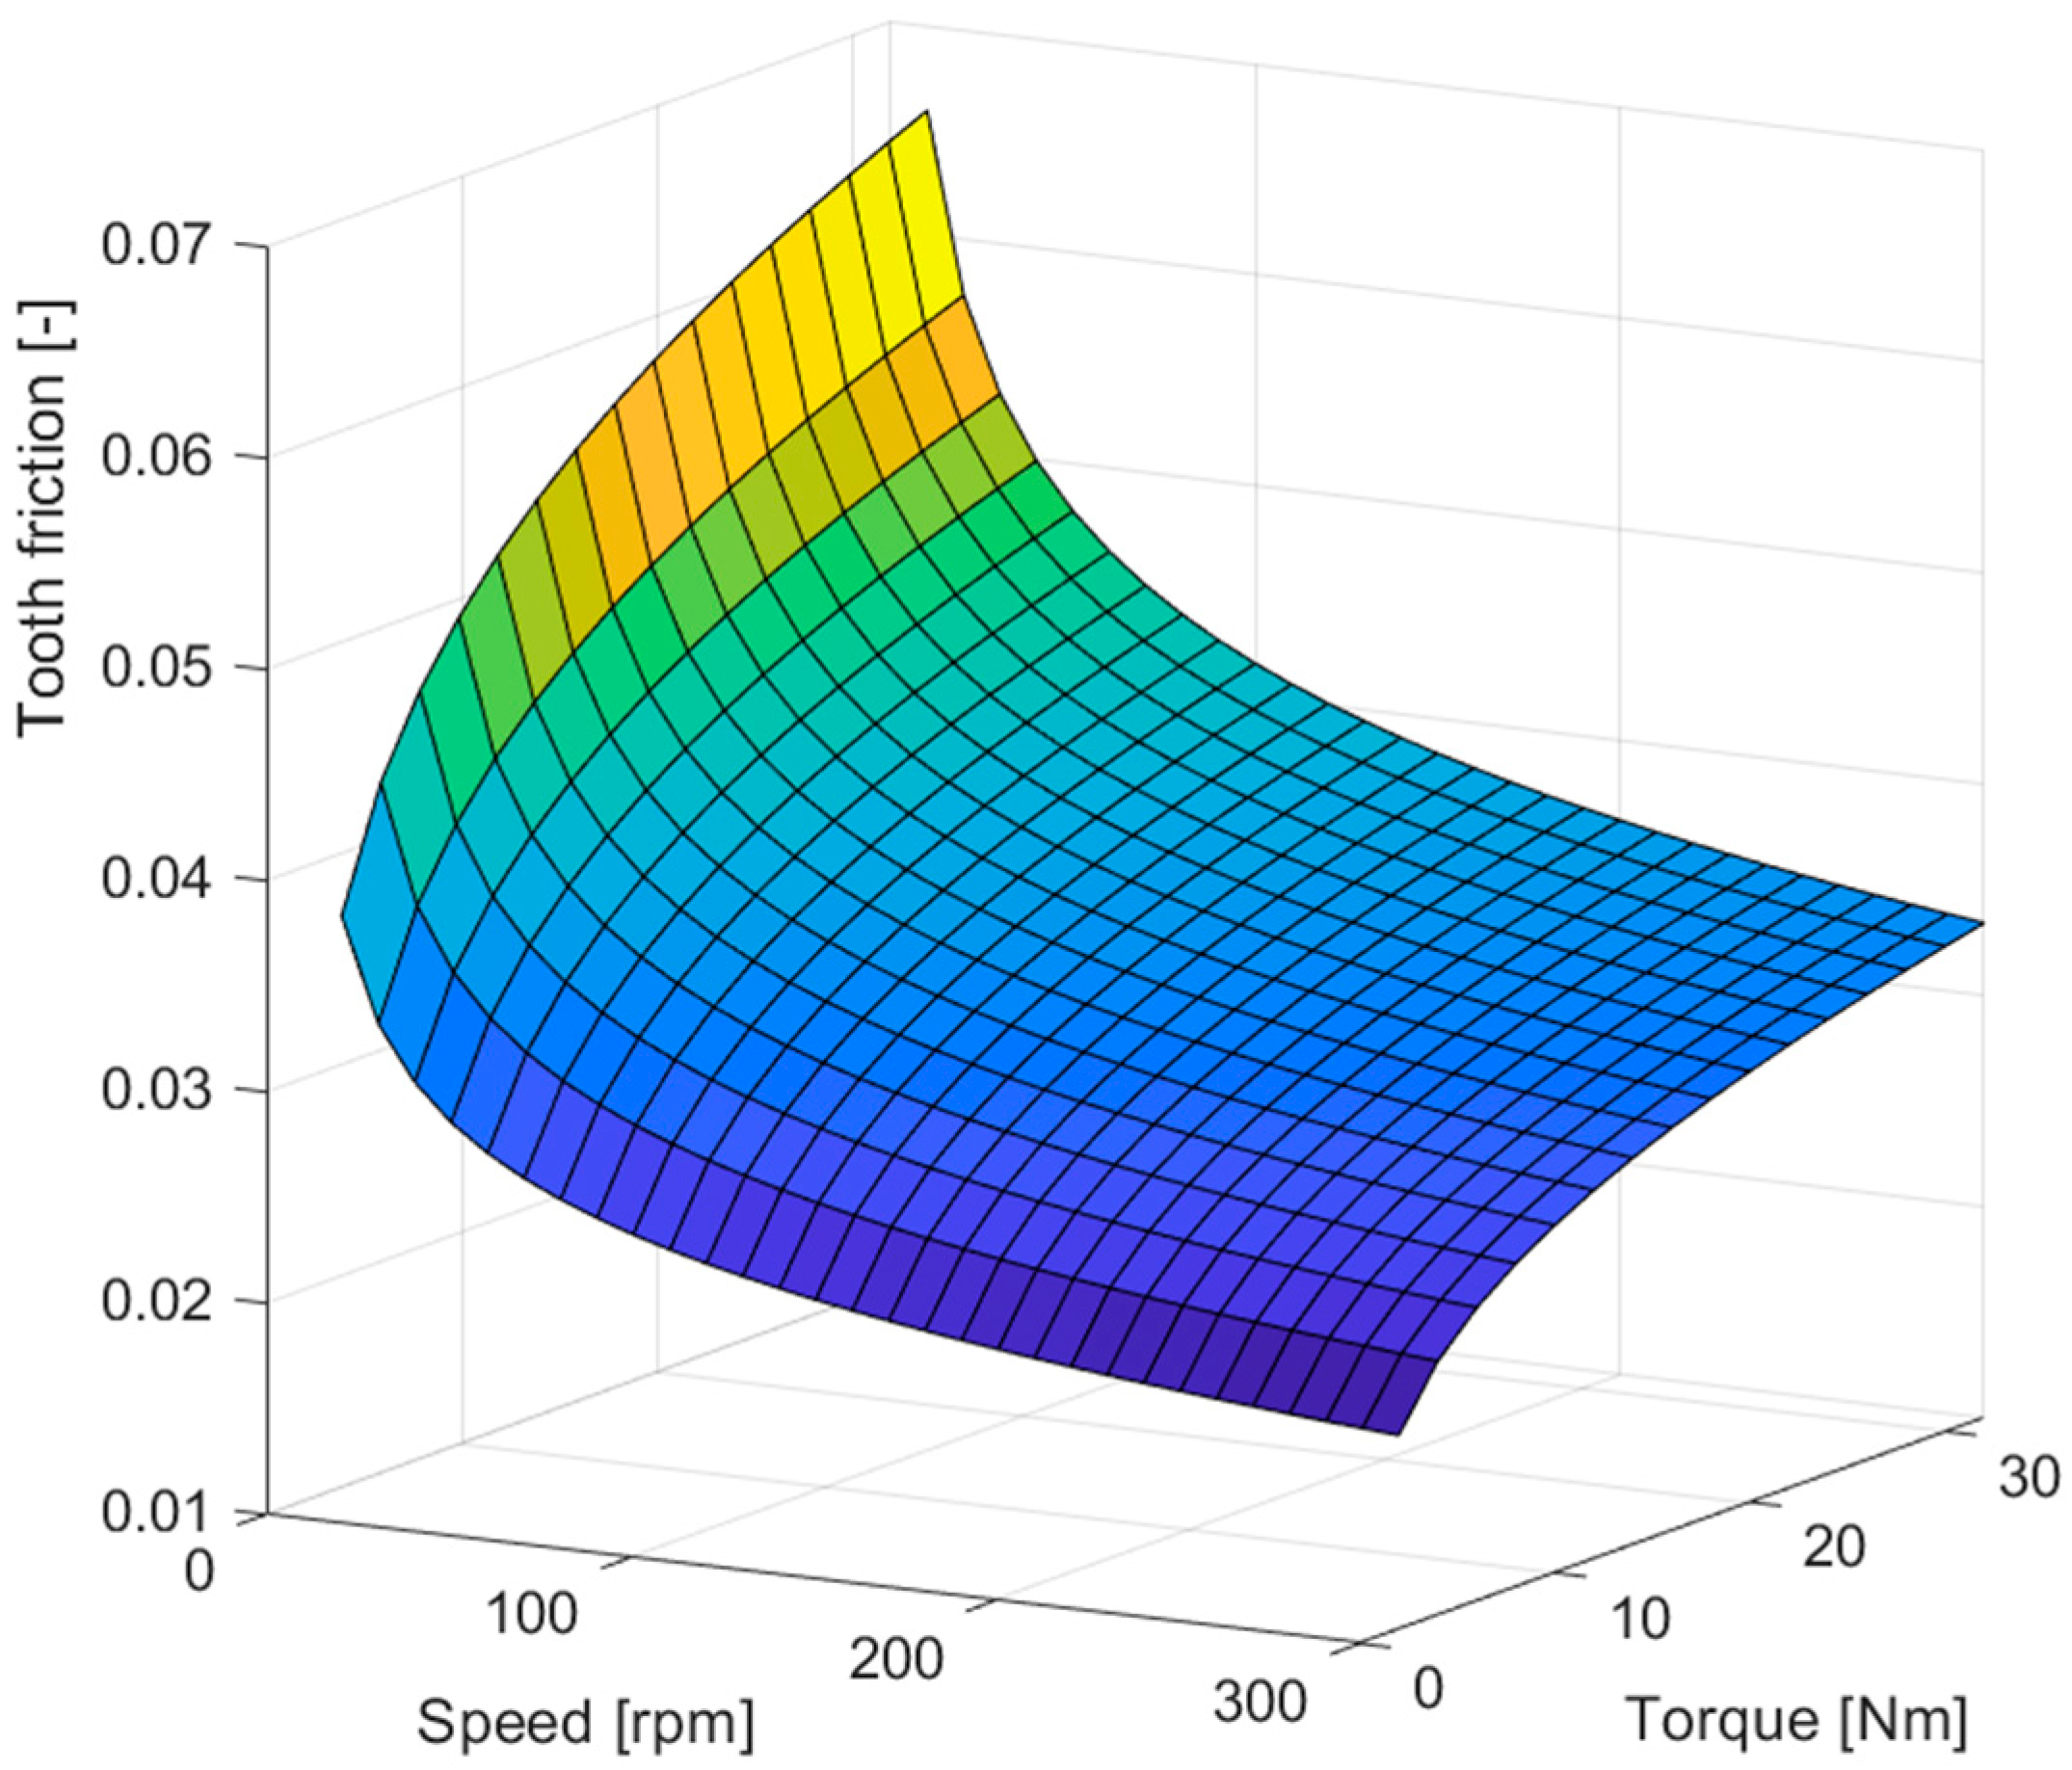
2.4. Tooth Friction Change Analysis

In the creation of mathematical models, compared to conventional gear unit models, some loss sources are omitted, partly because they are left out of the system due to the design and partly because the loss source is coupled to other units of the vehicle, so the mathematical model of the gear unit omits the oil friction, seal friction and bearing friction loss models, since the engine does not have its own enclosed housing, bearing and sealing system [9].
The nature of the tooth friction variation (Figure 2) and the minimum and maximum values of tooth friction (Table 1) of the single-stage gearbox with external gears were also determined during the run.
  • Gear unit parameters: p = [6 4 200 20 0.349 0];
  • Test range: nw = 10…300 rpm; Mw = 2…32 Nm;
  • Viscosity of the selected lubricating grease base oil: ν = 220 mm2/s.

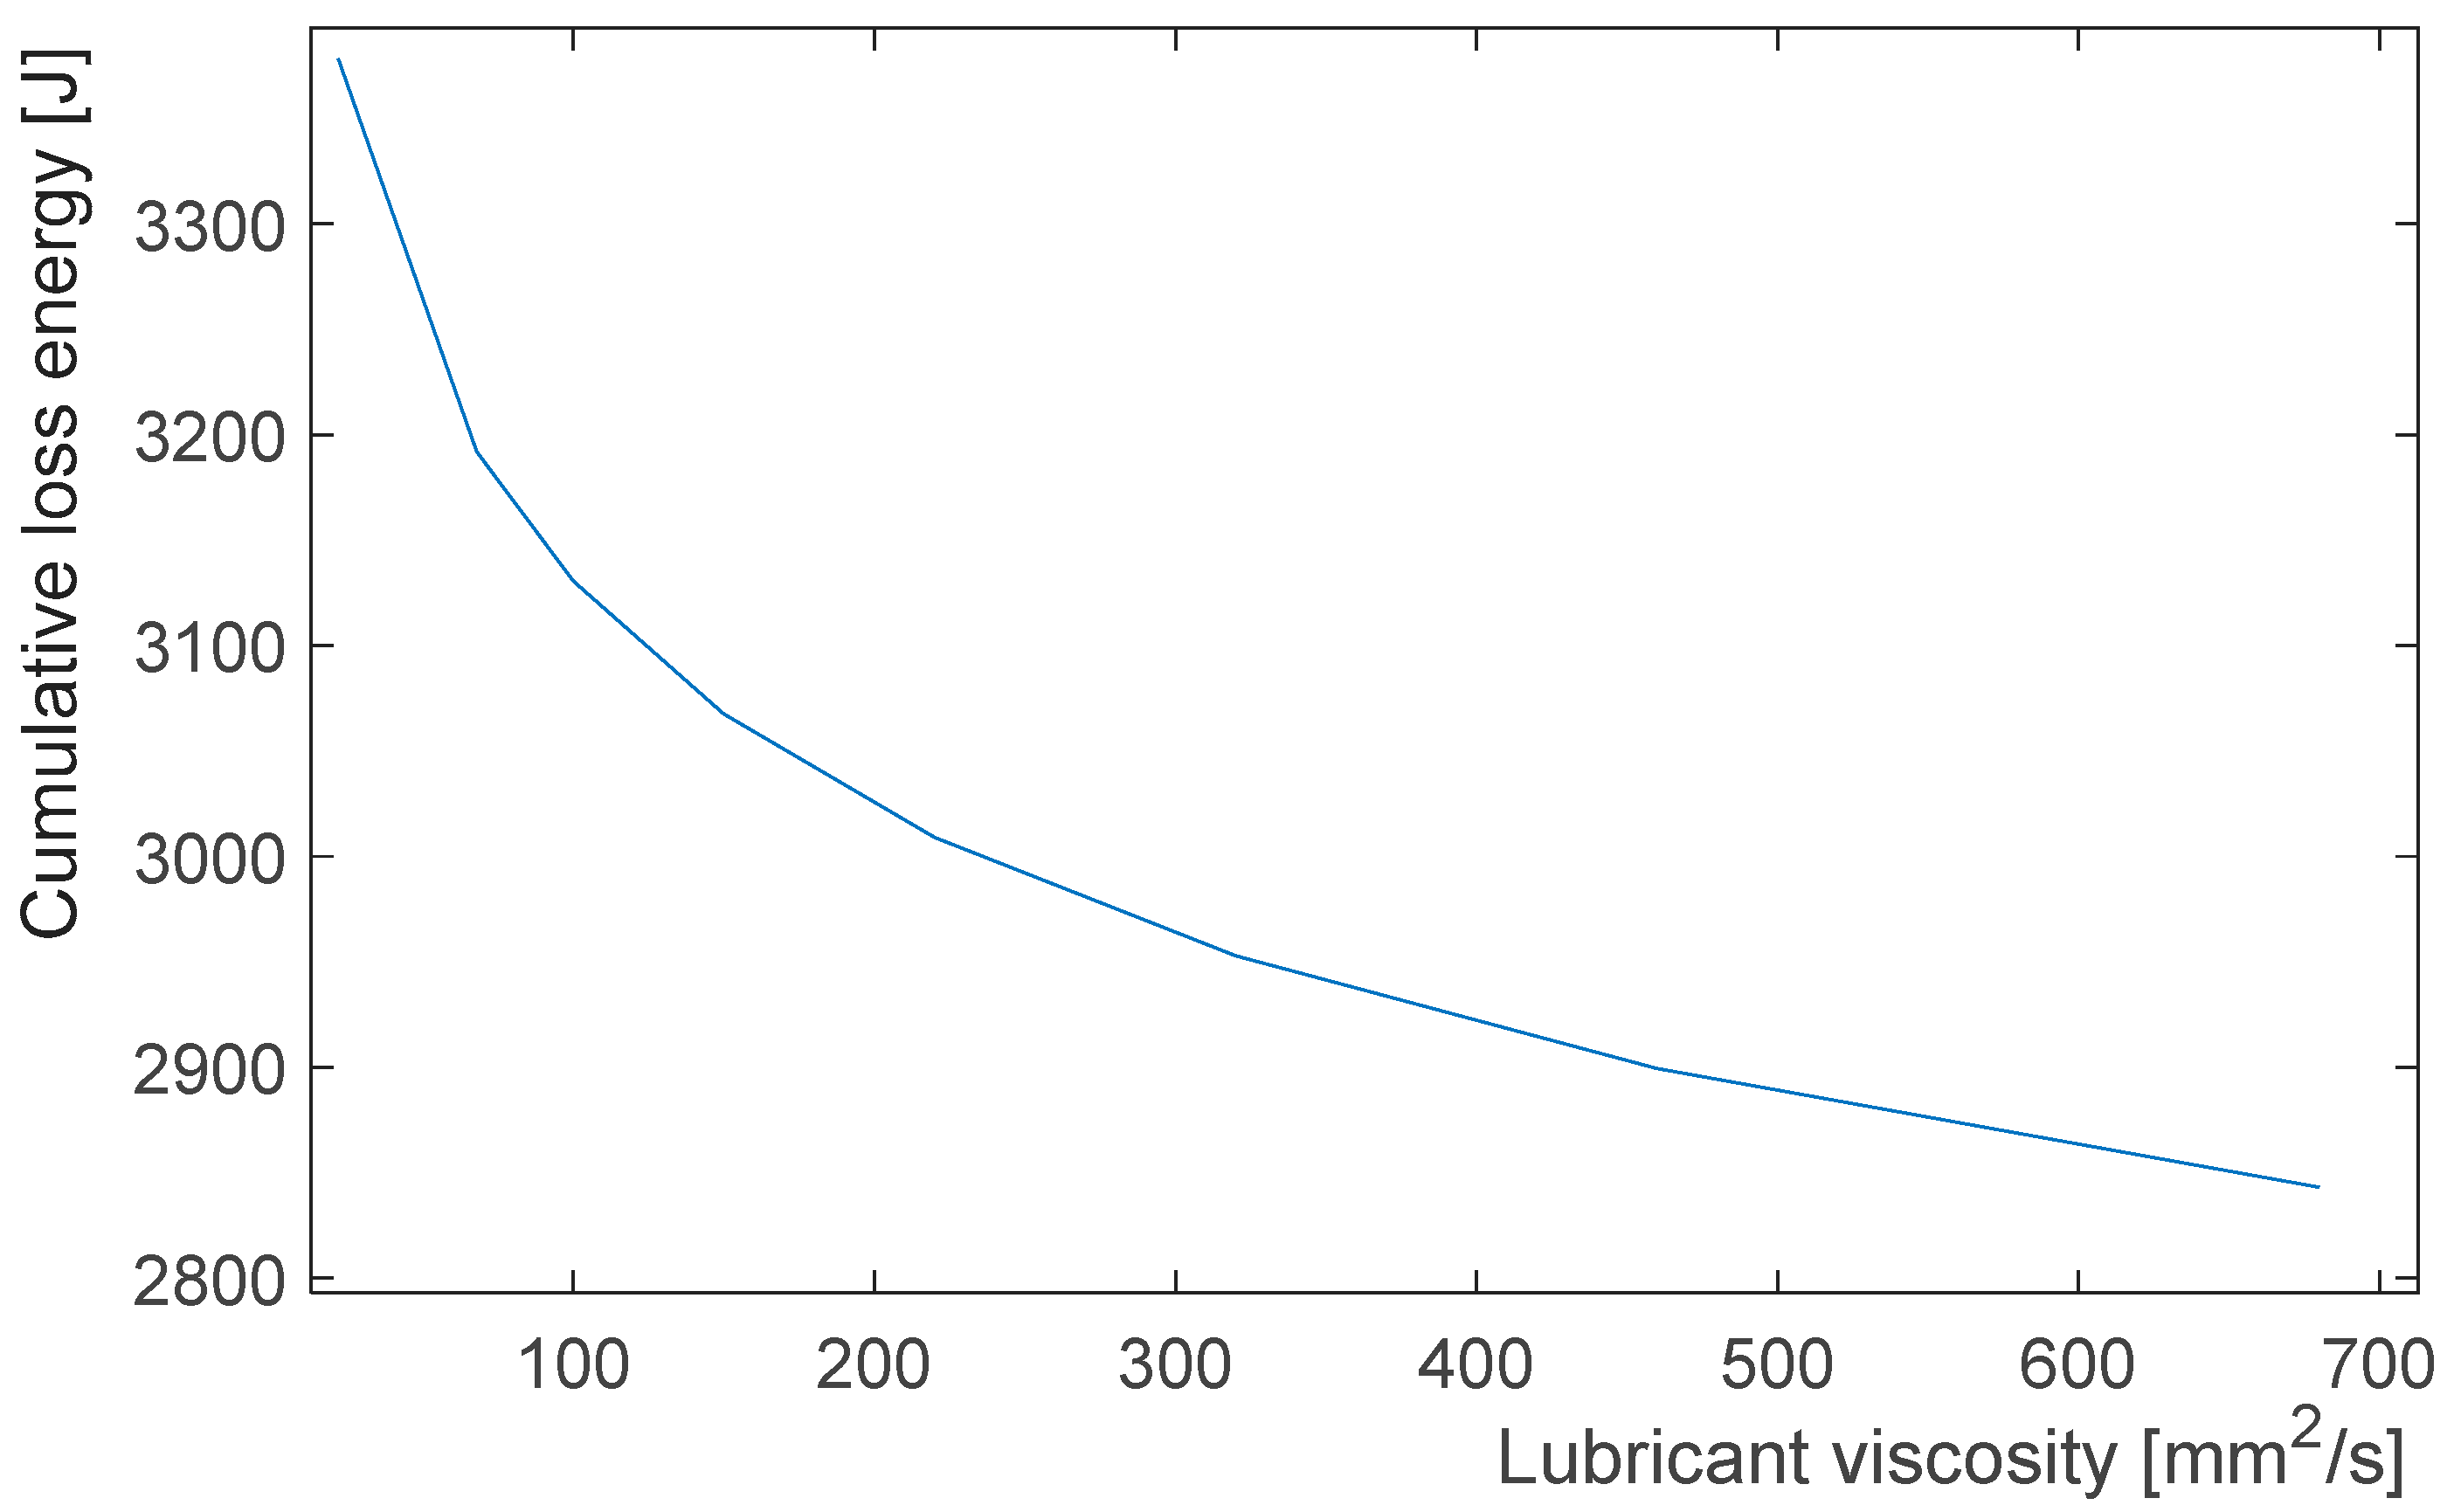
2.5. Relationship Between Lubricant Viscosity and Cumulative Loss Energy

To carry out the sensitivity test, the working points (Mw, nw), the dwell time (t) and the vector of the gear unit parameter (p) were defined, and these values are given in Table 2.
The results of the study are shown in Table 3 and Figure 3.
From the analysis, it can be concluded that a unit of change in the viscosity level resulted in an average cumulative energy loss change of ~2% (~66.9 J), but since the change is non-linear, this interpretation is uncertain.
When the full viscosity range is considered, the change is ~15.84% (~535.2 J). By analysing Figure 3, it can be concluded that the effect of a viscosity change on the energetic behaviour of the engine is significant and therefore relevant for optimisation.

3. Testing and Inspection of Gear Teeth Under Competition Conditions

This is important, because gear unit damage during a race can significantly reduce the vehicle’s ability to compete and its energy efficiency.
There are two ways to check the tooth structure in a competitive environment: the first is visual inspection, which can be used to screen out more serious defects, and the second is a tooth gap check, which can be performed on several tooth contacts to quickly determine the condition of the gears.
After competitions, the gears can be taken out of the gear unit and precision measurement and testing can be carried out in a laboratory environment using standard measuring procedures and measuring instruments. The results obtained can be combined with the experience gained in the competitions to determine the direction of the gearbox development.

4. Conclusions

Earlier, a mathematical model of the gear unit was created, which allows for the energetic analysis of a vehicle gear unit over its entire operating range. The shortcoming of this model is that the value of the tooth friction was determined during precalculation and then entered into the model as a constant parameter, thus not taking into account that in reality, the tooth friction varies with the change in tooth geometry and working points.
Tooth curl is also significantly influenced by the viscosity of the lubricant selected, which varies partly as a result of temperature and partly as a result of load. The studies presented in this paper have shown the viscosity of the oil required by the gear unit at different operating points for proper operation and how this affects the tooth friction and, hence, the gearbox energy loss.
The studies showed that the effect of oil viscosity is tangible, so the determination of the tooth curl and oil viscosity is incorporated into the gear unit model using a MATLAB (R2021b) function, so that it is re-determined at each operating point and for each geometry change. With this modification, the estimation of energy loss generated by the mathematical model describing the energy behaviour of the gear unit has been made more accurate, helping designers define near-optimal engine parameters already in the pre-design phase.

Funding

The research was supported by the European Union within the framework of the National Laboratory for Autonomous Systems (RRF-2.3.1-21-2022-00002).

Institutional Review Board Statement

Not applicable.

Informed Consent Statement

Not applicable.

Data Availability Statement

The raw data supporting the conclusions of this article will be made available by the authors on request.

Conflicts of Interest

The authors declare no conflicts of interest.

References

  1. Concli, F. Thermal and efficiency characterization of a low-backlash planetary gearbox: An integrated numerical-analytical prediction model and its experimental validation. Proc. Inst. Mech. Eng. Part J J. Eng. Tribol. 2016, 230, 996–1005. [Google Scholar] [CrossRef]
  2. Lakatos, I.; Titrik, Á. Determination of Power and Torque Curves of Vehicles Based on Diagnostic Methods. In Proceedings of the 12th International Conference on Heat Engines and Environmental Protection, Budapest, Hungary, 27–29 May 2015. [Google Scholar]
  3. Németh, A.; Fischer, S. Investigation of the glued insulated rail joints applied to CWR tracks. Facta Univ. Ser. Mech. Eng. 2021, 19, 681–704. [Google Scholar] [CrossRef]
  4. Szalai, S.; Kocsis Szürke, S.; Harangozó, D.; Fischer, S. Investigation of deformations of a lithium-polymer cell using the Digital Image Correlation Method (DICM). Rep. Mech. Eng. 2022, 3, 116–134. [Google Scholar] [CrossRef]
  5. Horváth, E.; Kőrös, P. Systematic approach to software related tasks in electric fuel-efficiency vehicle development. In Proceedings of the IEEE 19th International Conference on Intelligent Engineering Systems (INES 2015), Bratislava, Slovakia, 3–5 September 2015. [Google Scholar]
  6. Istenes, G.; Pusztai, Z.; Kőrös, P.; Horváth, Z.; Friedler, F. Kriging-assisted multi-objective optimization framework for electric motors using predetermined driving strategy. Energies 2023, 16, 4713. [Google Scholar] [CrossRef]
  7. Polák, J.; Lakatos, I. Efficiency optimization of electric permanent magnet motor driven vehicle. Mach. Des. 2015, 7, 11–14. [Google Scholar]
  8. Polák, J.; Lakatos, I. Examination of drive line mathematical model. Mach. Des. 2016, 8, 33–36. [Google Scholar]
  9. Guzzella, L.; Sciarretta, A. Vehicle Propulsion Systems, 1st ed.; Springer: Berlin/Heidelberg, Germany, 2005; pp. 57–119. [Google Scholar]
Figure 1. An illustration of the (a) physical design of a single-speed gearbox with external plastic gears and an illustration of the (b) physical design of a single-speed gearbox with external–internal plastic gears.
Engproc 79 00085 g001
Figure 2. Characteristics of tooth friction variation in a single-stage gearbox with external plastic gears (p = [6 4 200 20 0.349 0]. Test range: nw = 10…300 1/min; Mw = 2…32 Nm; lubricating oil viscosity ν = 220 mm2/s).
Engproc 79 00085 g002
Figure 3. Relationship between cumulative loss energy change and lubricant viscosity.
Engproc 79 00085 g003
Table 1. Minimum and maximum value of tooth friction.
Torque [Nm]Speed [rpm]Tooth Friction [−]
32100.06595
23000.01918
Table 2. Setting parameters to perform the sensitivity test.
Working Points123
Mw [Nm]01432
nw [rpm]285285285
t [s]755755216
Engine parameter vector:p = [6, 4, 200, 20, 0.349 0]
Table 3. Sensitivity of the gearbox model to changes in lubricating oil viscosity.
Standard Viscosity Levels [mm2/s] Cumulative Energy Loss [J]
223378.58
683192.21
1003130.91
1503067.75
2203009.26
3202953.13
4602899.77
6802843.39
Disclaimer/Publisher’s Note: The statements, opinions and data contained in all publications are solely those of the individual author(s) and contributor(s) and not of MDPI and/or the editor(s). MDPI and/or the editor(s) disclaim responsibility for any injury to people or property resulting from any ideas, methods, instructions or products referred to in the content.

