Abstract
Part 1 of this paper summarizes the application of the IPG CarMaker 11.0 software for lap-time simulation and optimization. The goal is to use the IPG CarMaker on a given track for the optimization of the aerodynamics package parameters and the drag reduction system (DRS). The optimal aerodynamic downforce coefficient is determined for a given vehicle. The simulations clearly suggest that the application of the DRS pays off for a Formula Student car, if the DRS activation and deactivation times are chosen carefully. As IPG CarMaker seems to be a powerful tool, the Arrabona Racing Team decided to extend its application.
1. Introduction
The Arrabona Racing Team (ART), which was established in 2014 at the Széchenyi István University of Győr, is continuously developing new Formula Student (FS) car models every year complying with the rules [1] of the FS competition. This paper and its first part [2] focus on the virtual modeling and design optimization of the ART_X model, which is the recent model by the ART. Figure 1 shows the top view of an ART model.
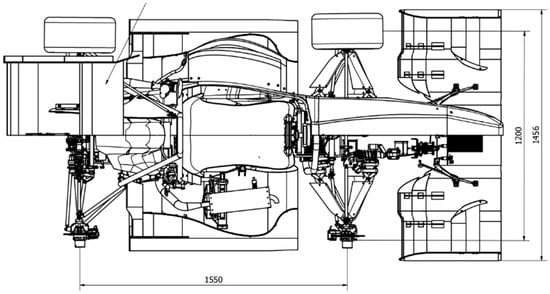
Figure 1.
Top view of a formula racing car with the aerodynamic package (the ART’s own property).
In motorsport, each team has the same amount of time generally to design and test their prototype vehicles. It is critical to be able to analyze the performance virtually, and not by physical prototype, as that would be time- and resource-consuming. If the results are not as expected, enhancing the virtual prototype is a much faster and more effective process. This tendency has become valid not only in the fiercely competitive passenger vehicle industry, but also in motorsport.
Aerodynamics is crucial for road vehicles, especially race cars. Safety and agility can be guaranteed by high traction forces between the road and the tires. Traction is basically ensured by the friction force, which can be increased in general by increasing the normal force in the road–tire contact point. Therefore, the main goal of the aerodynamic package of race cars is to increase the downforce, which is basically a negative lift force. The challenge is that increased lift force generally goes hand-in-hand with increased drag force, which consumes the engine power. Depending on the vehicle, the racetrack, the weather and the asphalt conditions, the optimal balance of lift and drag coefficient must be found to minimize the lap time [3,4,5,6]. The lift and the drag forces Flift and Fdrag appear in the dynamic equations of the vehicle as m ax = Fdrive − Fdrag and m ay = − m g + Flift; Flift < 0, where m is the total mass of the vehicle and a is its center of gravity acceleration. A new opportunity to avoid this serious tradeoff is to use the so-called drag reduction system (DRS). The fundamental idea is to reduce the aerodynamic drag coefficient at high speed in almost straight segments of the racetrack and increase the aerodynamic lift coefficient together with the drag force only on the slow segments of the track, where small radius cornering induces high lateral accelerations [7,8,9,10].
Besides a complete picture on race vehicle aerodynamic effects, the concept of multiple airfoil (or multi-element) wings is explained in [6]. This idea is indispensable for the technical realization of such a concept of the DRS, where only the angle of a certain wing segment is modified. The numerical model was built, and the optimum opening angles were found using 3D computational fluid dynamics (CFD) simulations in [7]. Reference [8] focuses on DRS configuration optimization from an existent design of an FS car rear wing using 2D and 3D CFD simulations. The considered rear wing is a multi-element wing with three airfoils that produces a considerable fraction of the car’s total aerodynamic downforce. The optimal angles are investigated in different vehicle speeds. The drag and lift coefficient were analyzed in detail by means of 2D and 3D CFD simulations in [9]. After collecting information on the 2D wing profile, a 3D model was created together with the electrical linear actuators and the end plates to evaluate the wing operation. The presence of the linear actuators somewhat spoiled the aerodynamic performance: the drag increased, and the lift force decreased. The DRS activation led to significant decrease in both the drag and lift coefficient. The overall lap time was not analyzed in papers [6,7,8,9].
Related to the ART development process carried out in the Széchenyi István University at Hungary, thesis [10] details the technical realization of the DRS of the ART_11 FS car by improving the ART_X model. CFD simulations were used to estimate the expectable aerodynamic forces. A mechanism that actuates the DRS was also designed in [10]. The DRS actuation strategy, however, was not tackled in [10]. The results of the present work preceded [10], and the goal was to gain preliminary information on the achievable benefits and the collateral drawbacks of the DRS. The additional weight and aerodynamic obstacles caused by the DRS actuation mechanism and the drag force reduction oppose each other. Before the detailed technical design in [10], it was necessary to estimate the possible gain due to the DRS in terms of simulated lap times. This was achieved using the vehicle multibody simulation software called IPG CarMaker [11].
2. Methodology
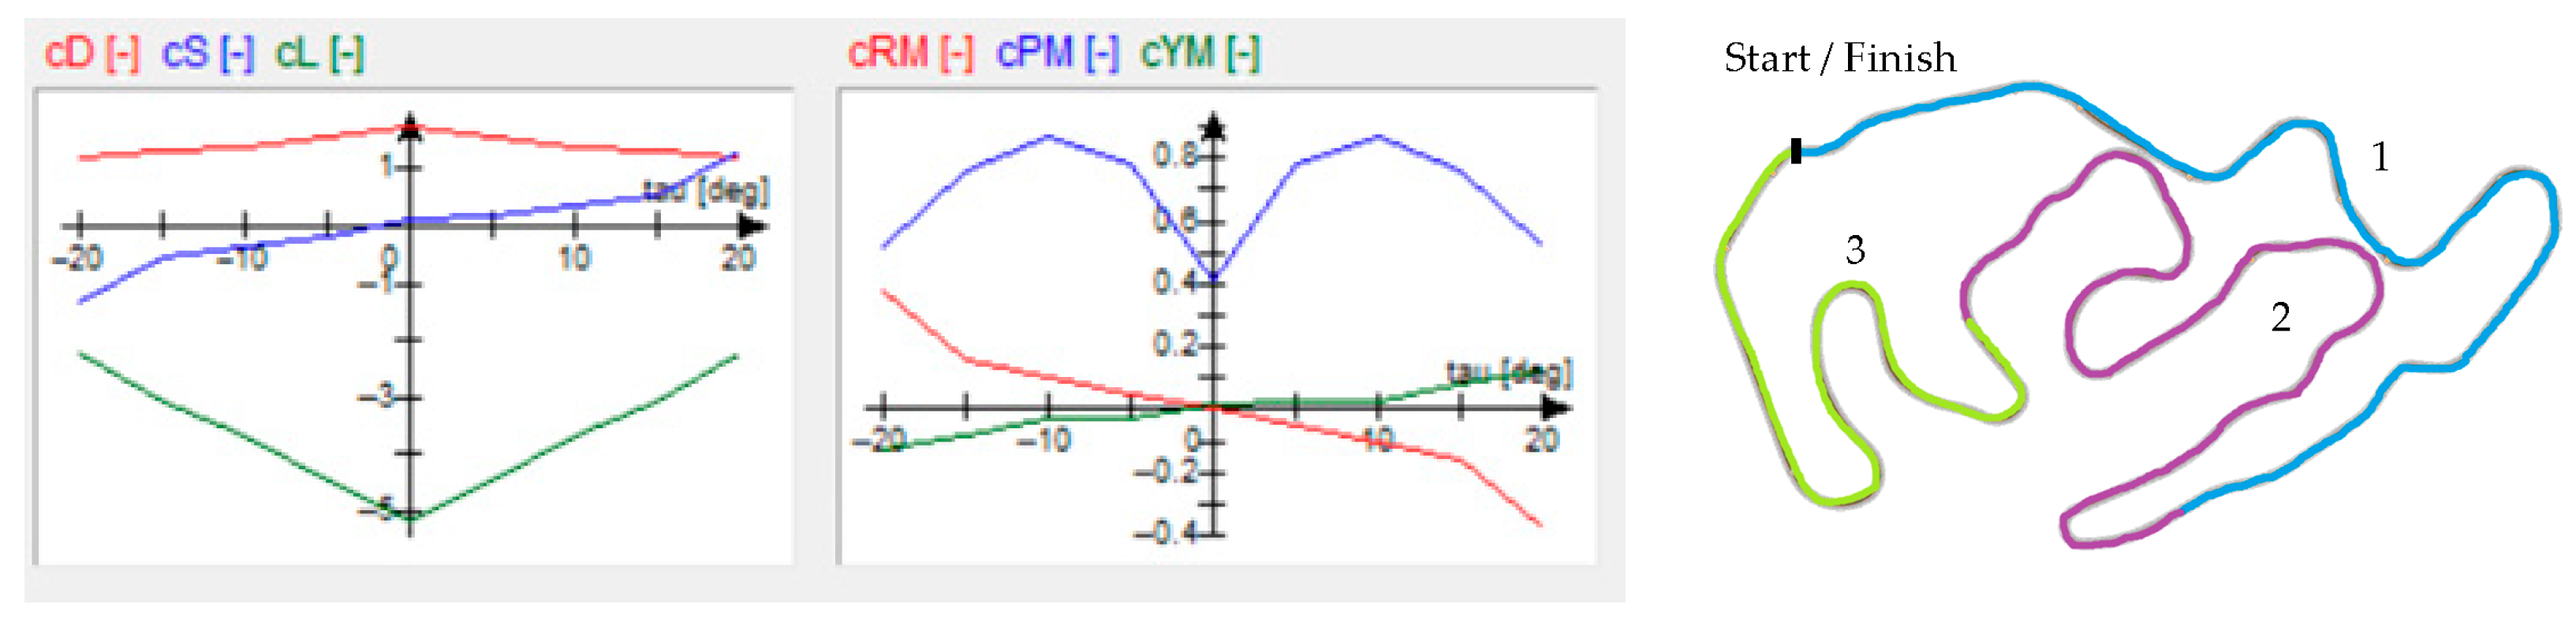
Since the aim was to analyze the effects of the aerodynamic parameters on the simulated lap time in IPG CarMaker, at first, several 3D steady CFD simulations were carried out. The main outcomes of the CFD simulations were the aerodynamic drag and lift coefficients in different crosswind directions for the ART_X for DRS on and off; see Table 1. There was almost 25% of drag reduction when the DRS was open. These data were input in the IPG CarMaker in the form of an aerodynamic map as illustrated in Figure 2’s left and middle panels. Parameters cD, cS and cL are, respectively, the dimensionless drag coefficient, the side force coefficient and the lift coefficient. Not only the x, y and z force components but the three torque components are considered in the model. Hence, variables cRM, cPM and cYM are, respectively, responsible for the roll, pitch and yaw torque components. Some further data such as the center of pressure (CoP) position and reference area are also required for the simulation.

Table 1.
Aerodynamic drag coefficient values for DRS off and on conditions.

Figure 2.
Illustration of the aerodynamic map of the ART_X in IPG CarMaker on the two graphs on the left; the test track with sectors 1, 2 and 3 with different colors on the right (the ART’s own property).
The IPG CarMaker was connected to a Matlab script that controlled the switching of the DRS. The DRS switches were decided manually prior to the simulation, based on the curvature of the track shown on the right panel of Figure 2. A MATLAB Simulink add-in was used for this purpose. The basic principle was the following: using this pre-defined MATLAB Simulink add-in, the IPG CarMaker can be integrated into it, while many parameters can be controlled in the simulation. The DRS is also a parameter which is controllable by the Simulink module: it can be opened or closed based on the track position, by changing the drag property value which describes the vehicle.
The higher speed the vehicle goes at, the larger the downforce that can be generated. On the Formula Student Germany track shown in Figure 2, three sectors are created by us, to check in which section does the aero package yield the most significant difference in time. Sector 1 is dominated by straight sections and high-/middle-speed corners, considering the typical speeds of an FS track. Sector 2 is a trickier one, with mostly hairpins or slow speed corners. Sector 3 is a mix, with properties from both previously mentioned sectors. There are hairpins present but with a much bigger radius, resulting in mainly mid-speed corners. As a simplification, the lift and side force coefficients are not distinguished for DRS on and off cases. Although, in principle, the downforce would be reduced with DRS on, the vehicle goes straight anyway on those track segments where the DRS is on, and in those conditions, the downforce does not play significant role. In a close-to-straight road, there is no need for too much lateral traction. The extra mass due to DRS is included in the model.
The driver adaptation process is explained in the first part of this paper. We have proven that the driver model converges in less than 15 laps. Therefore, the 15th lap is always considered as the best lap time on a given track. In the optimization process, this best lap time is compared for different downforce (negative lift force) values and for different DRS settings.
3. Results
3.1. CFD Simulations
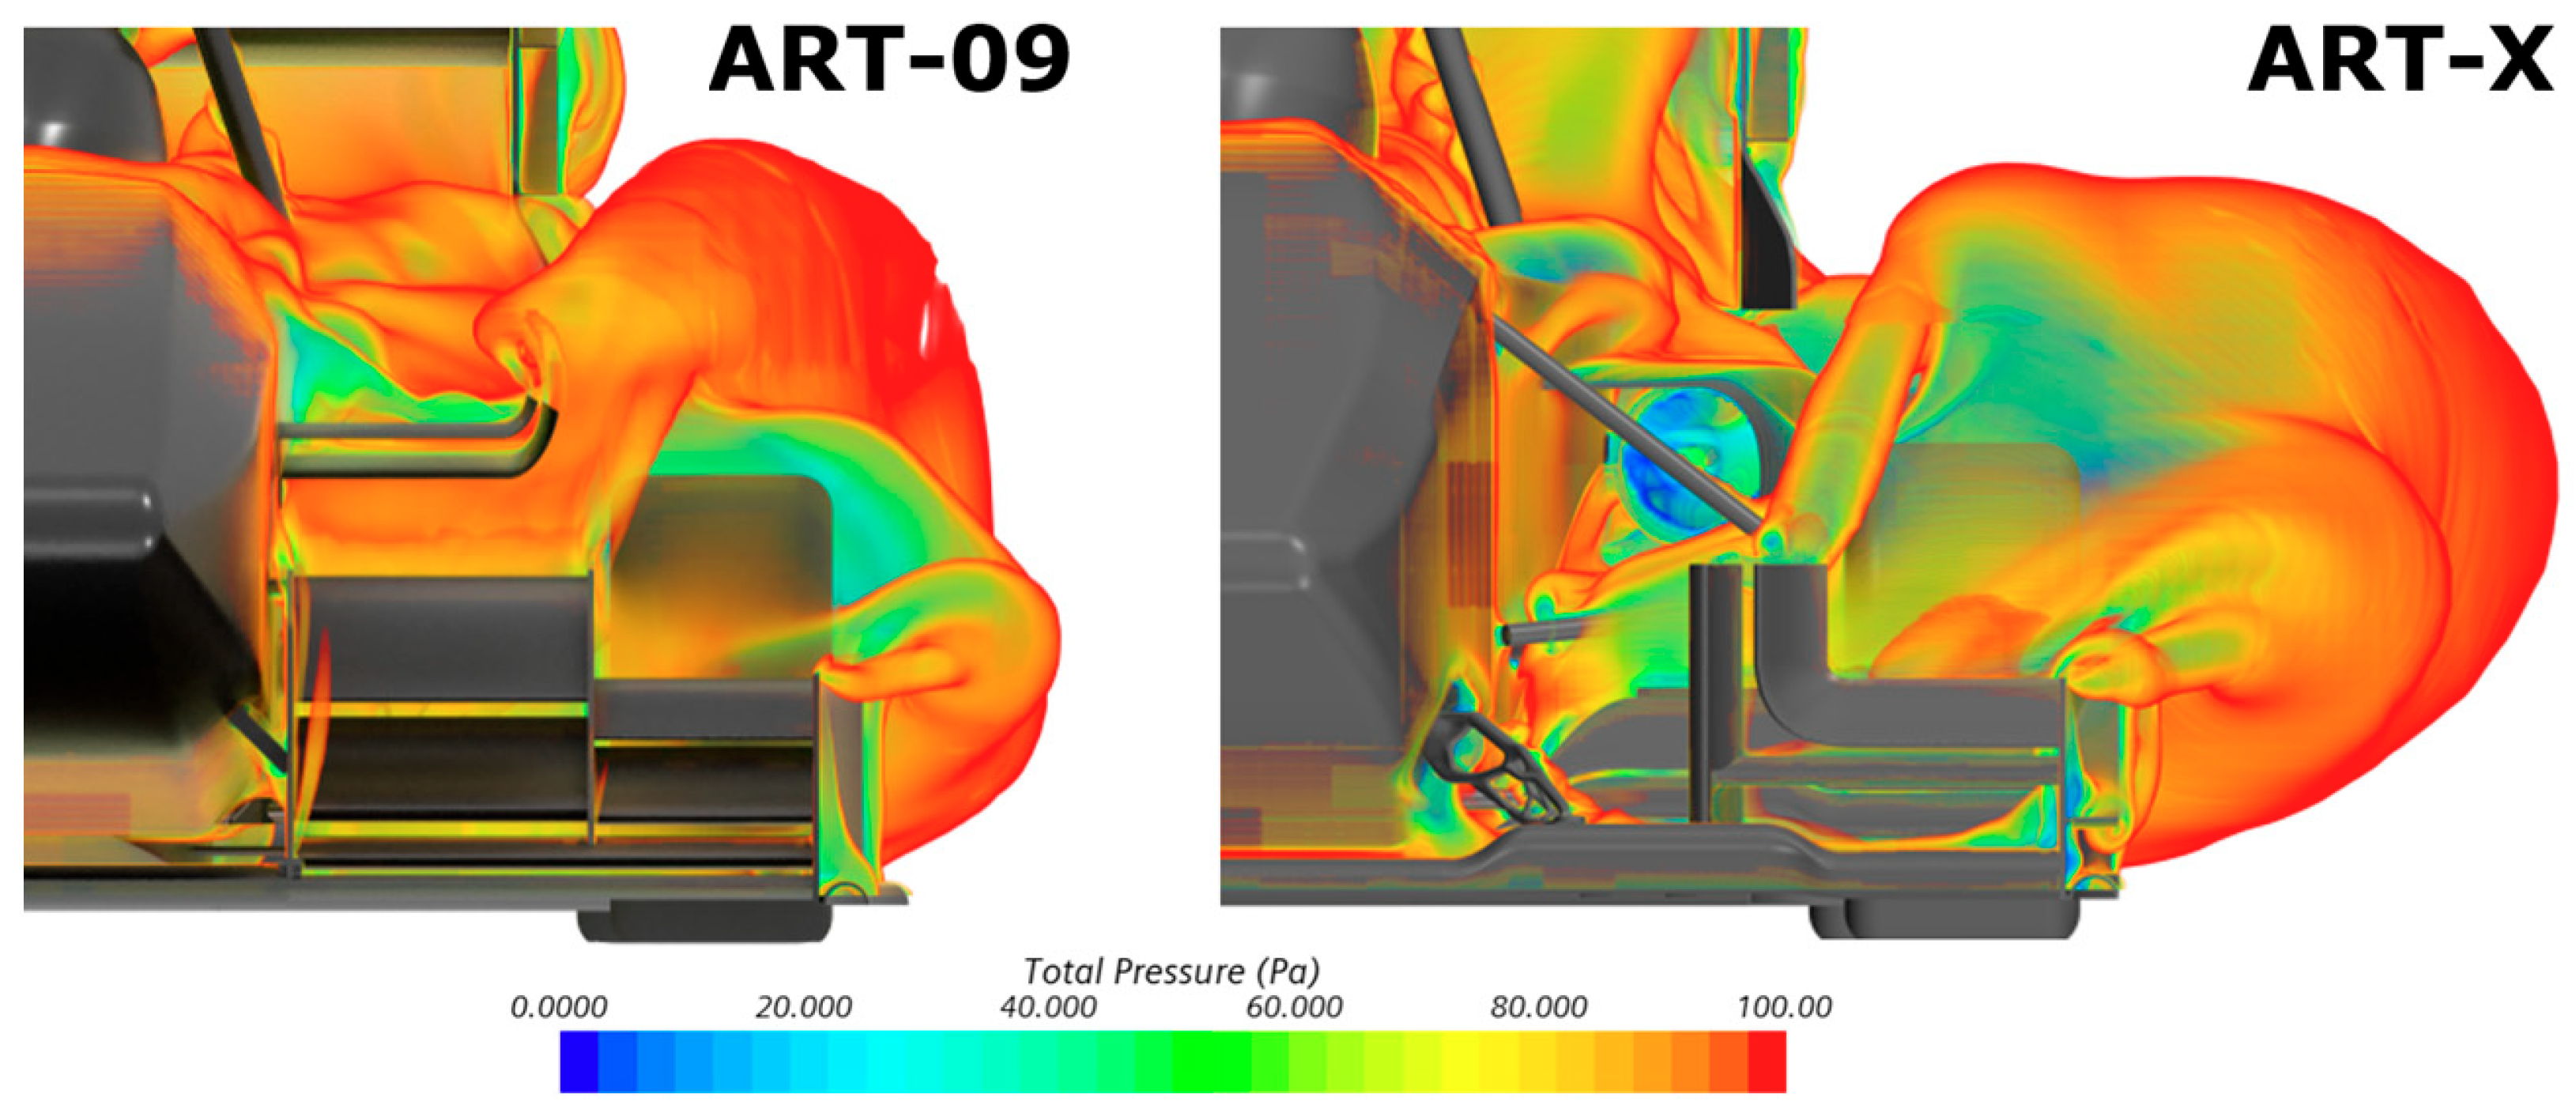
The aerodynamics and the efficiency of the aerodynamics package is enhanced further every year, as Figure 3 shows the difference in the flow around two prototypes: the ART_X is not only an upgraded car, but it was designed on whole new bases compared to the ART_09. Such CFD simulations were carried out, based on which the aerodynamic map was created as Section 2 explains.

Figure 3.
CFD simulation comparison between ART_09 and ART_X (the ART’s own property).
3.2. Sensitivity to Drag and Lift Coefficients
After the parameters for the ART_X’s aerodynamic package were generated via CFD simulations, the effect of the change in the drag and lift coefficients was examined based on the scenarios summarized in Table 2. A complete lap was assessed in the IPG CarMaker with a variety of lift force and drag force modifications. The comparison of the base model and case 1 from Table 2 is detailed in Table 3. Case 1 (+15% lift force) was chosen, because the gain in the lap time was the largest here. The sector times and their difference from the base model are detailed in Table 3. The results show that the largest gain is in sector 1, but sectors 2 and 3 are faster too when the downforce is increased. Note that the drag is identical with the base model, which is possible only in simulation.
Table 2.
Summary of lap-time simulations regarding aerodynamic downforce and drag.
Table 3.
Comparison of sector times for scenario 1.
3.3. Lap-Time Sensitivity to DRS
On the ART_X vehicle, a ‘plug-and-play’ DRS was developed. This means that the whole system could be assembled on the vehicle in a short amount of time if it is needed, but without it, the car is still able to run. The actuating device is a pneumatic cylinder, which is lightweight yet powerful enough to actuate the airfoil. Also, there is no need for an extra auxiliary device (e.g., oil tank or extra valves) for this pneumatic system, as because of the electro-pneumatic shifting system, the vehicle already carries a pneumatic air tank, which could be used for this purpose as well. A separate control module is also unnecessary for this system, as the driver would mainly control it, and it could be integrated into the existing electronic systems. This means that with a low amount of mass increase, we would be able to decrease the drag of the ART_X vehicle in the straights. The only problem is that on a typical FS racetrack, there are a short number of straights, and the length of them is maximized at 75 m. This means that the vehicle does not reach the high velocity where the drag reduction should be critical.
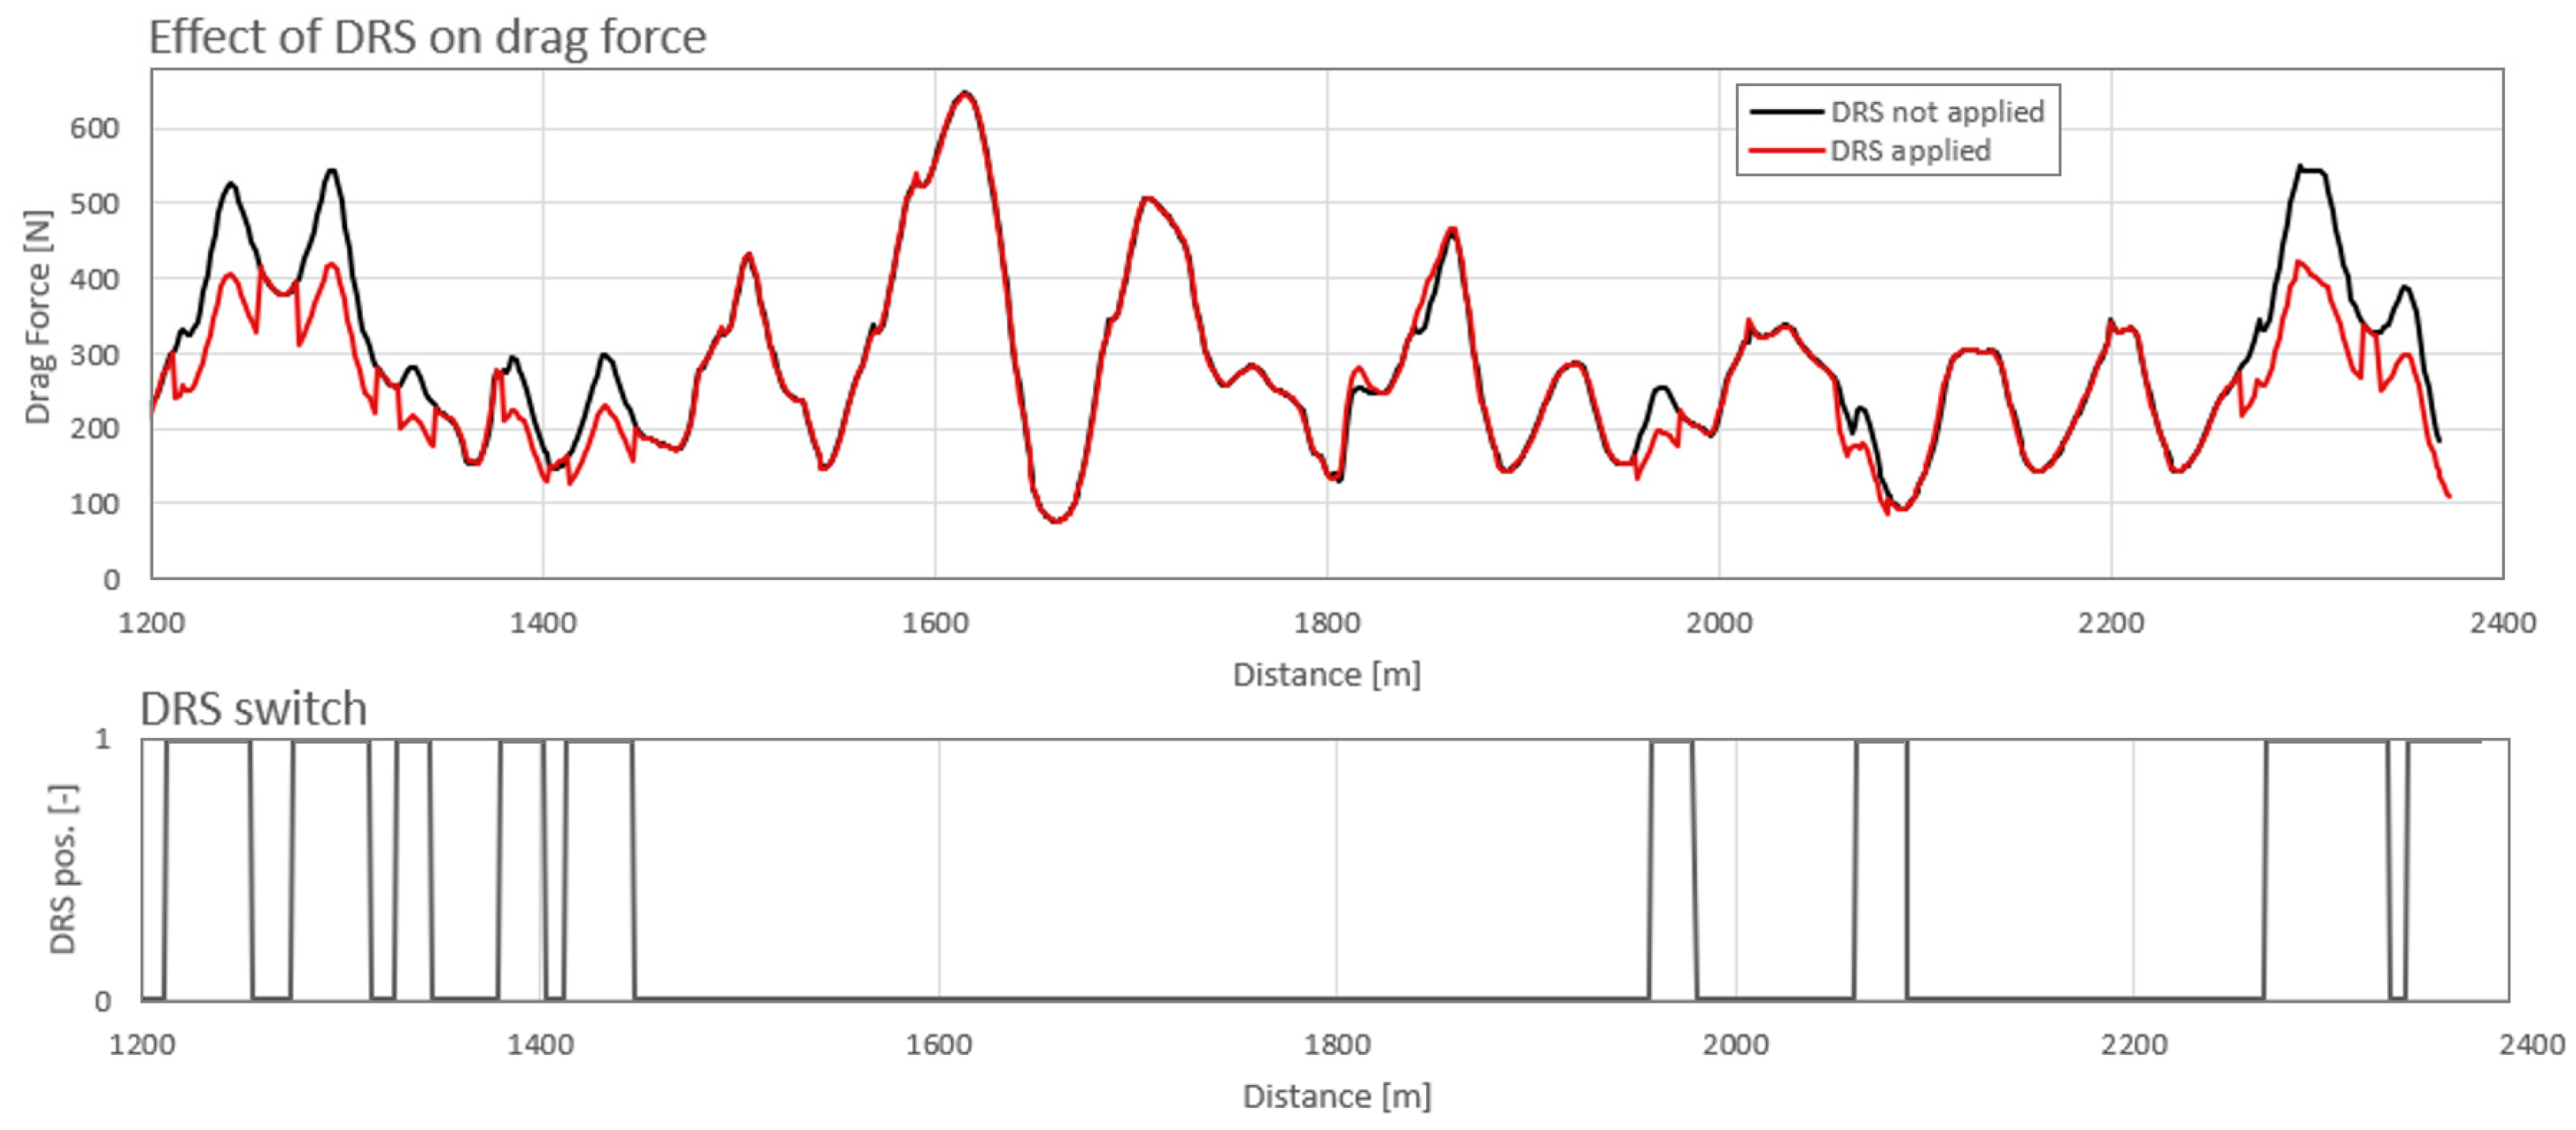
Considering these factors, we tested the DRS in the IPG CarMaker. The top panel of Figure 4 shows the drag force with inactive and active DRS. The curves run together when the DRS is off, and there is a drag difference when the DRS is on. This is consistent with the bottom panel of Figure 4, which shows that 11 short straight sections were defined on the racetrack, where the DRS is opened at the start of the section and closed at the end of the section. These drag differences make the vehicle with the DRS applied about 0.15 s/lap faster in average, which seems like a small margin. However, if the endurance race [1] is taken into consideration, an average of 0.15 s difference in a lap could result in 3.3 s difference for the 22 laps competition, which might lead to extra points in the results. Furthermore, the efficiency and therefore fuel consumption of the vehicle could be better because of the reduced drag in the straights, which is also an important factor.
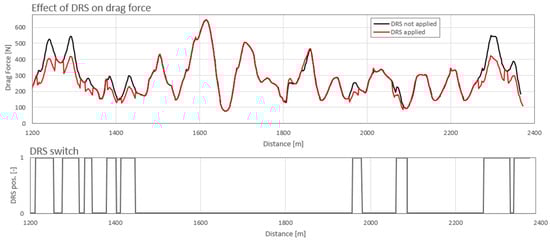
Figure 4.
CFD simulation comparison between ART_09 and ART_X (the ART’s own property).
4. Discussion and Conclusions
First, the sensitivity of the lap time to the lift and drag force was assessed in IPG CarMaker on the test track divided into three sectors: a fast, a slow and a middle-speed one. The increase in downforce mostly helped in sectors where mid- and high-speed corners were dominant. The most time was gained in the first sector (0.5 s difference) meaning that the increase in the aerodynamic efficiency of the vehicle could be used the most in this speed range with this kind of track layout. To be fair, an aero upgrade with 15% downforce increase could only be possible with a slight drag increase in the vehicle, which would result in some time loss in the higher speed regions. Nevertheless, the overall vehicle aerodynamic performance and the lap times are expected to be better.
The above explained contradiction of the increased drag which is inseparable from increased lift force can be resolved by changing the aerodynamic parameters of the car depending on the actual maneuvers. The DRS has been introduced in the motorsport to provide a technical solution for varying the aerodynamics in time. To check the efficiency of the DRS on our certain ART_X model, the lap time was simulated in IPG CarMaker without and with DRS. When DRS was activated, the switching between the open and closed state of the actuated wing segment was predetermined based on driver experience. The active DRS reduced the lap time significantly. This finding correlates to the expectations from studies [7,8,9,10], where the fluid dynamics of the DRS was investigated in detail, but complete lap-time simulation was not carried out. The 0.15 s lap-time reduction on this 1186 m long track drove the ART to the final decision that the DRS should be applied to the next model of the vehicle. The design was finalized in [10]. Of course, many test kilometers are required to fine-tune the system and make the drivers familiar with the actuation of the DRS, but once it is functioning properly, it can make a difference at the races.
As a limitation of this work, one must be aware of the fact that each vehicle behaves differently and each driver can handle a specific vehicle is a slightly different manner; furthermore, each racetrack has its own properties, and the conditions are affected by the weather as well. This is why motorsport is always challenging, and there is no general solution for the optimum vehicle setting. Similarly, the present work does not provide general optimum settings, but it provides a methodology that can be repeated for any new vehicle and situation. Evidently, our future work is related to taking steps towards methods that might help us to find as general optimums as possible.
Author Contributions
D.T. performed the calculations and analysis. A.Z. edited the manuscript. All authors have read and agreed to the published version of the manuscript.
Funding
The publication was created in the framework of the Széchenyi István University’s VHFO/416/2023-EM_SZERZ project entitled “Preparation of digital and self-driving environ-mental infrastructure developments and related research to reduce carbon emissions and environmental impact” (Green Traffic Cloud).
Institutional Review Board Statement
This study did not require ethical approval as it did not involve humans or animals.
Informed Consent Statement
Not applicable, as the study did not involve human participants.
Data Availability Statement
Data supporting the findings of this study are contained within the article.
Acknowledgments
This work has been supported by the Arrabona Racing Team of the Széchenyi István University, located in Győr, Hungary.
Conflicts of Interest
The authors declare no conflicts of interest related to this study.
References
- Formula Student Germany Rulebook for 2024. Available online: https://www.formulastudent.de/fileadmin/user_upload/all/2024/rules/FS-Rules_2024_v1.1.pdf (accessed on 1 July 2024).
- Takács, D.; Ambrus Zelei, A. Performance Optimization of a Formula Student Racing Car Using IPG CarMaker—Part 1: Lap Time Convergence and Sensitivity Analysis. Eng. Proc. 2024, in press.
- Hucho, W.-H. Aerodynamics of Road Vehicles: From Fluid Mechanics to Vehicle Engineering; Butterworth-Heinemann Ltd.: London, UK, 1987; ISBN 0-408-01422-9. [Google Scholar]
- Joseph Katz, J. Race Car Aerodynamics: Designing for Speed; Bentley Publishers: Cambridge, MA, USA, 2003; ISBN 978-0-8376-0142-8. [Google Scholar]
- Gillespie, T.D. Fundamentals of Vehicle Dynamics, Revised ed.; SAE International: Warrendale, PA, USA, 2021; ISBN 978-1-4686-0356-9. [Google Scholar]
- Katz, J. Aerodynamics of race cars. Annu. Rev. Fluid Mech. 2006, 38, 27–63. [Google Scholar] [CrossRef]
- Penner, D.J. Aerodynamic Design and Analysis of a Formula SAE Drag Reduction System (DRS); SAE Tech. Pap. 2020-01-0685; SAE International: Warrendale, PA, USA, 2020. [Google Scholar] [CrossRef]
- Monteiro, C.A.B. Numerical Study of a Drag Reduction System for a Formula Student Car. Master’s Thesis, Nova School of Science & Technology, Lisbon, Portugal, November 2021. [Google Scholar]
- Loução, R.; Duarte, G.O.; Mendes, M.J.G.C. Aerodynamic Study of a Drag Reduction System and Its Actuation System for a Formula Student Competition Car. Fluids 2022, 7, 309. [Google Scholar] [CrossRef]
- Wakpal, S. Aerodynamic Enhancement through the Design and Development of a Drag Reduction System for Formula Student Car. Master’s Thesis, Audi Hungaria Faculty of Vehicle Engineering, Széchenyi István University, Győr, Hungary, June 2024. [Google Scholar]
- IPG Automotive GmbH. Index Page. Available online: https://www.ipg-automotive.com/en/ (accessed on 1 July 2024).

Disclaimer/Publisher’s Note: The statements, opinions and data contained in all publications are solely those of the individual author(s) and contributor(s) and not of MDPI and/or the editor(s). MDPI and/or the editor(s) disclaim responsibility for any injury to people or property resulting from any ideas, methods, instructions or products referred to in the content. |
© 2024 by the authors. Licensee MDPI, Basel, Switzerland. This article is an open access article distributed under the terms and conditions of the Creative Commons Attribution (CC BY) license (https://creativecommons.org/licenses/by/4.0/).