1. Introduction
The challenges of vehicle development tasks are becoming increasingly difficult [
1]. These include electromobility, alternative drives, digitalization, autonomous vehicles, and cybersecurity [
2,
3,
4,
5]. Additionally, changing consumer demands, supply chain disruptions, shortages of raw materials, and stricter environmental regulations also pose challenges. The new functions and specifications must be continuously tested and developed. The testing of complete vehicles is expensive, is time-consuming, and occurs late in the vehicle development process. Therefore, the testing of vehicles is preceded by the validation of subcomponents [
6].
Screening for test errors, verifying the accuracy of the test program in the automation software, and ensuring communication between automation systems are essential to prevent or rectify improper engine operations [
7]. When testing an engine with conventional methodology, the validation and evaluation of the test results are performed after the test is completed. The present method offers the possibility to monitor the test values during the test itself to ensure the engine runs within framework conditions.
The methodology used for validating vehicle simulations can also be applied in a test bench environment. In the present case, the engine speed and throttle position were examined, and based on these two parameters, a certain engine torque was expected. The second-by-second evaluation of the engine torque was used to infer the correctness of the engine’s operation. Heydinger et al. described a somewhat similar method [
8].
Basic monitoring and engine damage prevention systems are implemented to safeguard both the object of testing and the measuring equipment [
9]. However, these systems prioritize ensuring the safe conduct of testing rather than focusing on the testing objectives. Parameters are set for the dynamometer to monitor the engine under test as well as the test environment for safety, but an online evaluation of parameter combinations to ensure test validity is not currently available.
A further benefit of the automated assessment during dynamometer testing (ADT) method described in this paper is its aid in environmental conservation, intervening as needed and enabling timely corrections, thereby conserving energy (electricity and fuel) and prolonging the test equipment’s lifespan. A prerequisite for achieving this is establishing and evaluating online data using reference data.
2. Methodology
The AVL Puma Open 2 R6.4 software was used for the development of the automation of the engine tests. The software package includes a specialized data evaluation software, Concerto, for the automatic analysis of the results, and it used concurrently with the automation software during engine tests.
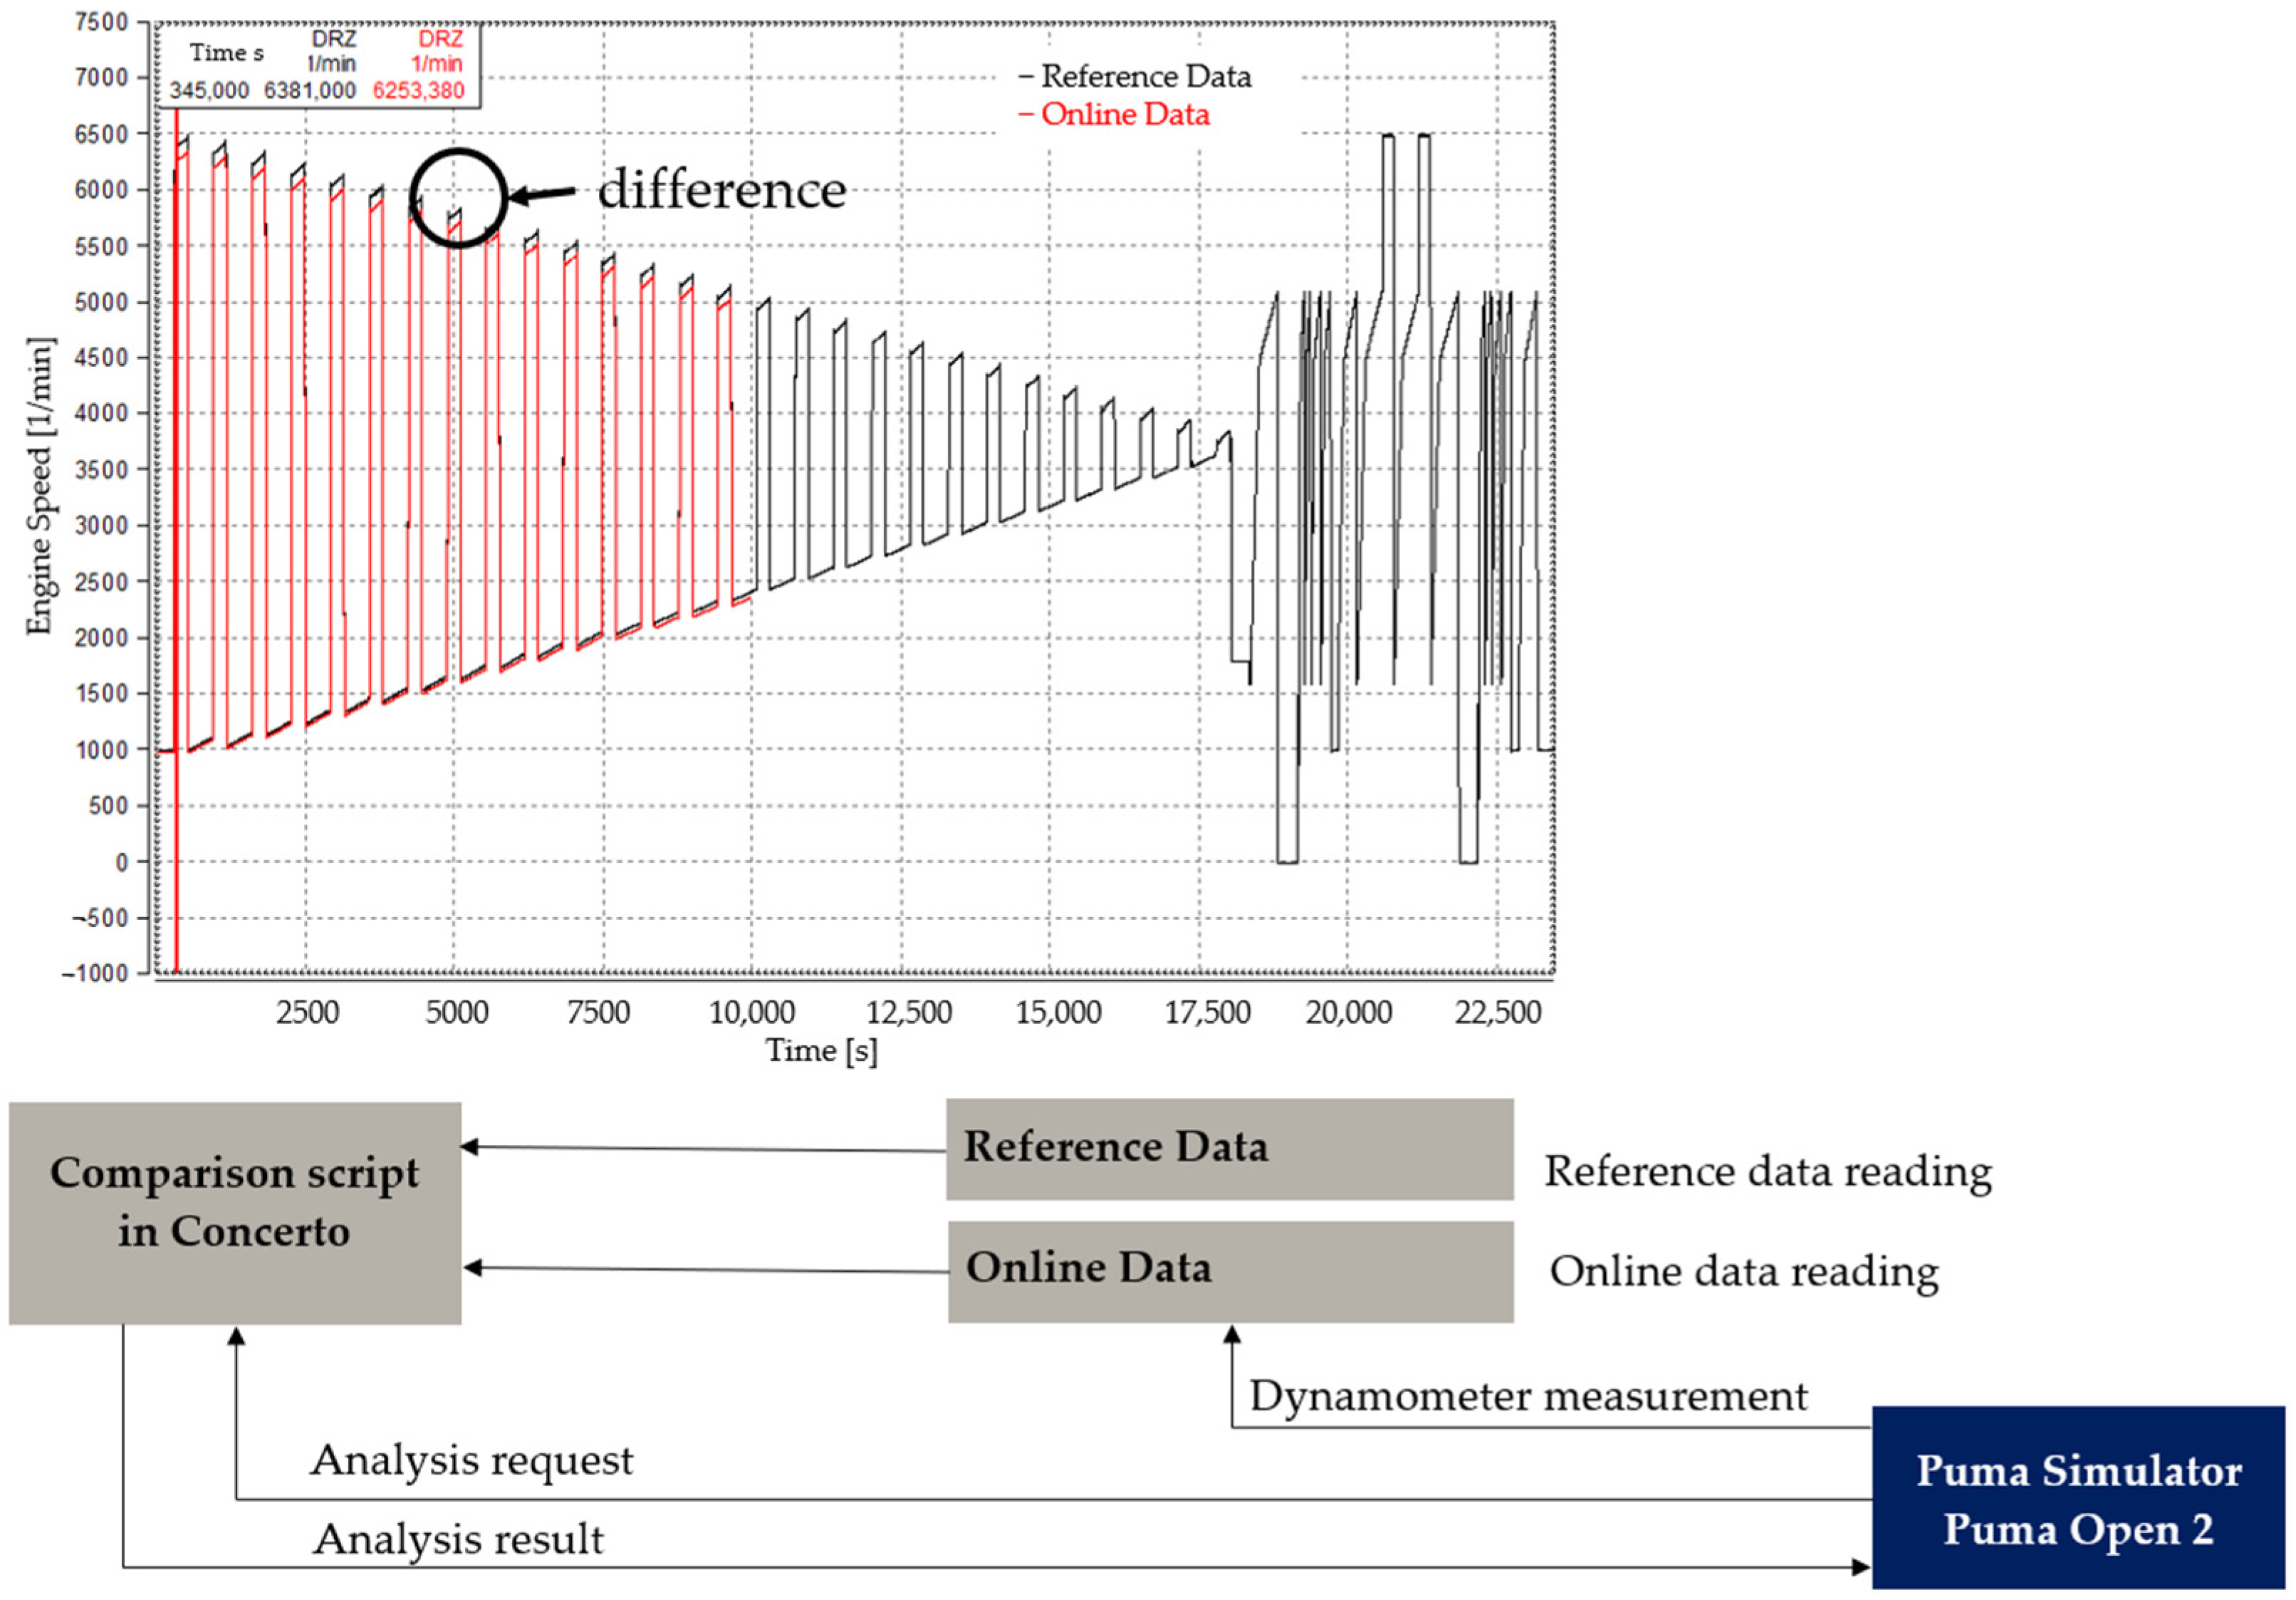
Figure 1 illustrates the principle of automatic monitoring of measurement data.
Figure 1 shows the engine speed–time trace of a randomly selected test cycle, highlighting the difference between reference and online data. A deviation of up to 5% is permissible between the actual test bench engine speed parameter and the reference data. Exceeding the 5% threshold triggers feedback from the test equipment. Depending on the automation software settings, this feedback could lead to a variety of actions ranging from a warning to the dynamometer operator to a complete halt of the test.
2.1. The Assessment Method
The steps of the assessment method implemented on the dynamometer:
Prepare a test-run program and dynamometer configuration files;
Establish communication with the evaluation software for automated running;
Automate time synchronization between reference and online data;
Implement automatic evaluation;
Apply a customized recorder;
Test and fine-tune the function.
2.2. Steps of Data Synchronization
As the first step, the reference data must be established, outlining the parameters for comparison with the data collected during dynamometer operation. These reference data include the expected values throughout the test cycle. Specifically, speed, engine torque, and throttle position are designated as monitored parameters with defined acceptance ranges.
The second step involves making the online data accessible to the evaluation software. This can be achieved through a database or local storage. The online data comprise the information currently generated during the test, allowing the evaluation process to access it without delay until the test concludes. Storing data in an online database is advised by the automation software based on its adaptable logic. However, data are initially recorded in a local file, then structured, organized, and stored in a customized manner to facilitate transparent data management.
The third step involves merging and comparing the measurement data to the reference data. Synchronization is crucial for comparing two sets of data, enabling a precise comparison at a specific time point. Parameters and sample data were both analyzed at a 10 Hz frequency. A sample search was conducted, assessing events from the final 5 min of test equipment operation based on speed parameter. Within this 5 min window, the data acquisition system recorded 180,000 measurement data points for a single variable. A maximum deviation of ±7% was permitted in the sample data in 2 s increments for the entire sample data section compared to the reference data. If ±7% of the reference data ran error-free in the part of the reference data, it was assumed that the sample data had been located within the reference data. The purpose of the above identification is to pinpoint where in the reference measurement the events of the last 5 min of the measurement occur. We can see the illustration of this in
Figure 2, where the data marked in red represent the data generated in the last 5 min of the dynamometer measurement, which need to be aligned with the reference data, while the data marked in blue show the correct alignment with the sample data.
The fourth step involved comparing the measurement data. If the values are within the predefined range, the test is considered successful. The average values of the variables in the sample data are compared with the average values in the reference data within the defined range. If the deviation is within the specified tolerance range, the test functions are as intended. This process is repeated every thirty seconds until the test concludes. The initial 5 min are dedicated to data collection, during which evaluation is not possible due to insufficient data.
2.3. Implementation on a Dynamometer
Steps required for dynamometer implementation:
Create a measurement “layout” file using Concerto 5 R7.7 software;
Configure the recorder and sampling parameters;
Implement the dynamometer automation program:
Initiate recorder;
Define variables for monitoring system;
Execute a parallel run operation by running a specific loop and defining variables;
Implement a while-loop that calls the evaluation software and associated script at set time intervals;
Stop the recorder.
Develop a macro that can be invoked from the dynamometer automation software;
Manage local measurement files to prevent the hard disk from filling up over time;
Configure a recorder setup.
3. Result and Discussion
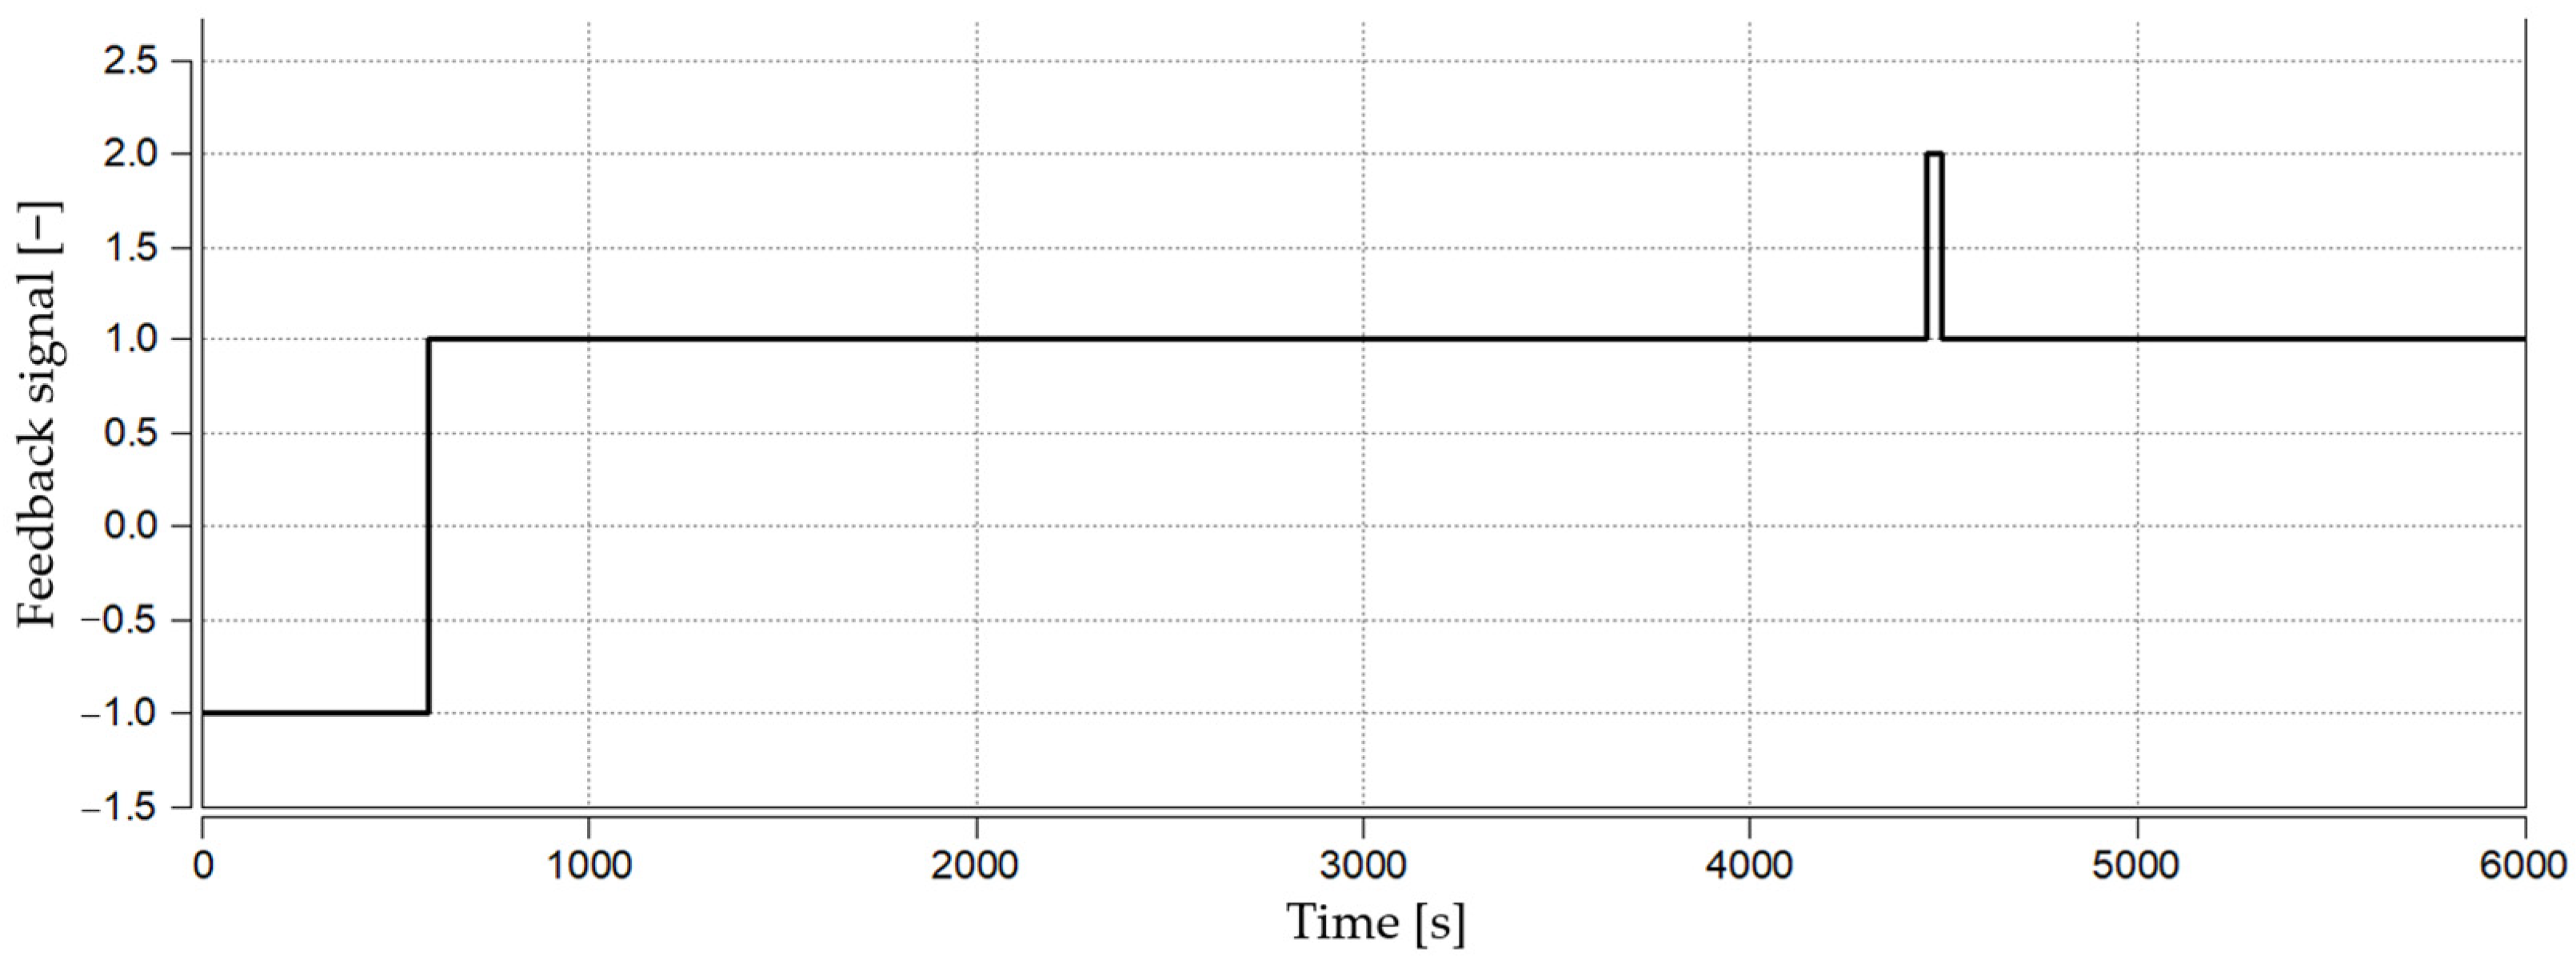
The method and its solution were considered satisfactory in testing. This is supported by the evaluation results in
Figure 3, displaying feedback values sent to the dynamometer in the final test. In the 6795 s test, one sample could not be matched in the reference data (feedback value = 2). A total of 226 automated checks were conducted during the test, with the initial 10 checks involving data acquisition (feedback value = −1). In previous tests, ongoing enhancements and adjustments were implemented, including the fine-tuning of the synchronization script. Consequently, a maximum error margin of ±7% and allowance for 25 errors were set to match the sample with the reference file (feedback value = 1).
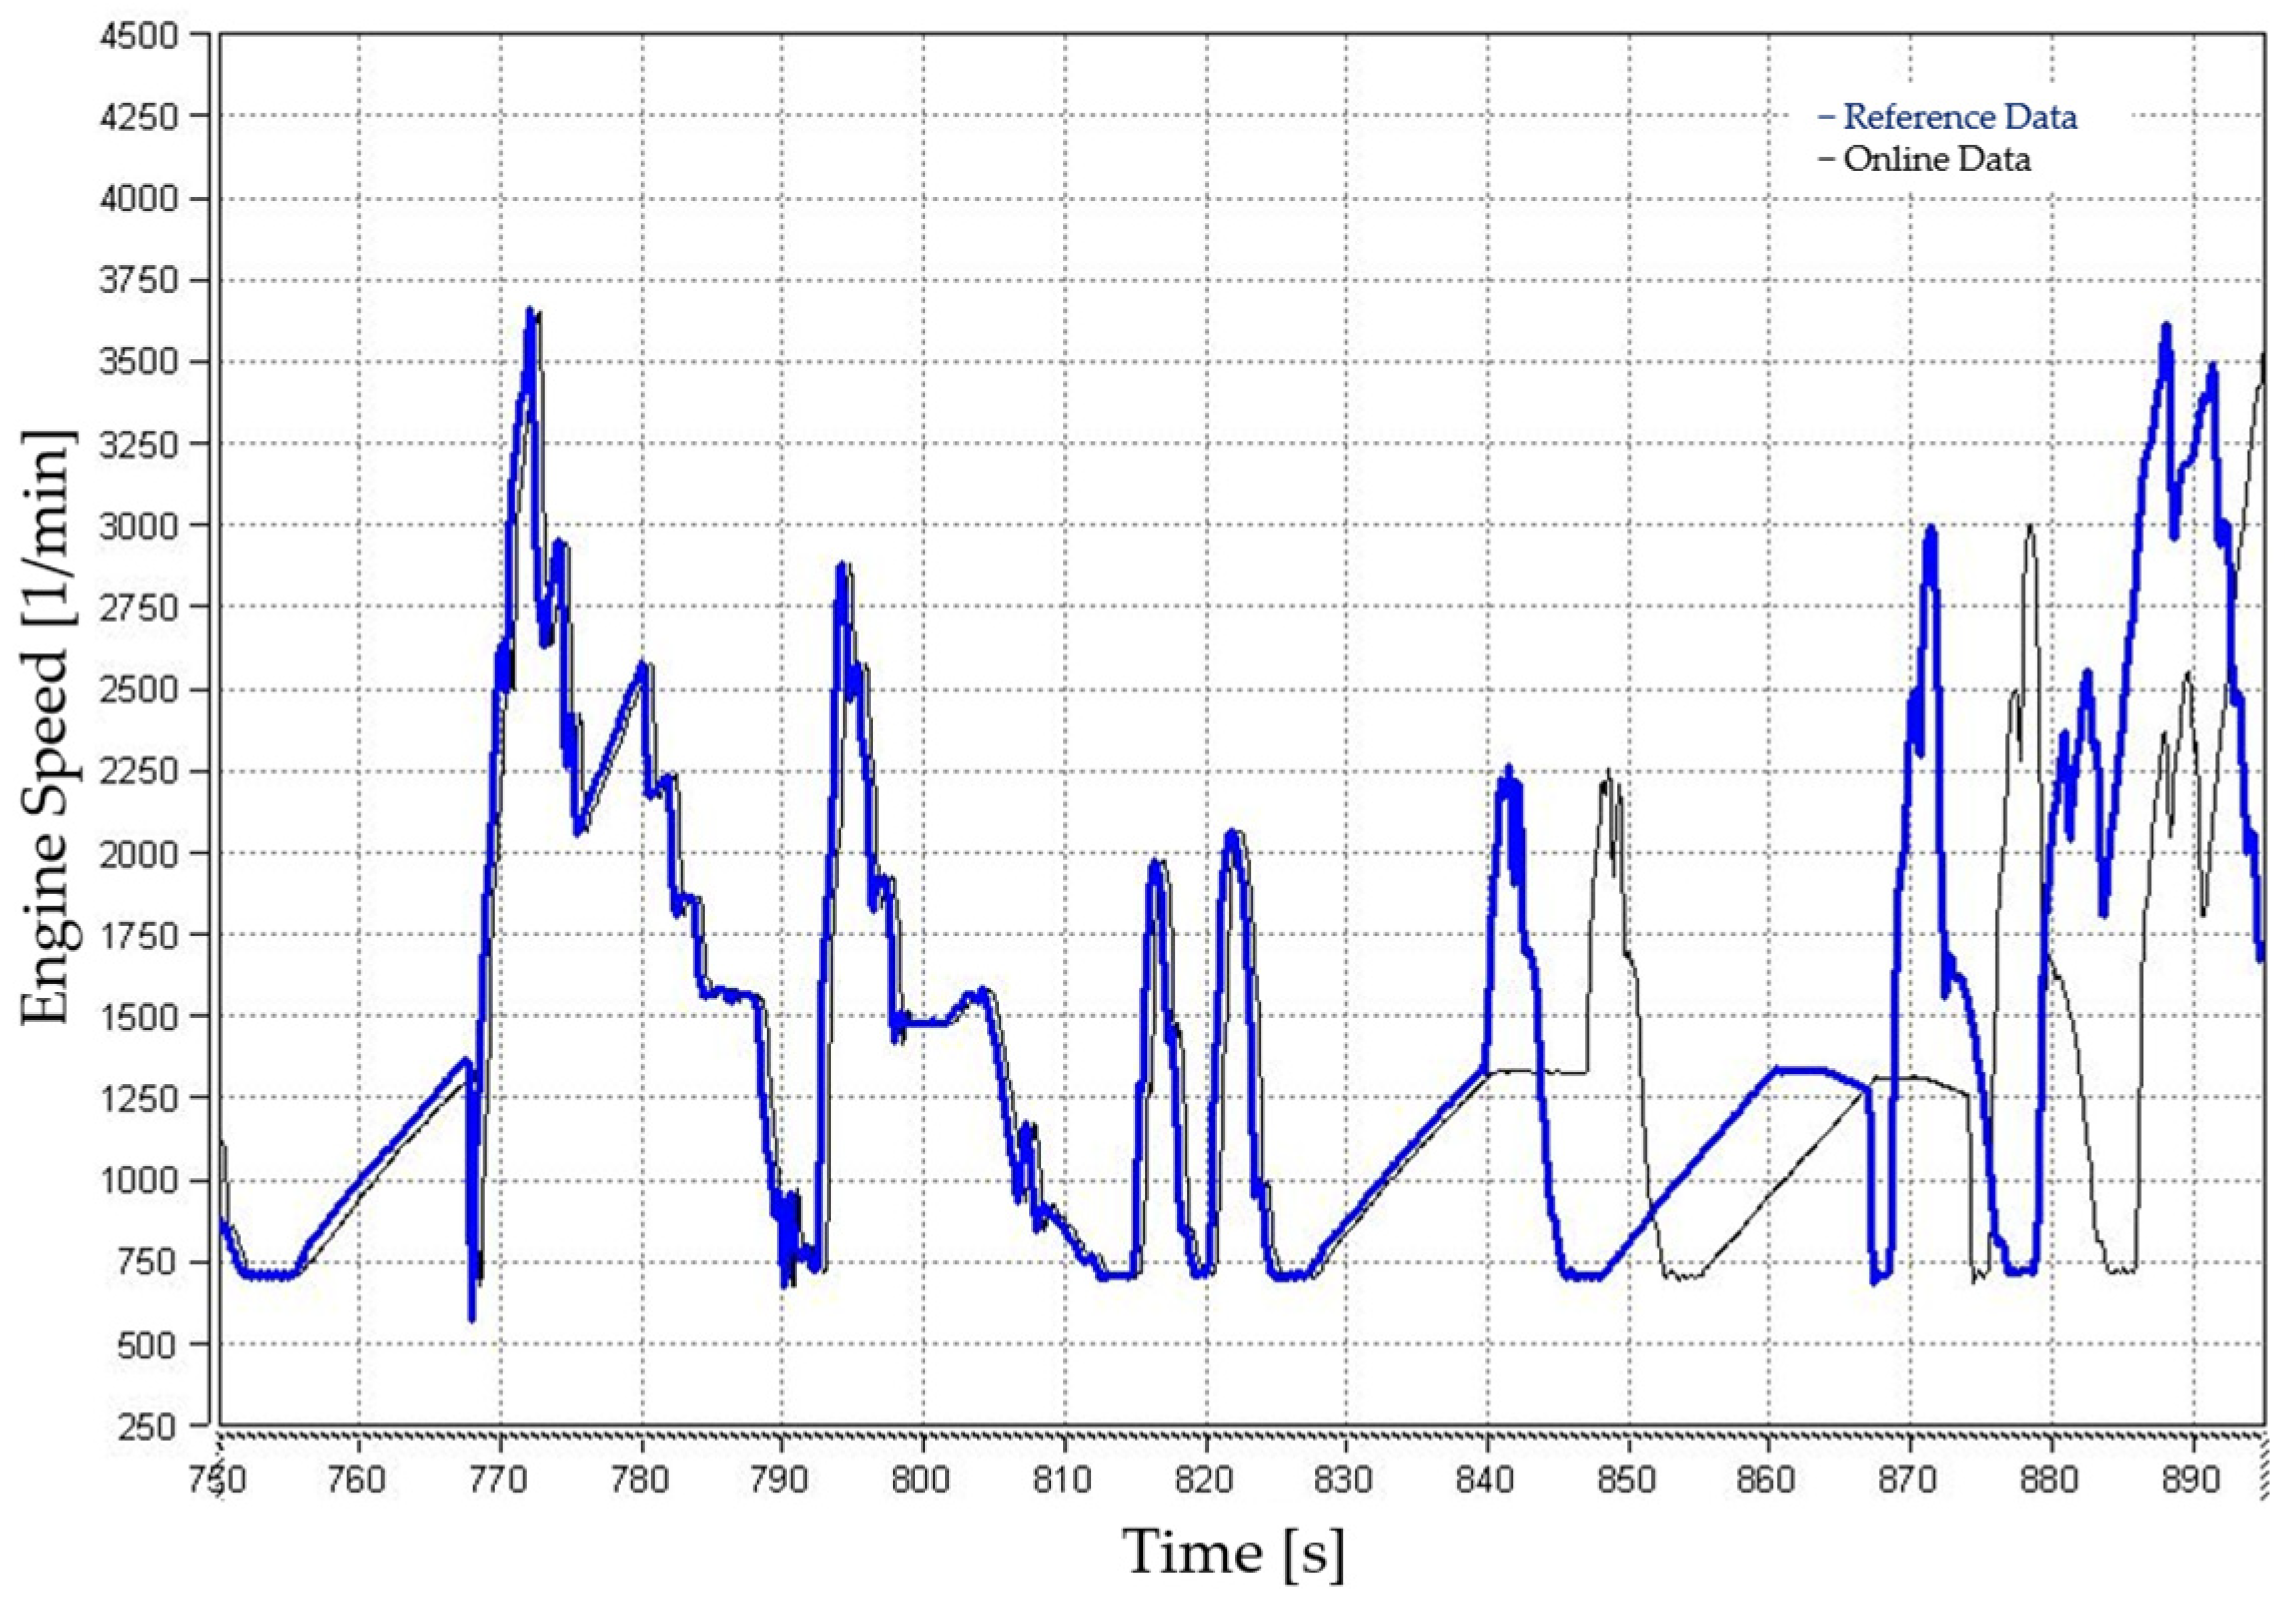
The accurate setup and calibration are demonstrated by the corresponding image in
Figure 4, illustrating how the reference data align the recorded values on the test bench with the appropriate timing during the tests. The control function was also tested on another engine test cycle, which is more dynamic in terms of speed. The “Feedback signal” sent to the dynamometer can take the next values:
–1, data collection is ongoing;
0, data do not match;
1, data compliance is satisfactory;
2, data from test bench cannot be recognized in the reference data.
It can be inferred from
Figure 3 that throughout the test run, there was one instance where the frame condition filtering failed to recognize the test bench station data in the reference data. The feedback value = 2 portion of
Figure 3 at around 4450 s shows an event of data mismatch caused by setting the automation system into a manual mode. The failure to identify the sample is attributed to the mismatch between the frame conditions and the test measurement results from the test equipment. The new method, automated assessment during dynamometer testing (ADT), correctly identified the deviation and signaled it, and then it continued to operate automatically.
To test the ADT (automated assessment during dynamometer testing) method, we switched from the automatic mode to the manual mode and then back to the automatic mode. The program detected the deviation and signaled it to the dynamometer. This detail can be seen in
Figure 4, where blue is the reference and grey is the actual measured value.
Upon analyzing the data, it was determined that the test machine’s PI controller required adjustment and the framework was too rigid for the algorithm to locate a match in the reference data.
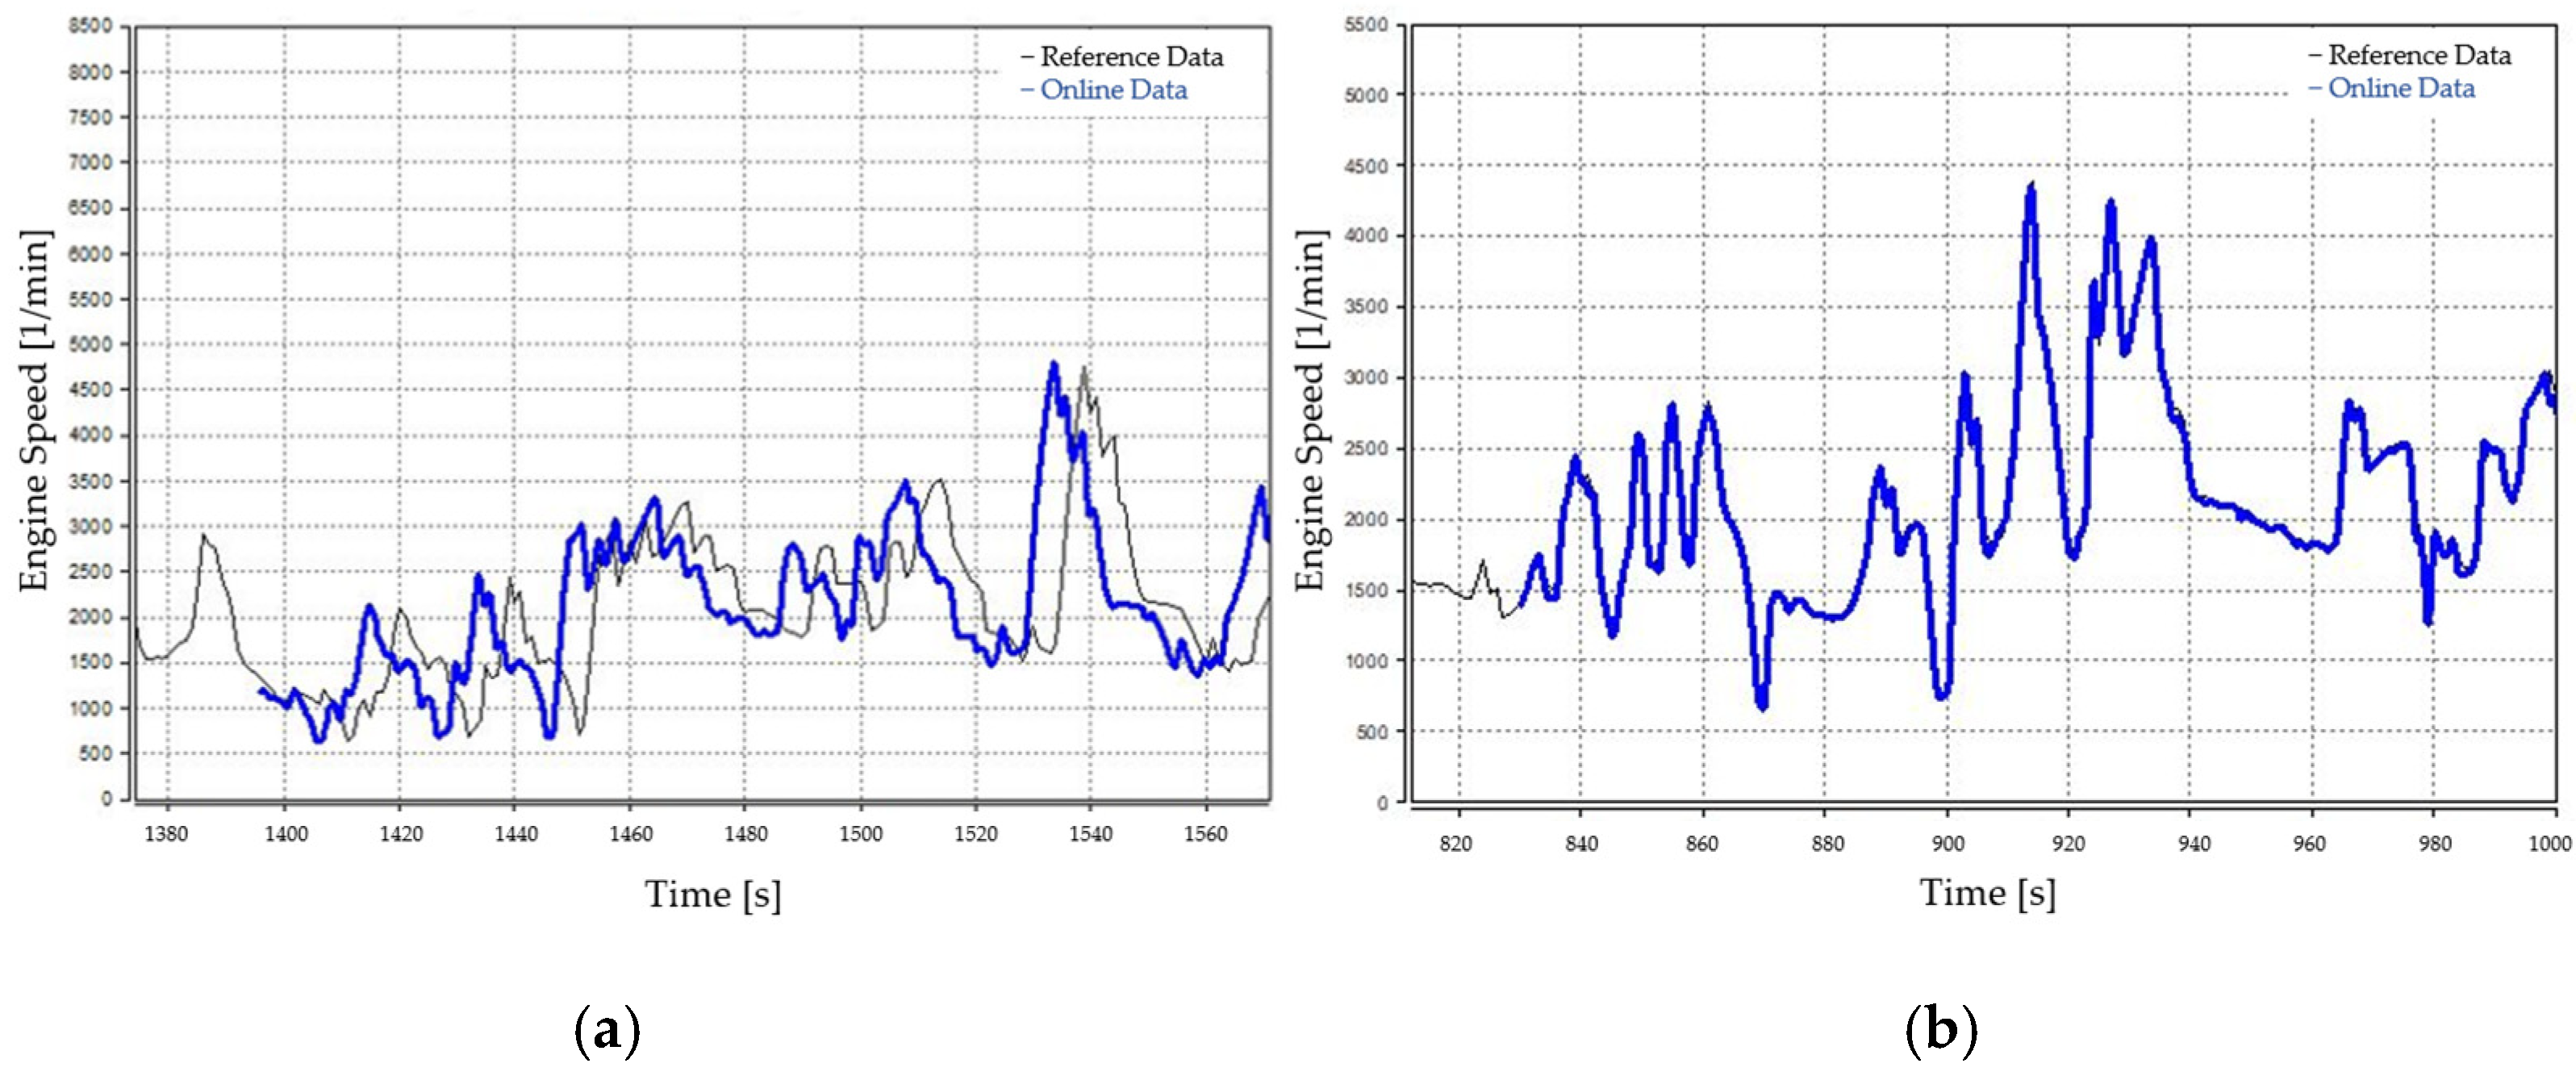
Figure 5a shows the erroneous detection of a test run when the permissible error was set to 20, while the
Figure 5b shows the result of the accuracy of the synchronization of the two measurements when the permissible error was set to 7. The two data sets are then evaluated. The accuracy of synchronization is expressed as a percentage representing the permissible maximum deviation (degree of freedom) related to reference recognition. During testing, it was found that allowing a higher degree of freedom helps in finding the data but degrades the accuracy of the synchronization, as illustrated in
Figure 5.
In this case, it can be noticed that the data “slip” causes problems of data synchronization.
However, for the verification method to work correctly, the computational capacity of the computer requires time to be allowed between runs of the software parts, as files are saved locally to the hard disk and the save operation may not be completed in time. For this reason, a delay of 250 ms was imposed on the sequential execution of software sections when saving the recorder, which eliminates this type of error.
4. Conclusions
The novel ADT (automated assessment during dynamometer testing) method enables the online monitoring of dynamometer test cycles, offers immediate feedback, and is automatically evaluated according to predefined values. This enables the detection and flagging of cases that were previously undetectable, such as incorrectly programmed engine running modes, undesired change between operating modes, and insufficient communication between test systems.
The ADT method can ensure that the engine runs as intended and under the desired conditions. Operating the test equipment with online supervision in place allows for further trends and development opportunities. It is crucial to observe forecasts and engine behavior, comparing them with historical data to make accurate predictions.
Anticipating issues during dynamometer tests and promptly intervening is a complex endeavor. By analyzing historical data, we can forecast and avert potential engine damage, ensuring smoother testing procedures. Recognizing and identifying early signs is the next challenge in the future, as the path of development is nothing more than capitalizing on the experience gained from the past. Early warnings and evaluation contribute to the reduction of testing cost, which also contributes to the competitiveness of the organization carrying out the process.
In conclusion, the monitoring system described in the article represents a significant step forward in the realm of testing and evaluation. Its integration of virtual environments and automated feedback mechanisms showcases a forward-thinking approach that has the potential to redefine standards in monitoring and testing practices.
Author Contributions
Software, T.K.; investigation, T.K.; methodology, T.K.; writing—original draft preparation, T.K.; writing—review and editing, C.T.-N. and T.K.; visualization, C.T.-N. and T.K.; supervision, C.T.-N. and T.K. All authors have read and agreed to the published version of the manuscript.
Funding
This research received no external funding.
Institutional Review Board Statement
Not applicable.
Informed Consent Statement
Not applicable.
Data Availability Statement
Data for this study are not publicly available.
Conflicts of Interest
The authors declare no conflicts of interest.
References
- Frieske, B.; Kloetzke, M.; Mauser, F. Trends in vehicle concept and key technology development for hybrid and battery electric vehicles. In Proceedings of the 2013 World Electric Vehicle Symposium and Exhibition (EVS27), Barcelona, Spain, 17–20 November 2013; pp. 1–12. [Google Scholar] [CrossRef]
- Bhadane, K.; Sanjeevikumar, P.; Khan, B.; Thakre, M.; Ahmad, A.; Jaware, T.; Patil, D.P.; Pande, A.S. A Comprising Study on Modernization of Electric Vehicle Subsystems, Challenges, Opportunities and strategies for its Further Development. In Proceedings of the 4th Biennial International Conference on Nascent Technologies in Engineering (ICNTE), Navi Mumbai, India, 15–16 January 2021; pp. 1–9. [Google Scholar] [CrossRef]
- Maurer, M.; Gerdes, J.C.; Lenz, B.; Winner, H. Autonomous Driving: Technical, Legal and Social Aspects; Springer: Berlin, Germany, 2016; ISBN 978-3-662-56958-0. [Google Scholar]
- Kashevnik, A.; Shchedrin, R.; Kaiser, C.; Stocker, A. Driver Distraction Detection Methods: A Literature Review and Framework. IEEE Access 2021, 9, 60063–60076. [Google Scholar] [CrossRef]
- McDonald, A.D.; Ferris, T.K.; Wiener, T.A. Classification of Driver Distraction: A Comprehensive Analysis of Feature Generation, Machine Learning, and Input Measures. Hum. Factors 2020, 62, 1019–1035. [Google Scholar] [CrossRef] [PubMed]
- Zhang, X. Modeling and Dynamics Control for Distributed Drive Electric Vehicles; Springer Fachmedien Wiesbaden: Wiesbaden, Germany, 2021; pp. 1–9. ISBN 978-3-658-32213-7. [Google Scholar] [CrossRef]
- Koller, T.; Tóth-Nagy, C.; Perger, J. Implementation of vehicle simulation model in a modern dynamometer test environment. Cogn. Sustain. 2022, 1, 27–32. [Google Scholar] [CrossRef]
- Heydinger, G.; Garrott, W.; Chrstos, J.; Guenther, D. A Methodology for Validating Vehicle Dynamics Simulations; SAE Technical Paper 900128; SAE: Warrendale, PA, USA, 1990. [Google Scholar] [CrossRef]
- Abruzi, I.B.; Iqbal, M.; Mukhlash, I.; Rukmi, A.M.; Kurniati, N.; Kimura, M. Engine Failure Detection of Raw Mill Machine via Discrete Variational Auto-encoder. In Proceedings of the International Conference on Data and Software Engineering (ICoDSE), Denpasar, Indonesia, 1–2 December 2022; pp. 59–64. [Google Scholar] [CrossRef]
| Disclaimer/Publisher’s Note: The statements, opinions and data contained in all publications are solely those of the individual author(s) and contributor(s) and not of MDPI and/or the editor(s). MDPI and/or the editor(s) disclaim responsibility for any injury to people or property resulting from any ideas, methods, instructions or products referred to in the content. |
© 2024 by the authors. Licensee MDPI, Basel, Switzerland. This article is an open access article distributed under the terms and conditions of the Creative Commons Attribution (CC BY) license (https://creativecommons.org/licenses/by/4.0/).


