1. Introduction
The efficiency and safety of traffic management can be enhanced with real-time, online vehicle position data, as demonstrated by Péter et al.’s trajectory-based urban traffic optimization [
1]. The incorporation of real-world data into simulations enhances their validity, as evidenced by Bóna et al., who utilized simulations to model stochastic systems in urban logistics [
2]. Air traffic control differs from other transportation modes, as centralized decision-making primarily depends on human judgment, making human performance and the impact of automation crucial factors. Wang et al. investigated the impact of automation tools on the behavior of air traffic controllers (ATCOs), revealing that while automation reduces controllers’ workload, it significantly modifies their behavior during surveillance, planning, and control tasks [
3]. Similarly, Zamarreño Suárez et al. employed simulation to quantify the effects of various events on the workload of air traffic controllers [
4]. Additionally, Novák et al. introduced a mathematical model for conflict prediction in unmanned aircraft, based on 3D trajectory extrapolation and simulation of shared airspace usage [
5].
The organization of the air traffic control process in a strategic phase can be facilitated by information on future air traffic situations, if available. This can be the basis for sectorization planning by pre-estimating the sector load and even by predicting an optimal sector configuration. With the automation efforts in air traffic control, it becomes necessary to create a universal test environment that can be used for testing in terms of the following:
Conflict resolution algorithms;
The management structure;
The human–machine task allocation model.
The validity of a validation process necessitates the use of real, actual data, ensuring that the model is based on real-world traffic operations. Although historical radar data, which represent past traffic, are available, they are inadequate for evaluating new management functions, as these data reflect traffic that was already managed under existing systems. Consequently, such archived data primarily show rerouted traffic and do not provide insight into unresolved conflicts.
ADS-B (Automatic Dependent Surveillance–Broadcast) is a new way of airspace surveillance, which has been mandatory on most aircraft in the European Union since 2017 [
6]. Aircraft parameters, such as call sign, ICAO 24-bit identifier, altitude, speed, and direction, are gathered from sources like satellite communications, the flight management system (FMS), and pilot input to generate an ADS-B message. This message is transmitted by onboard transponders, received by ground stations, and forwarded to the air traffic control (ATC) system. Other aircraft also receive the signal, enhancing pilot situational awareness with real-time traffic information [
7].
ADS-B data are widely accessible, and individuals can easily build receivers at home, e.g., using a Raspberry Pi with open source software. Enthusiasts have created networks of these receivers, with websites aggregating the data and offering APIs (Application Programming Interfaces) for access. This makes ADS-B data an ideal choice for test environments, accessible to both air navigation service providers (ANSPs) and non-ANSP users as open data.
This accessibility has led to the use of these data in various studies. Baek and Bang developed a conflict detection algorithm based on trajectory estimation, while Shultz et al. applied clustering techniques within the A-CDM system to predict brake release times [
7,
8]. Sun et al. created models based on aircraft type to estimate flight parameters, and Dy and Mott used ADS-B data to evaluate separation minima infringement reporting by comparing reported events with those detected via ADS-B [
9,
10].
2. Realization Principle
A straightforward approach to achieving the objectives would be to combine ADS-B data with flight plan data. However, while flight plan data are available to ANSPs, they are not easily accessible to the public, especially in real time and at low cost. As a result, only ADS-B data were used in the implementation. Several servers provide APIs that offer these data either for free or at a low subscription cost. Most programming environments, such as Python or Java, offer built-in support for these APIs. In our case, MATLAB was chosen for the implementation, utilizing its built-in functions like webread to retrieve API data, typically provided in JSON format, which MATLAB automatically parses.
The ADS-B data, available in WGS-84 coordinates (World Geodetic System), can be easily visualized. MATLAB’s geoscatter function can place these data on a map, and additional mapping functionalities are available through the Mapping Toolbox, which was used in this study. For regional filtering, geographic information such as country borders can be imported via .shp files or API queries, using functions like inpolygon. If more detailed airspace information is needed, the OpenAir format can be converted to formats manageable by MATLAB (e.g., GeoJSON).
The Open Sky Network provides an API that filters ADS-B data for a specified area, returning real-time aircraft information [
11]. The server also has a new, beta feature that tracks aircraft trajectories at 15 s intervals or when significant changes occur. However, this feature is not yet consistently stable, so similar data can be gathered by running queries at regular intervals. For airspace information, the publicly available OpenAir format can be converted into a format that MATLAB manages (e.g., GeoJSON), enabling the indexing of individual airspace elements.
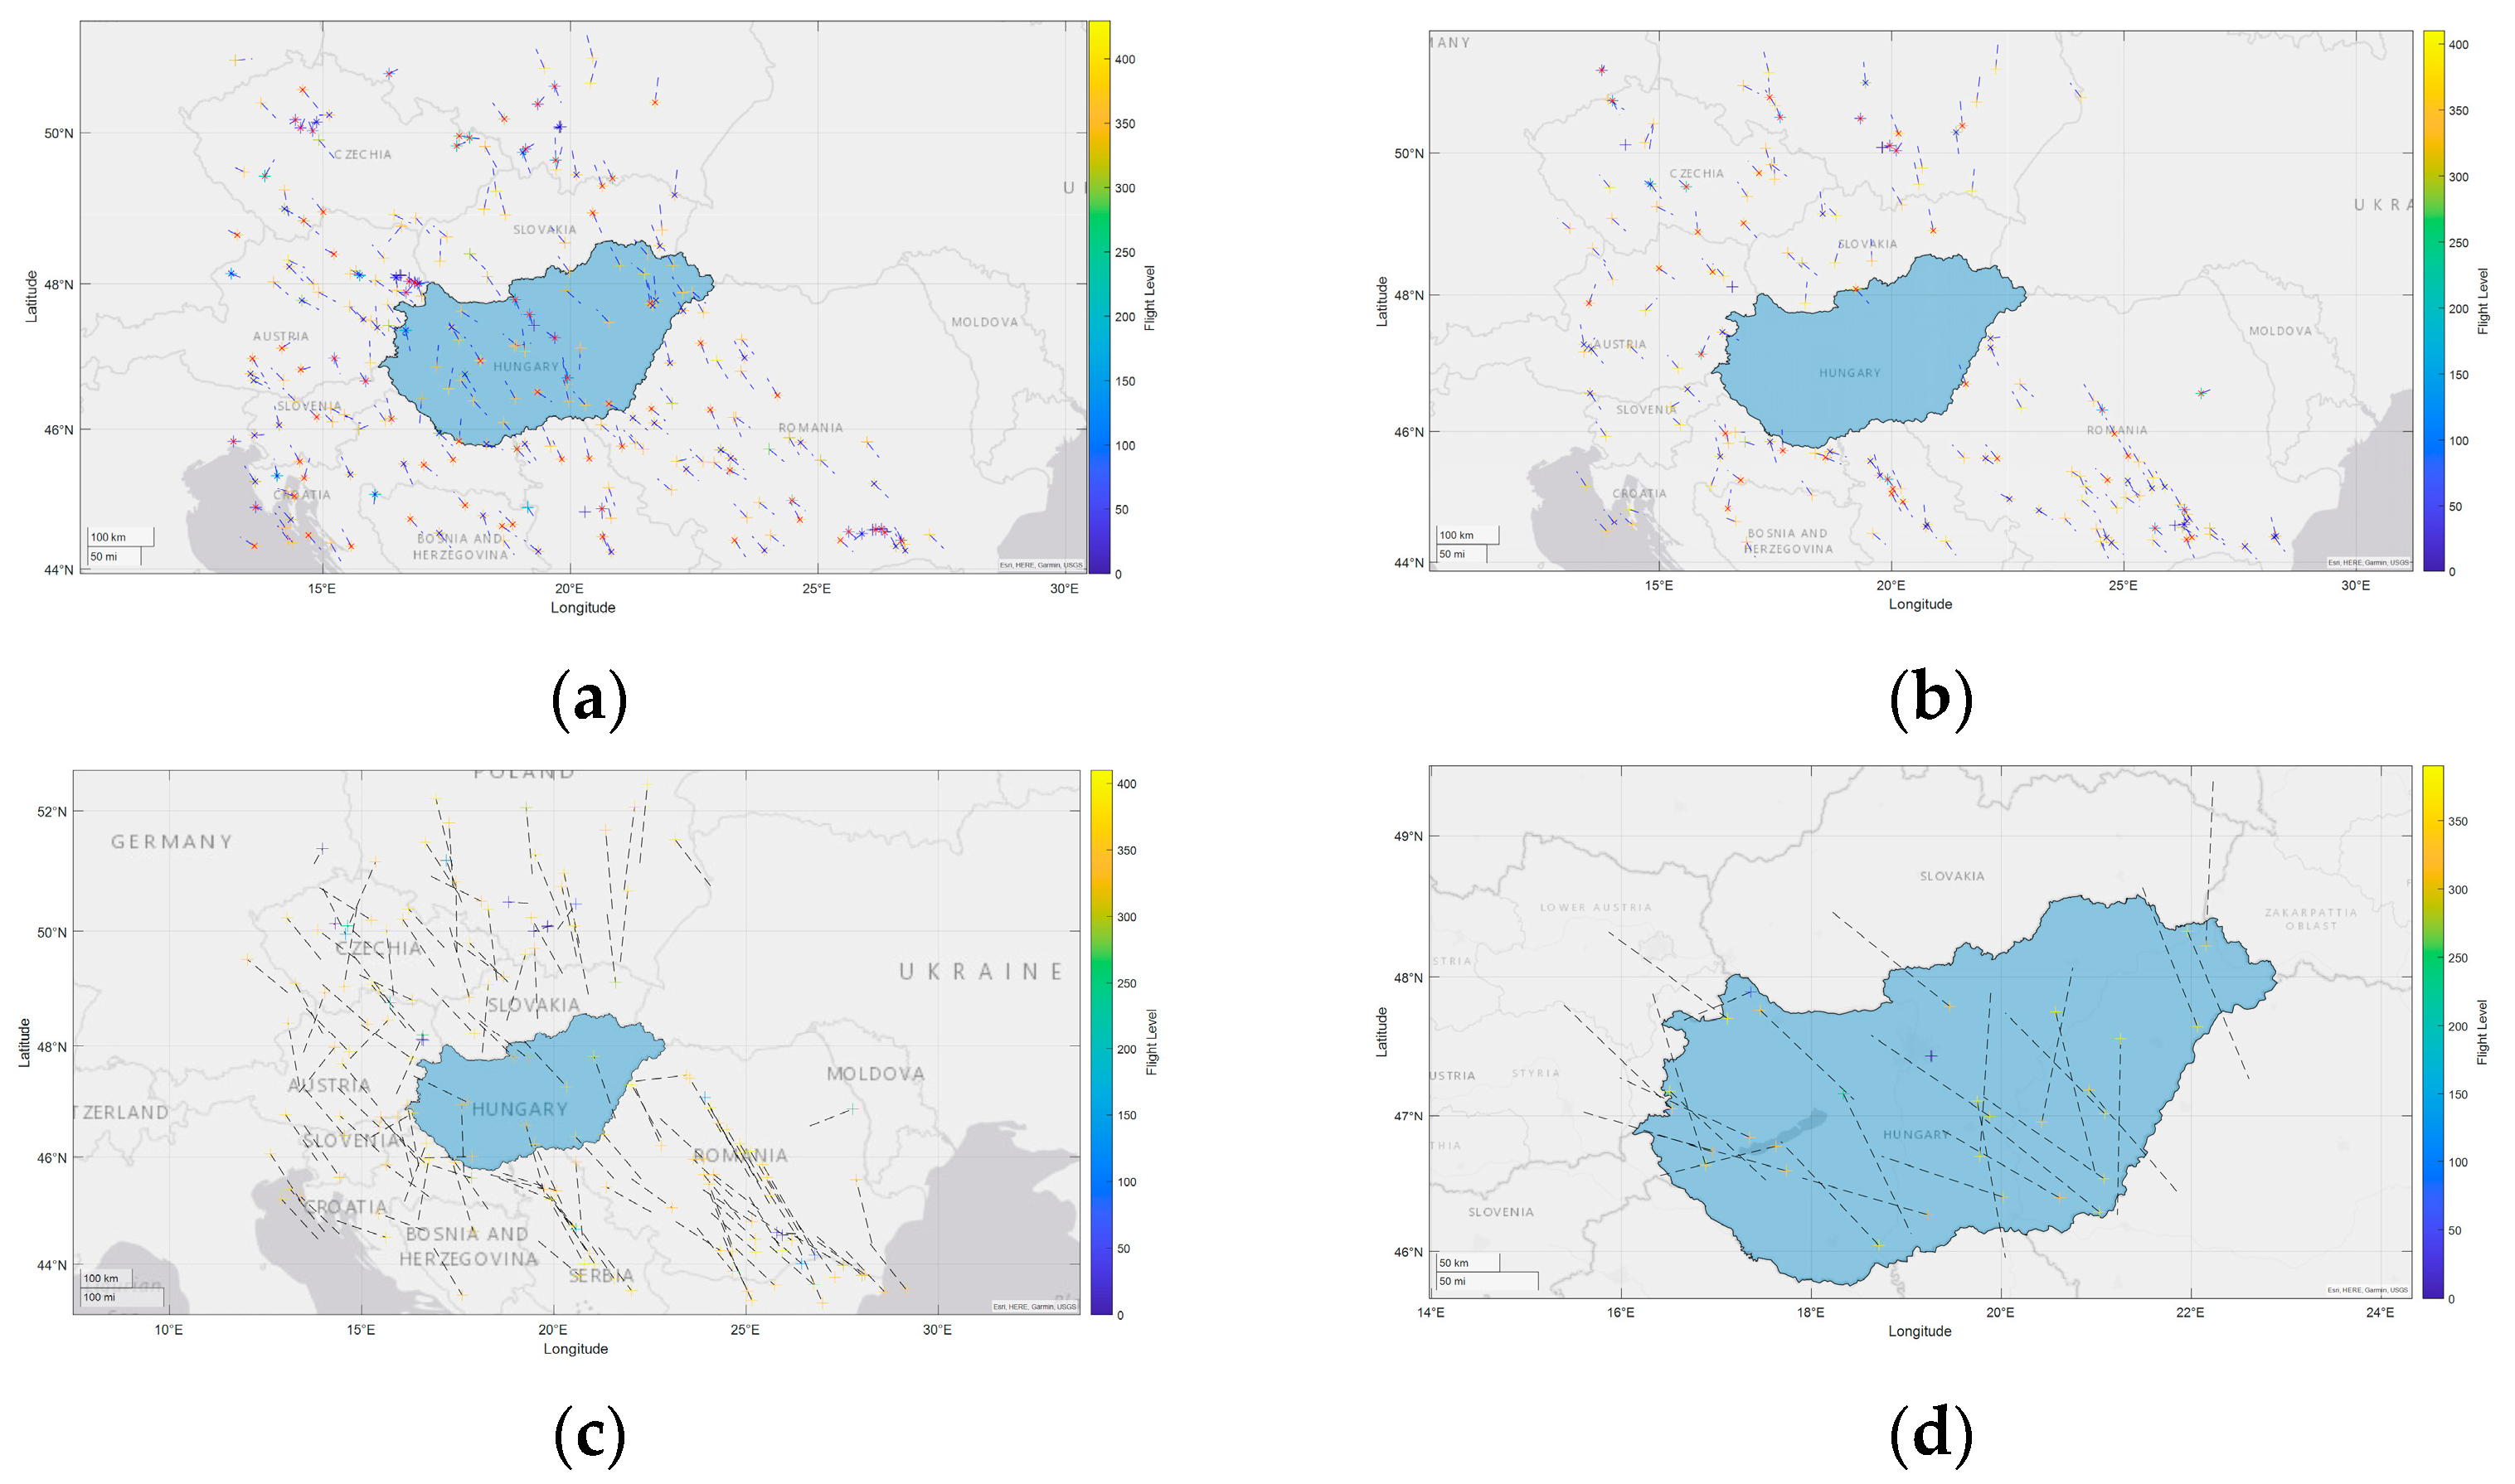
A simple visual representation can be generated from the API data for validation purposes. In
Figure 1a, the tested airspace is Hungarian airspace (highlighted in blue), and aircraft positions are color-coded by altitude. Ascending aircraft are shown in blue, while descending ones are marked with a red “x”, and their direction is indicated by blue dashed lines, with vector lengths proportional to speed.
2.1. Future Demand
One of the objectives of the simulation is to generate a set of demands that emerges after time
t for testing automated control. In the control sector under examination (in this case, Hungarian high airspace), it is evident that the aircraft within the sector is already under sector control, meaning that air traffic controllers are actively ensuring that no conflicts arise. Therefore, after filtering out the aircraft already present in the examined sector, only those that have not yet entered the airspace are shown in
Figure 1b.
By examining the aircraft vectors in
Figure 1b, a set of demands emerges that contains the aircraft expected to enter the airspace after time t. Using the aircraft’s current speed and direction, the simulation can provide an accurate estimation of their positions after
t minutes. Intervals of 10 to 20 min generally provide reliable estimates. In the example provided, setting
t = 10 min results in the estimated traffic situation illustrated in
Figure 1c.
In
Figure 1c, the black dashed line represents the future estimated route, behind the future estimated position. The future estimated traffic situation highlights the set of demands that will arise for a given sector after time
t, based on the following assumptions:
Aircraft will maintain approximately their current direction, as they are flying in free route airspace, where they have presumably chosen a favorable route and intend to follow it;
Ascent or descent maneuvers will continue conditionally, for instance, until the aircraft reaches the designated flight level.
The demand set retains the same structure as the original ADS-B data, with certain parameters remaining unchanged (e.g., direction) and others being conditionally modified (e.g., coordinates depending on speed and direction, or flight level during level change).
2.2. Future Traffic Load
Another goal of the simulation is to estimate the future traffic load of a selected airspace or sector after time t. Given the size of the sector, the aircraft speed, and the time window t, it is not always appropriate to dismiss the current traffic within the sector. For instance, in the case of Hungarian high airspace, an average flight can cross from north to south within 30 min. However, aircraft departing from nearby airports and heading east or west may remain within the airspace for a longer period, depending on their speed and trajectory.
The example illustrated in
Figure 1d shows aircraft in Hungarian airspace after
t = 10 min, where the black dashed line represents the estimated route over the next 10 min. As before, the data appear in the same structure as the ADS-B data.
3. Validation
In the proposed model, following the designated time t, the error in estimates derived from ADS-B data can be calculated through iterative querying. When selecting the time t, careful attention must be paid to the ADS-B data update interval, which, in the present case, occurs every 15 s via the utilized API. Consequently, it is recommended to project estimates over a minimum of two minutes to mitigate errors arising from the update frequency. As illustrated in
Figure 2, after a five-minute interval, the calculated and re-examined data are presented, with the actual displacement (inferred from the ICAO 24-bit transponder identifier) denoted by a blue dashed line, and the actual position is color-coded according to altitude. The black dashed line and marker signify the calculated displacement and position, respectively.
From the analysis depicted in the figure, several sources of estimation error can be identified, namely the following:
In airport vicinities, approach and departure procedures cannot be accurately extrapolated;
During the time window between t = 0 and t = 2 min, clear assignments may not always be feasible, particularly near sector edges or during takeoff and landing intervals, where aircraft may enter or exit the defined airspace.
Additionally, examining the relative error of estimates, it is useful to filter out stationary aircraft on the ground, as their inclusion can artificially reduce the overall relative error. For instance, in
Table 1, the relative error is shown alongside the calculated positions of aircraft, including those stationed at airports, after
t = 5 min.
In calculating the relative error, the following factors are considered:
The average relative error of each aircraft’s latitude and longitude coordinates is considered;
The average error for the entire dataset is computed as the average relative error of all aircraft, where a matching data point is found.
In this example, the total relative error of the dataset, not excluding grounded aircraft, was 0.0051, whereas the exclusion of stationary aircraft increased it slightly to 0.006. The accuracy of the method was verified according to the results presented in
Table 1, with accuracy interpreted across time intervals. When selecting testing intervals, it is critical that the interval between two scans exceeds the program’s runtime, ensuring that processing is completed. In this case, the starting point for the estimate was snapshot data at
t = 0 min, which were compared to subsequent data points to evaluate accuracy. In practice, it is more effective to use the newly fetched dataset for the estimation, as this yields more accurate results over shorter time horizons. The testing conducted here demonstrates changes in accuracy over time.
Several methods can be considered to enhance the clarity of results, including the following:
Analyzing flight altitude and maneuvering behavior to identify aircraft approaching airports, estimate their time of arrival, and exclude them from the analysis based on the time window;
Incorporating weather conditions to estimate potential avoidance maneuvers;
Considering arrival and departure traffic at airports to refine trajectory predictions.
It should be noted that the error values in the table are exclusively interpreted in terms of horizontal positioning; accuracy related to flight altitude estimation is not included.
4. Future Work
The feature of flight track queries is currently a beta function. Should this feature be fully implemented, it could provide more precise trajectory estimations. In the interim, a feasible approach would be to extend the model’s operational duration. By dynamically running the model over an expanded time window t and iteratively querying for updated estimates, the results can achieve higher accuracy. This method proves particularly useful when analyzing smaller regions or sectors, rather than an entire country’s airspace.
Following this approach, the model could recommend optimal sector configurations to maximize efficiency, based on predefined criteria. These configurations could not only account for the number of aircraft (considered as a rough estimate) but also integrate additional factors, such as weather conditions or the volume of ascending and descending aircraft, when determining sector boundaries. In airspaces such as the TMA within the region, where procedural knowledge is available, relative errors near airports could be minimized. Furthermore, specific estimates could be generated for traffic in these regions, considering procedure-specific factors, such as nighttime operations.
Incorporating traffic data from airports near national borders can further enhance the model’s accuracy, especially with respect to the selected time window. For example, in the Hungarian case, Vienna Airport—located close to the border—becomes relevant within a 30 min window when analyzing incoming flights. Such data can be retrieved from airport databases or flight plans, though similar trends can also be identified by monitoring ADS-B data. Through repeated querying, descent patterns can be observed and correlated with proximity to airports.
The accuracy of the simulation can be improved by integrating the impacts of real-world events, such as weather phenomena and temporary reserved areas (TRAs), which lead to deviations and contribute to increased workload. This integration will establish a more robust framework for validating the automation of controller actions.
A key future objective is the development of an automated system capable of providing a reliable test environment, even in the presence of significant relative errors. Since the estimates are based on actual traffic data, they reflect real-time demand without accounting for rerouted flights, implying that potential conflicts within the given airspace remain unresolved. This estimation method, based on live traffic conditions, ensures that the estimates stay aligned with ongoing traffic dynamics.


