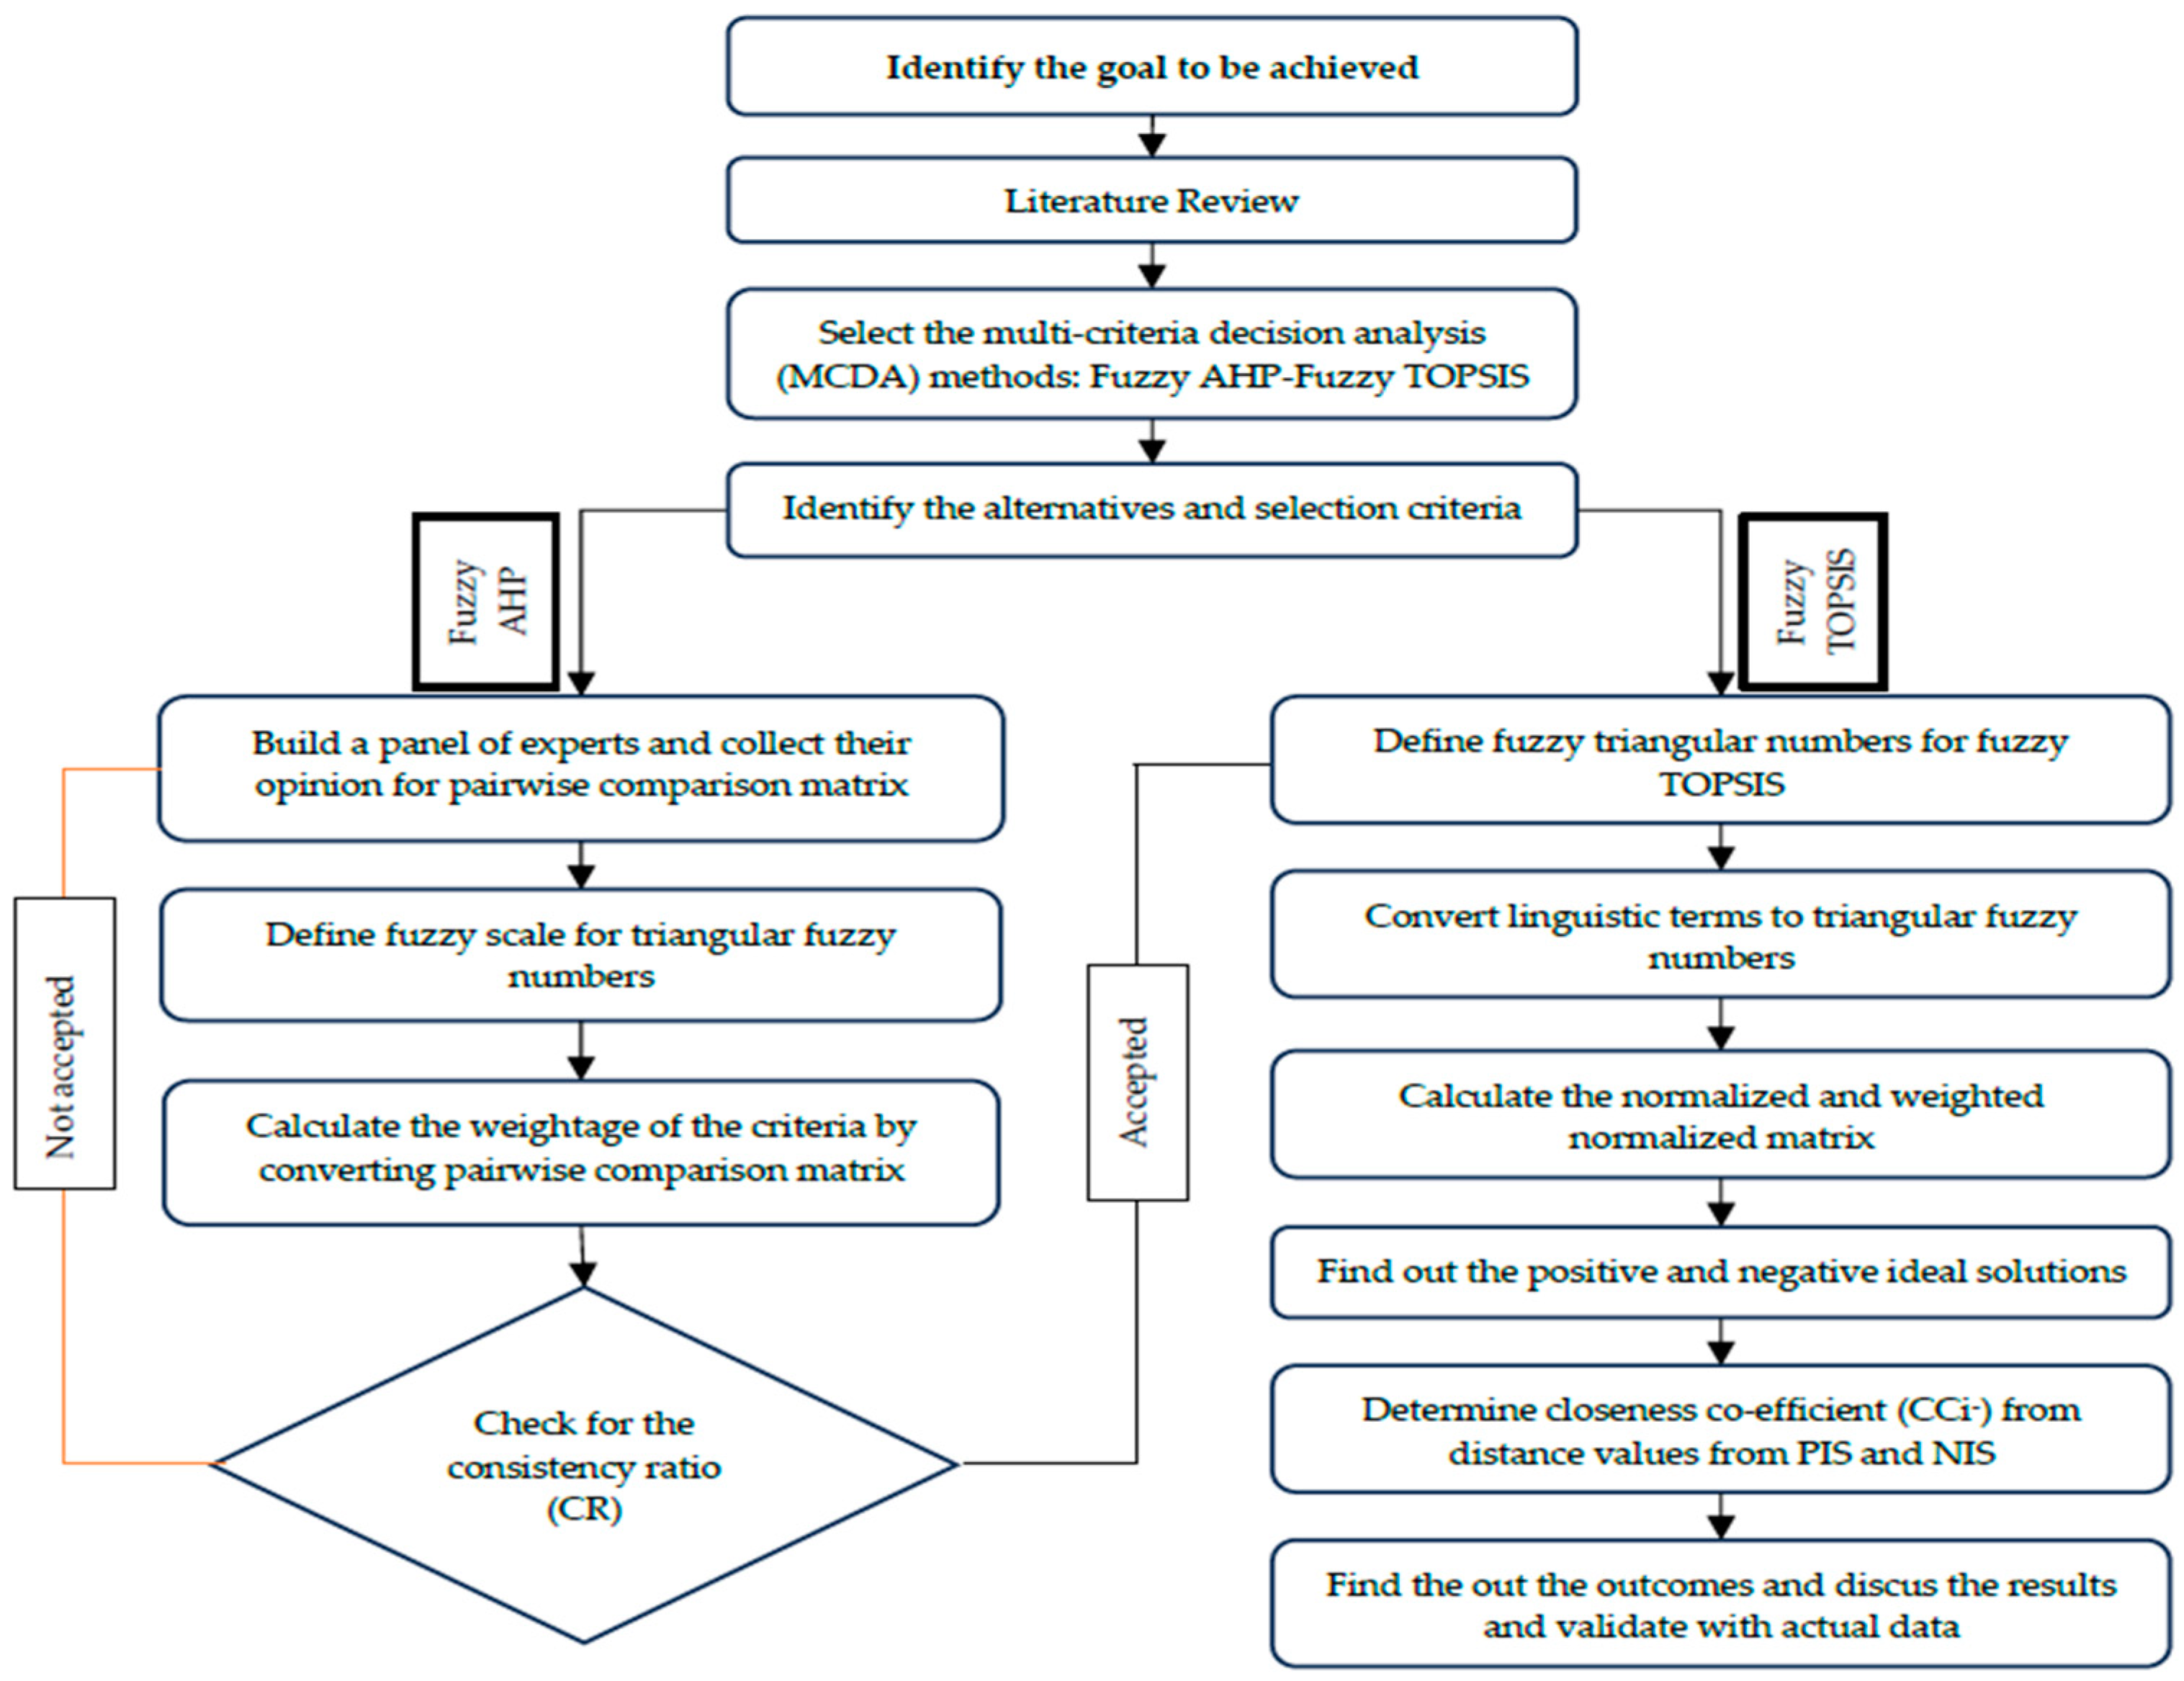
Proceeding Paper

Product Portfolio Optimization Using Multi-Criteria Decision Analysis †

Industrial Systems Engineering, University of Regina, Regina, SK S4S 0A2, Canada
*
Author to whom correspondence should be addressed.
Presented at the 1st International Conference on Industrial, Manufacturing, and Process Engineering (ICIMP-2024), Regina, Canada, 27–29 June 2024.
Eng. Proc. 2024, 76(1), 72; https://doi.org/10.3390/engproc2024076072
Published: 5 November 2024

Abstract

Globalization increases the potential for business expansion, which creates more opportunities in the market. The competition and expansion in the market create varieties of products to satisfy human needs and make it more difficult for the product planner to maintain huge piles of stock, resulting in high inventory costs to meet customer demands on time. Product portfolio optimization, as a tool of strategic management for companies in the competitive market, plays a vital role, helping businesses to constantly strive to maximize their returns while minimizing risks. This study explores Multi-Criteria Decision Analysis (MCDA) by using real-world applications of the fuzzy Analytical Hierarchy Process (AHP) and fuzzy TOPSIS, which offer a comprehensive approach by integrating quantitative and qualitative factors, to evaluate and prioritize products within a company’s portfolio, specifically focusing on the product of lead–acid storage batteries from a renowned organization in Bangladesh, aiming to provide valuable insights for businesses seeking to enhance their decision-making processes and achieve sustainable growth.

1. Introduction

In today’s dynamic and ever-evolving business landscape, companies face the challenge of managing diverse product portfolios to meet the changing demands of the market. Product portfolio optimization, a strategic process of selecting and managing an optimal mix of products, is essential for businesses aiming to enhance their market position, profitability, and customer satisfaction [1]. Traditional methods of product portfolio management often fall short in considering the complex interplay of multiple criteria, including profitability, market demand, innovation potential, and strategic alignment. Multi-Criteria Decision Analysis (MCDA) has emerged as a promising solution to address the complexities associated with product portfolio optimization and is a decision-making approach that allows decision-makers to consider multiple criteria simultaneously, providing a systematic and structured way to evaluate and rank alternatives. Companies can effectively assess their existing product mix and identify underperforming products by applying the fuzzy AHP method to determine the weight of each factor, and they can also apply fuzzy TOPSIS to find influential alternatives. This study outlines a series of carefully chosen criteria to make the systematic assessment and selection of types of lead–acid batteries easier. These criteria include performance metrics, cost-efficiency, resource utilization, profitability, and customer demand. Stakeholder preferences, expert opinions, and empirical data are incorporated into the research through the application of MCDA to quantify and prioritize the discovered criteria. Through the construction of a structured framework for decision-making, lead–acid battery products that best meet market demands and strategic objectives can be chosen and optimized.

2. Objective of the Study

Product portfolio optimization is a regular process, as the market is changing every day, and helps us to conduct demand segmentation by categorizing products based on demand patterns; for example, high-demand items might require higher safety stock levels, while slow-moving items might need to be ordered in reduced quantities or even discontinued [2]. It also helps to identify which products have a higher sales frequency or are more profitable. This information assists in setting optimal stocking levels, reducing excess stock for slow-moving products, and ensuring sufficient stock for fast-moving and profitable products [3]. Overall, by integrating product portfolio optimization with inventory control and forecasting, businesses can be streamlined from the perspective of operations, reduce costs, improve customer service, and stay competitive in dynamic markets. The primary aim of this research is to enhance the product portfolio of the Rahimafrooz group by outlining a methodology based on minimizing forecasting errors, optimizing inventory levels, and increasing market share.

3. Literature Review

Numerous studies have been conducted on portfolio optimization, inventory management, and customization. Mass customization is now seen as one of the best ways for companies to gain a competitive edge. Almost all companies try to provide customizable products to attract more customers [1]. The tech giant HP uses regression analysis algorithms for product portfolio and inventory management. Ward et al. [2] showed HP’s product portfolio optimization process through their case study analysis. According to Brasil and Eggers [3], companies manage two primary portfolios, their product portfolio and innovation portfolio. The innovation portfolio indicates the scope, or potential, for developing future products, whereas the strategic decision on innovation comes from the product portfolio and facilitates future innovation efforts. Developing an optimal sustainable and financially stable business structure is the prime goal of this study [4]. Myrodia et al. [5] used a GAMS optimization model, through substitution and standardization techniques, for supporting strategic portfolio optimization decisions. The product portfolio optimization process is implemented worldwide to narrow down a wide variety of products by using different methods. Rahimafrooz is the only organization that is choosing to use multi-criteria analysis to optimize their product portfolio. MCDA is one of the advanced methods for identifying the best alternatives by analyzing multiple influential factors.

4. Methodology

In this study, the following steps are utilized to find out the selection criteria and rank the alternatives for minimizing forecasting error, optimizing inventory management toward overall operations optimization (Figure 1).

4.1. Fuzzy AHP

There are numerous steps to follow to determine the weight of the criteria. The fuzzy AHP method is used when market predictability is comparatively low and involves uncertainty, as depicted in this study. These uncertain data are depicted as a fuzzy area through mathematical procedures [6]. Table 1 represents the linguistic terminology and conversion to the relevant triangular fuzzy scale. Overall, fuzzy AHP procedures are briefly represented as follows [7,8].
Step 1: Collect pairwise comparison data from different decision-makers.
Firstly, collected pairwise comparison data are converted to triangular fuzzy numbers (TFNs) using Table 2, and Cxy is denoted as a TFN associated with the criteria factors x and y. Cxy = (lxy, mxy, uxy).
Step 2: Check the consistency ratio (CR).
The consistency ratio (CR) must be checked by using C R = C I R I , where CI is the consistency index, and RI is the random index [9]. The CI formula is C I = λ m a x n n 1 , where λ m a x   is the maximum eigenvalue, and n is the number of elements in the matrix. The RI list can be found in Table 2.
Prior to checking CR, an average aggregate matrix must be computed by using the following formula:
P L ˇ = L = l 1 + 4 l 2 + l 3 6
Step 3: Determine the addition matrix.
The following formula is used to determine the addition matrix:
y = 1 n C ˇ x y = y = 1 n l x y ,   y = 1 n m x y ,   y = 1 n u x y x = 1,2 , . . . . , n
Step 4: Calculate the aggregate of the fuzzy addition matrix.
The aggregation of the fuzzy addition matrix is as follows:
k = 1 n y = 1 n C ˇ k y = k = 1 n y = 1 n l k y , k = 1 n y = 1 n m k y , k = 1 n y = 1 n u k y ,
Step 5: Find out the fuzzy synthetic parameters.
Sx = (lx, mx, ux) is considered as the fuzzy synthetic parameter and can be derived from the following formula:
S ˇ x = y = 1 n C ˇ x y k = 1 n y = 1 n C ˇ x y 1   x = 1,2 , . . , n
An inverse matrix can be computed from the following formula [10]:
k = 1 n y = 1 n C ˇ k y 1 = 1 k = 1 n y = 1 n u k y , 1 k = 1 n y = 1 n m k y , 1 k = 1 n y = 1 n l k y
Step 6: Find out the degree of possibility and rank the synthetic values.
The degree of possibility Sx (lx, mx, ux) ≥ Sy (ly, my, uy) can be calculated from the following equation:
V S ˇ y S ˇ x = h g t S ˇ x S ˇ y = μ S y d = 1 ,          i f m y m x 0 ,          i f   l x u y a x c y b y c y b x a x ,   o t h e r w i s e
The ranking of the synthetic values is determined by the following formula:
I T α ( S ˇ x ) = 1 2 α m x + n x + 1 2 1 α l x + m x = 1 2 α n x + m x + 1 α l x
Step 7: Calculate the weight of the criteria.
The weight of the criteria can be derived from the following equation:
w x = I T α S ˇ x x = 1 n I T α S ˇ x   x = 1,2 , . , n
where wx is a crisp value.

4.2. Fuzzy TOPSIS

The following steps are used to rank the alternatives via the fuzzy TOPSIS method [6].
Step 1: Convert the fuzzy linguistic terms to fuzzy numbers and construct a fuzzy decision matrix.
Step 2: Normalize the fuzzy decision matrix.
The following formula can be used to normalize the fuzzy decision matrix to avoid any inconsistency or irregularity in the data:
r ˇ i j = l i j C j , m i j C j , u i j C j   f o r   b e n e f i c i a l   c r i t e r i a r ˇ i j = C j u i j , C j m i j , C j l i j ,   f o r   non - beneficial criteria
Here, C j * is the max {cij} for beneficial factors, and C j is the min {cij} for non-beneficial factors.
Step 3: Construct a weighted normalize matrix.
Constructing the weighted normalized matrix follows the direct multiplication of the normalized matrix with weight:
v ˇ i j = r ˇ i j w ˇ j
Step 4: Determine the fuzzy positive ideal solution (FPIS) and fuzzy negative ideal solution (FNIS).
The aspiration level (A+) and worst level (A) can be derived as follows to calculate the FPIS and FNIS:
A+ = ( v 1 , … v j v n ), where v j is the best values of the weighted normalized matrix of the fuzzy set, j = 1, 2,…, n;
A = ( v 1 ,… v j v n ), where v j is the worst values of the weighted normalized matrix of the fuzzy set, j = 1, 2,…, n.
Step 5: Determine the distance from the FPIS and FNIS.
The distances ( d j and d j ) of alternatives from best values (A) and worst values (A) are determined based on the following equation:
d ˇ i = j = 1 n d v ˇ i j , v ˇ j ,   i = 1,2 , . , m ; j = 1,2 , , n
Step 6: Determine the closeness coefficient (CCi).
The formula for the closeness coefficient is as follows:
C ˇ i = d ˇ i d ˇ i + d ˇ i ,   i = 1,2 , . , m
Step 7: Finally, rank among the alternatives.
The highest value is considered the best alternative, and the lowest value is considered the least preferred alternative.

5. Case Study

Case studies and simulations that are grounded in actual industrial scenarios demonstrate the effectiveness of the MCDA-driven approach to product portfolio optimization. In this study, a case study is conducted on RAHIMAFROOZ, which is one of the most renowned and most prominent lead–acid automotive battery manufacturers in Bangladesh. They have more than 1500 types of products across five categories, stated in Table 3, and it is so difficult to manage their inventory of raw materials, works in process, and finished goods, and as such, operation has become complex and unit production costs have increased. This study, using MCDA, simulates and best optimizes how manufacturers can modify and enhance their product offerings to satisfy a range of market demands while adhering to sustainability imperatives, illuminating the complex decision-making process.
Since the lead–acid battery market fluctuates a lot due to high competition and globalization, market survey data also reflect high uncertainty and unpredictability, resulting in a high number of forecasting errors and the holding of large inventory [11]. Four beneficial criteria—market demand (MD), life cycle (LC), resource utilization (RU), and profitability (PF)—and one cost criterion—product cost (PC)—are considered in this study. To minimize error and optimize the inventory level, decision-makers must conduct a deep and extensive survey. For this, the data are collected from four decision-makers through actual market surveys and analyses from the previous years, and the decision-makers come up with an individual pairwise decision matrix and, through using the geomean method, construct an aggregate matrix (Table 4).
Then, the consistency ratio (CR) of the average of the aggregate decision matrix is found to be 0.032, which is acceptable. Finally, the weight of the criteria can be determined using the fuzzy AHP methodology presented in this study, and our results are plotted in Figure 2. In this step of the TOPSIS method, the decision matrix from all four decision-makers is derived according to the linguistic fuzzy terminology in Table 5 and converted into triangular fuzzy numbers (TFNs) using the linguistic fuzzy scales given in Table 5. Then, those are combined, as shown in Table 6. The closeness coefficient (CCi) is calculated using the fuzzy TOPSIS methods described in the “Methodology” section, and the alternatives are ranked in Table 7.

6. Results, Discussion, and Validation

In this analysis, the importance of the criteria was identified using the fuzzy AHP, and consequentially, the ranking of the product alternatives was determined through the fuzzy TOPSIS method based on the degree of satisfaction, denoted as CCi. The desired degree of satisfaction is close to 1.00, indicating the most preferred alternative [12]. Among all the product categories, PACE was ranked as the top-notch product, carrying a CCi value of 0.81 and contributing the most to the business of RAHIMAFROOZ. This product was found to be cost-efficient and has been performing well throughout its life cycle. DRIVE ranked second in the category because of its low cost (PC) and optimum life cycle (LC), followed by RACE, DIESEL, and FLASH. FLASH ranked last, with a CCi value of 0.35, due to its poor performance and susceptibility to failure before its declared end of life.
Subsequently, our extensive analysis was validated by the central planner of RAHIMAFROOZ by collecting actual data for the last three consecutive years (Table 8). Following this validation, it was evident that we had achieved the goal of the study. Throughout the last three years, forecasting error has reduced significantly every year, and the company has also experience inventory reduction to a significant extent compared to the previous years.
Now, an optimum level of inventory is being maintained, contributing a great deal to increasing supply chain surplus. An enormous level of improvement regarding the areas covered in this study enabled the company to expand from being a regional business to a global one. Nowadays, the company serves over 70 countries globally, and it holds a great reputation and prominence [13]. It was also evident, when investigating the sales revenue over last three years, that PACE contributed most (57%) to the whole organization’s sales in 2022, followed by DRIVE and RACE, and its demand is continuing to grow gradually.
The limitations of these particular decision analysis methods include the fact that they rely only on experts’ opinions, which may result biased judgments, imprecise linguistic assessments, etc. Therefore, choosing appropriate experts, collecting more relevant and precise market data, tracking technological advancements, and incorporating other factors into the analysis may reduce the impact of these limitations and bring more precise optimization. Rahimafrooz initiated this investigation by examining a certain component of their product range. There is a huge range of work intending to employ other techniques of Multi-Criteria Decision Analysis (MCDA) considering other several product perspectives, focusing on advanced technology, environmental impact, and economic factors.

7. Conclusions

Strategic methods for product portfolio management are required in the dynamic and competitive corporate landscape. This study’s goals were well defined and included reducing forecasting mistakes, managing inventory levels, and growing market share. The study effectively identified essential criteria, ranked product alternatives, and offered insights into the performance of several lead–acid battery types within Rahimafrooz’s portfolio through the use of MCDA methodologies, notably fuzzy AHP and fuzzy TOPSIS. The discussion and findings demonstrated how well the MCDA-driven strategy worked to accomplish the study’s goals. The results of the investigation showed that the PACE product category was the best-performing category, with minimal opportunity for development and a high level of customer satisfaction. Rahimafrooz’s supply chain management saw notable gains as a result of the methodical implementation of MCDA, which decreased forecasting mistakes and optimized inventory levels. In addition, the validation of the analysis over three years using real data showed observable benefits.
This study offers insightful information about product portfolio optimization and demonstrates an effective application of MCDA in a challenging industrial setting. To successfully traverse the hurdles posed by various product portfolios in changing marketplaces, firms can refer to this study as a reference. This study highlights the significance of educated decision-making and adaptability in achieving sustained growth and success.

Author Contributions

Conceptualization, M.M.R. and G.A.T.; methodology, M.M.R. and G.A.T.; software, M.M.R. and G.A.T.; validation, M.M.R., G.A.T. and G.K.; formal analysis, M.M.R. and G.A.T.; investigation, M.M.R. and G.A.T.; resources, M.M.R., G.A.T. and G.K.; data curation, M.M.R. and G.A.T.; writing—original draft preparation, M.M.R. and G.A.T.; writing—review and editing, G.K.; visualization, M.M.R. and G.A.T.; supervision, G.K.; project administration, G.K. All authors have read and agreed to the published version of the manuscript.

Funding

This research received no external funding.

Institutional Review Board Statement

Not applicable.

Informed Consent Statement

Not applicable.

Data Availability Statement

Data will be made available upon request.

Acknowledgments

The authors would like to express their appreciation for the support they received from the management of RAHIMAFROOZ, Dhaka, Bangladesh, who provided their valuable time and information to this research.

Conflicts of Interest

The authors declare no conflicts of interest.

References

  1. Ramdas, K. Managing product variety: An integrative review and research directions. Prod. Oper. Manag. 2003, 12, 79–101. [Google Scholar] [CrossRef]
  2. Ward, J.; Zhang, B.; Jain, S.; Fry, C.; Olavson, T.; Mishal, H.; Amaral, J.; Beyer, D.; Brecht, A.; Cargille, B.; et al. HP Transforms Product Portfolio Management with Operations Research. INFORMS J. Appl. Anal. 2010, 40, 17–32. [Google Scholar] [CrossRef]
  3. Brasil, V.C.; Eggers, J.P. Product and Innovation Portfolio management. In Oxford Research Encyclopedia of Business and Management; Oxford University Press: Oxford, UK, 2019. [Google Scholar]
  4. Elkamel, A.; Alhumade, H.; Omidbakhsh, N.; Nowruzi, K.; Duever, T. Product Selection and Business Portfolio for Long-Range Financial Stability: Case Study from the Petrochemical Industry; Wiley: Hoboken, NJ, USA, 2022. [Google Scholar] [CrossRef]
  5. Myrodia, A.; Moseley, A.; Hvam, L. Product portfolio optimization based on Substitution. In Proceedings of the 2017 IEEE International Conference on Industrial Engineering and Engineering Management (IEEM), Singapore, 10–13 December 2017. [Google Scholar]
  6. Kabir, G.; Hasin, M.A.A. Framework for benchmarking online retailing performance using fuzzy AHP and TOPSIS method. Int. J. Ind. Eng. Comput. 2012, 3, 561–576. [Google Scholar] [CrossRef]
  7. Zhu, K.-J.; Jing, Y.; Chang, D.-Y. A discussion on Extent Analysis Method and applications of fuzzy AHP. Eur. J. Oper. Res. 1999, 116, 450–456. [Google Scholar] [CrossRef]
  8. Kabir, G.; Sumi, R.S. Integrating Fuzzy Delphi with Fuzzy Analytic Hierarchy Process for Multiple Criteria Inventory Classification. J. Eng. Proj. Prod. Manag. 2013, 3, 22–34. [Google Scholar] [CrossRef]
  9. Kabir, G.; Hasin, M.A.A. Integrating modified Delphi method with fuzzy AHP for optimal power substation location selection. Int. J. Multicriteria Decis. Mak. 2013, 3, 381. [Google Scholar] [CrossRef]
  10. Ansari, M.; Al-Zahrani, F.A.; Pandey, D.; Agrawal, A. A fuzzy TOPSIS based analysis toward selection of effective security requirements engineering approach for trustworthy healthcare software development. BMC Med. Inform. Decis. Mak. 2020, 20, 236. [Google Scholar] [CrossRef] [PubMed]
  11. Shukla, R.K.; Garg, D.; Agarwal, A. An integrated approach of Fuzzy AHP and Fuzzy TOPSIS in modeling supply chain coordination. Prod. Manuf. Res. 2014, 2, 415–437. [Google Scholar] [CrossRef]
  12. Sun, C.-C. A performance evaluation model by integrating fuzzy AHP and fuzzy TOPSIS methods. Expert Syst. Appl. 2010, 37, 7745–7754. [Google Scholar] [CrossRef]
  13. Khan, M.J.A. Battery market gains heat. The Business Post. 2 August 2021. Available online: https://businesspostbd.com/front/2021-08-03/battery-market-gains-heat-22554 (accessed on 15 November 2023).
Figure 1. Flowchart of the methodology used in this study.
Engproc 76 00072 g001
Figure 2. Weight of criteria.
Engproc 76 00072 g002
Table 1. Linguistic terms and relevant fuzzy scales needed for conversion.
Linguistic ParametersFuzzy NumbersTFNs (l,m,u)Reciprocal Fuzzy Scale (1/l,1/m,1/u)
Equal Importance1(1,1,1)(1,1,1)
Weak Importance2(1,2,3)(1/3,1/2,1)
Minor Importance3(2,3,4)(1/4,1/3,1/2)
Medium Importance4(3,4,5)(1/5,1/4,1/3)
Vital Importance5(4,5,6)(1/6,1/5,1/4)
Strong Importance6(5,6,7)(1/7,1/6,1/5)
Very Strong Importance7(6,7,8)(1/8,1/7,1/6)
Severe Importance8(7,8,9)(1/9,1/8,1/7)
Extreme Importance9(9,9,9)(1/9,1/9,1/9)
Table 2. Random index list.
n12345678910
RI000.580.91.121.241.321.411.451.49
Table 3. Product alternatives for Rahimafrooz group according to capacity range.
Product AlternativesRacePaceDieselDriveFlash
Capacity range 101–105%96–100%91–95%86–90%80–85%
Table 4. Aggregate decision matrix derived from four decision-makers.
CriteriaMDLCRUPFPC
MD1.001.001.000.841.412.060.780.901.040.981.221.630.420.560.71
LC0.490.711.191.001.001.000.741.001.350.630.871.150.490.560.71
RU0.961.111.280.741.001.351.001.001.000.761.111.680.430.670.93
PF0.610.821.020.871.151.580.590.901.321.001.001.000.540.901.46
PC1.411.802.381.411.782.061.071.502.340.691.111.861.001.001.00
Table 5. Linguistic variables of TFN codes for fuzzy TOPSIS.
Linguistic VariablesCodeTFN
Very PoorVP013
PoorP135
FairF357
GoodG579
Very GoodVG7910
Table 6. Aggregate decision matrix after converting from linguistic terms to TFNs.
AlternativesMDLCRUPFPC
Race5.07.09.05.57.59.33.55.57.51.03.05.01.53.55.5
Pace7.09.010.06.08.09.57.09.010.05.07.09.05.07.09.0
Diesel3.05.07.03.05.07.01.53.55.51.53.55.52.54.56.5
Drive6.58.59.82.54.56.53.55.57.57.09.010.07.09.010.0
Flash0.01.03.00.01.03.00.31.53.50.52.04.01.03.05.0
Table 7. Closeness coefficient (CCi) and ranking among the products.
Productsd+dCCi = d/(d+ + d)Rank
Race0.350.500.593
Pace0.160.650.811
Diesel0.390.460.544
Drive0.240.610.722
Flash0.590.310.355
Table 8. Validation with actual scenario.
Objectives202020212022
Forecasting error23%13%5%
Inventory reduction9%6%8%
Market shareExpanded globally
Disclaimer/Publisher’s Note: The statements, opinions and data contained in all publications are solely those of the individual author(s) and contributor(s) and not of MDPI and/or the editor(s). MDPI and/or the editor(s) disclaim responsibility for any injury to people or property resulting from any ideas, methods, instructions or products referred to in the content.

