Abstract
This study aims to enhance the effectiveness of the failure mode and effect analysis (FMEA) method. Traditional FMEA, relying solely on the risk priority number (RPN), neglects uncertainties and the ambiguity in decision-makers’ assessments. This oversight, coupled with the disregard for weighted risk criteria (O, S, and D), diminishes FMEA’s precision. To address this, a novel FMEA approach introduces additional criteria (P, E, C, and T) and employs a three-phase methodology: traditional RPN determination, rough set model for rough weight calculation, and rough-TOPSIS for failure mode scoring. By combining the benefits of TOPSIS for decision-making with the power of rough set models for managing ambiguities, this innovative method demonstrates its potential in ambiguous and subjective environments. Application to a reciprocating pump and compressor reveals critical failure modes, with bearing failure and flange leakage being most and least critical for the pump, respectively, and the compressor operating outside the design envelop and coupling failure having the highest and lowest criticality, respectively, for the compressor in the rough-TOPSIS analysis.
1. Introduction
A popular method for locating and removing possible flaws, issues, and errors from systems, designs, and processes is failure mode and effects analysis, or FMEA [1]. Delivering goods or services to clients without flaws is the primary goal of failure mode and effects analysis (FMEA) [2]. Many businesses, including those in the nuclear, automotive, and aerospace industries, use failure mode and effect analysis (FMEA) as a potent tool for assessing the safety and reliability analysis of systems, operations, and product lines [3]. FMEA is another useful tool for offering data to back up decisions about risk management, and its ability to encourage the application of continuous improvement at the product design stage has piqued the interest of many designers as well [4]. Through the use of risk priority numbers (RPNs), FMEA assists designers in clearly understanding the sequence in which equipment or a system fails to perform its intended function, which impacts product reliability, and in prioritizing design improvements. The risk criteria occurrence, severity, and detection—commonly called O, S, and D, respectively—are combined to form an RPN. The most significant risk item is assigned scarce resources based on the RPN of the failure modes [5]. FMEA has shown itself to be one of the most crucial early preventative measures not only in the design phase but also in subsequent phases such as operation and maintenance [1]. Nevertheless, conducting an FMEA process in an actual scenario can be challenging due to lack of relevant data, and the information that is obtained is typically vague and overly biased, but even more so in a fuzzy environment.
It is challenging to calculate risk criteria O, S, and D with accuracy in reality, and there is always a great deal of subjectivity and ambiguity in the evaluation scores. Regrettably, traditional FMEA lacks the necessary approach to handle this problem. Additionally, O, S, and D are frequently assigned equal weight in the traditional FMEA technique, but that is not the case in real-world scenarios. For instance, in reliability analysis, occurrence represents a vital element for the system that cannot be repaired [6]. Even though distinct values of weights are given for the risk criteria O, S, and D, there is no rearrangement of these highly subjective weights in the final phases of the FMEA process. In order to address the bias and uncertainty in FMEA, this work presents a novel technique for doing so, called the technique for order performance by similarity to ideal solution (TOPSIS), which is based on rough set theory. Without requiring a large amount of pre-existing information (such as pre-established membership functions or assumptions), the suggested FMEA approach offers a better, more sensible framework to assess risks. Above all, the method effectively addresses biases in calculating the weights of risk criteria and evaluating failures using rudimentary logic in an uncertain circumstance. As of now, there is no such integrated method or method in the literature which is known.
2. Methodology
Four skilled and experienced mechanical and reliability engineers were approached to form an FMEA team, which was the first step in the process. Following multiple brainstorming sessions, 10 possible failure modes for each of the reciprocating pump and reciprocating compressor were found, as shown in Table 1.

Table 1.
Identified failure modes for reciprocating pump and compressor.
The FMEA team members were each given a questionnaire to complete in order to obtain data from them on the significance of seven risk factors: occurrence (O), severity(S), and detection (D) on a scale of 1 to 10, as well as people’s health and safety (P), environment (E), repair cost (C), and downtime (T) using standard scales. The data gathered from the decision-makers for a reciprocating pump and reciprocating compressor were used to determine the rough weights of criteria for both equipment. Rough-TOPSIS and the traditional method were used to rank the failure modes to establish their priorities. The suggested new technique was compared with the traditional approach to test the efficiency. This MCDM method along with the preliminaries of rough set theory and rough numbers are described in the following sections.
For the traditional method, the RPN is determined through the multiplication of occurrence (O), severity (S), and detection (D). In the suggested technique, the crisp values are transformed to obtain the rough weights, and, finally, TOPSIS is used to rank the failure modes.
2.1. Calculation of the Rough Interval Weights for Risk Criteria
The steps below illustrate how to determine the rough interval weights of the risk factors O, S, D, P, E, C, and T.
- (1)
- The weighted risk factor crisp assessment value is determined as follows:
Here, denotes the kth professional’s opinion on the significance of criterion j, while i denotes the number of experts in the decision team.
- (2)
- Next, the crisp values are translated into rough numerical concepts. The following is how to generate in rough interval form:
Here, represent lower and upper limits of the rough number RN (. The calculation of the rough weight of criterion j, RN (), are given as:
where j = S, O, D, P, E, C, and T. denote lower and upper limits of the rough weight respectively.
2.2. Rough-TOPSIS Technique for Analyzing Failure Modes
This part suggests a structured FMEA procedure based on rough-TOPSIS after the risk factor weights have been determined with the rough method [7].
- (1)
- Create a clear matrix for analyzing failure modes
The chosen decision-makers assess the failure mode ratings in relation to the criteria (j = O, S, D, P, E, C, and T) using standard scores. The scoring of failure modes is represented as follows in the assessment matrix D, presuming that an FMEA group is composed of i decision-makers making decisions.
Here, k = 1, 2, …,i, (I = 1,2, … n) is a decision-maker’s failure impact rating with respect to a criterion j.
- (2)
- Transform the crisp element in the group decision matrix into a rough numerical form to obtain the rough number form RN( of :
Here, denote lower and upper bounds of a rough number RN (), respectively.
Therefore, a rough sequence RN ( can be expressed as:
The rough calculation principle is applied to determine the average rough interval
where denote lower and upper bounds of a rough number .
The rough decision matrix denoted R is determined using the following:
- (3)
- Evaluate, in rough numerical form, the weighted normalized decision matrix. Using the normalization method, the different criteria scales are converted into a scale that could be compared as shown below:
shows lower and upper bounds of the interval in the normalized concept .
The above-discussed normalization technique maintains the characteristic that the normalized interval numbers’ ranges fall within [0, 1]. Next, use the following formula to obtain the weighted normalized rough matrix.
Note that I = 1,2,…,m; j = S, O, D, P, E, C, and D in Equations (12) and (13) above.
In addition, and denote lower and upper bounds of risk factor weights in the rough number concept, correspondingly.
- (4)
- The next step is to determine the positive ideal solution (PIS) and negative ideal solution (NIS) using the expressions below:
Here, and represent the positive ideal solution (PIS) and negative ideal solution (NIS) numbers with respect to the j criteria. In addition, B and C represent the benefit and cost criteria in that order.
- (5)
- The n-criteria can be used to determine how far apart every failure mode is from the positive ideal solution by applying n-dimensional Euclidean distance.
Here, i = 1, 2, 3,…,m; j = S, O, D, P, E, C, and T.
In the same vein, the distance apart of each failure mode from the NIS can be determined as follows:
Here, i = 1, 2, 3,…,m; j = S, O, D, P, E, C, and T.
- (6)
- After each failure mode’s and have been computed, a closeness coefficient equation is applied to establish the order in which each failure mode is ranked. According to the criteria (S, O, D, P, E, C, and T), the closeness coefficient of the failure modes is expressed as:
3. Results and Model Comparison
The case study applies the traditional FMEA and rough-TOPSIS techniques of multi-criterion decision-making to highlight the qualities of the suggested approaches, as shown in Table 2 for a reciprocating pump and Table 3 for a reciprocating compressor.
Table 2.
Traditional FMEA and rough-TOPSIS result for reciprocating pump.
Table 3.
Traditional method and rough-TOPSIS result for reciprocating compressor.
For both pieces of critical equipment, the rough FMEA’s criteria weights for severity (S), occurrence (O), detection (D), people (P), environment (E), repair cost (C), and downtime (T) are different, as shown in Figure 1 and Figure 2. The figures also display the decision-makers’ opinion distribution as a bar graph. The degree of uncertainty among the decision-makers is represented by the length of the bar. A shorter length of the spread represents increasing accuracy of the decision-makers’ opinions [8].
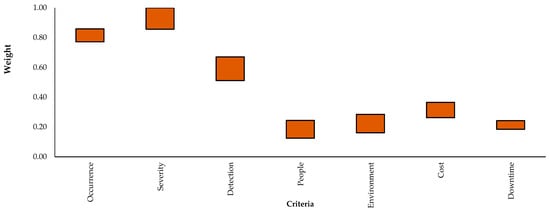
Figure 1.
Weight criteria for reciprocating pump.
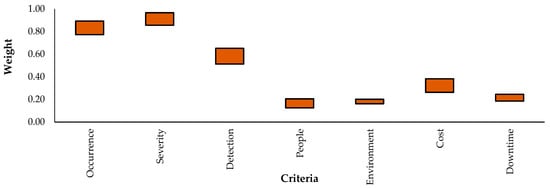
Figure 2.
Weight criteria for reciprocating compressor.
From the results shown in Table 2 and Table 3 and Figure 3 and Figure 4, it is observed the rankings of the traditional technique are very far apart from those of the suggested technique. For example, in Table 2 and Figure 3, FM4 (bearing failure), which ranked first in the suggested method, was ranked seventh in the traditional method, and FM10 (flange leakage), which ranked last in the suggested technique, was the most critical failure mode in the traditional method for a reciprocating pump. A variety of factors contributed to the disparity. A drawback of classic FMEA is that it uses the weighted mean approach to combine the evaluation values, which is flawed in real-world applications because it ignores the biasness of decision-makers and the uncertainty of evaluation data [9]. When dealing with subjective and ambiguous data, the suggested methods circumvent this by employing rough numbers, which could also aggregate various assessment values. The conventional technique, which does not take into account flawed data while making decisions, calculates the failure risk using precise figures.
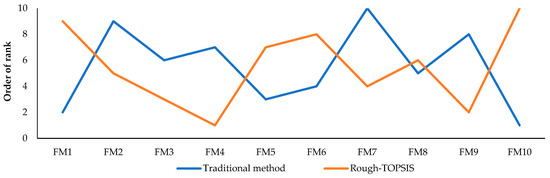
Figure 3.
Failure modes ranking for traditional method and rough-TOPSIS for pump.
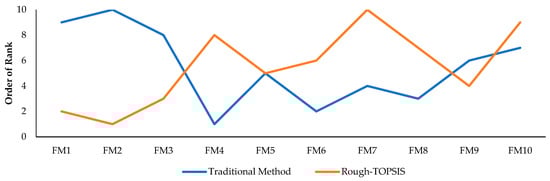
Figure 4.
Compressor ranking of failure modes by rough-TOPSIS and traditional method.
The following are several advantages of rough-number-based FMEA over other techniques [2,9].
First, unlike classic FMEA, the suggested rough FMEA takes into account the biasness and ambiguity of risk criterion weights. The rough weight determination technique has advantages over other methods because it can accommodate the biased and imprecise perceptions of the decision-makers, hence preventing the weights of risk criteria from being exaggerated or underrated.
Secondly, the suggested rough FMEA requires less prior knowledge. This functionality would make it easier to apply the suggested strategy in a sector where it is difficult to find a large amount of failure data. Again, due to its lower boundary interval that indicates ambiguity and uncertainty, the suggested rough FMEA is more accurate than other FMEA techniques. The assessment of the failure modes becomes more precise if the boundary interval is smaller. Finally, although standard FMEA may be factually inaccurate, the suggested rough FMEA resolves the issue of non-continuous risk priority numbers with gaps scaling from 1 to 1000. The traditional method only considers three risk criteria, while the suggested approach is capable of analyzing more risk criteria such as impacts on people (P) to assess the potential impact of each failure mode on people’s health and safety combined.
4. Conclusions
The prospect of creating a unique FMEA method based on rough set theory is investigated in this work. In order to determine the risk priority of failure modes in ambiguous and subjective contexts, the suggested method uses rough-TOPSIS. The suggested FMEA’s viability as a risk rating tool in an unpredictable environment is demonstrated by its confirmation in a mechanical system (reciprocating compressor and reciprocating pump). The suggested approach combines TOPSIS’s evaluation frameworks with rough set theory’s ability to handle ambiguity to provide a flexible model for multi-criterion decision-making. In summary, the rough FMEA technique displays the following characteristics.
Because the suggested FMEA method uses a reforming and adaptive rough interval to transform biasness in the risk factor weight determination process, the rough modelling process may yield more acceptable and accurate risk factor weights. The suggested FMEA, which is based on rough-TOPSIS, could help with the implementation of the FMEA process and assess the failure modes without requiring a large amount of prior knowledge, such as the pre-arranged membership functions applied in fuzzy techniques. The suggested failure effect analysis model indicates that adaptable rough interval bounds might reflect the personal assessment and choice of the decision-maker in a flexible and general manner, thereby reducing risk of data loss during the FMEA exercise by guaranteeing the correctness of the prioritized FMEA results produced. The suggested FMEA, which incorporates the rough-TOPSIS framework, proves to be compatible with a wide range of risk factors, not just the conventional three of O, S, and D. Notwithstanding its many benefits, the suggested FMEA has many drawbacks when it comes to industry use.
Firstly, the actual group of FMEA practitioners frequently lacks the requisite knowledge of rough set theory, which may be necessary. In addition, there is less consideration given to the weights of risk criteria and the interrelations between different failure mode types in the suggested rough-TOPSIS FMEA.
Thus, in order to address the issue of experts’ lack of adequate knowledge in rough set theory, computer-aided devices will be established in a future study. Additionally, the integration of a rough-based group analytic network process (ANP) in conjunction with the suggested FMEA techniques would address the interrelations challenge among different types of failure modes and the weights of risk criteria (Song et al., 2013). Finally, in order to achieve quality in this research, more validation is essential. In a future study, introducing a software program that can generate the rough numbers when dealing with large volumes of data would be advisable.
Author Contributions
Conceptualization, J.A. and G.K.; methodology, J.A.; software, J.A.; validation, J.A. and G.K.; formal analysis, J.A.; investigation, J.A.; resources, J.A. and G.K.; data curation, J.A.; writing—original draft preparation, J.A.; writing—review and editing, G.K.; visualization, J.A.; supervision, G.K.; project administration, G.K. All authors have read and agreed to the published version of the manuscript.
Funding
This research received no external funding.
Institutional Review Board Statement
Not applicable.
Informed Consent Statement
Not applicable.
Data Availability Statement
Data will be available upon request.
Conflicts of Interest
The authors declare no conflict of interest.
References
- Stamatis, D.H. Failure Mode and Effect Analysis: FMEA from Theory to Execution; ASQC Quality Press: Milwaukee, WI, USA, 2003. [Google Scholar]
- Song, W.; Ming, X.; Wu, Z.; Zhu, B. A rough TOPSIS Approach for Failure Mode and Effects Analysis in Uncertain Environments. Qual. Reliab. Eng. Int. 2013, 30, 473–486. [Google Scholar] [CrossRef]
- Sharma, R.K.; Kumar, D.; Kumar, P. Modeling system behavior for risk and reliability analysis using KBARM. Qual. Reliab. Eng. Int. 2007, 23, 973–998. [Google Scholar] [CrossRef]
- Franceschini, F.; Rossetto, S. QFD: The problem of comparing technical/engineering design requirements. Res. Eng. Des. 1995, 7, 270–278. [Google Scholar] [CrossRef]
- Chang, C.; Wei, C.; Lee, Y. Failure mode and effects analysis using fuzzy method and grey theory. Kybernetes 1999, 28, 1072–1080. [Google Scholar] [CrossRef]
- Seyedhosseini, S.M.; Safaei, N.; Asgharpour, M.J. Reprioritization of failures in a system failure mode and effects analysis by decision making trial and evaluation laboratory technique. Reliab. Eng. Syst. Saf. 2006, 91, 872–881. [Google Scholar] [CrossRef]
- Ahmad, S.; Khan, J.; Khan, Z.A.; Asjad, M. A comparative assessment of Conventional and Rough-Based Multi-Criteria methods for failure mode and effects analysis of Root canal treatment. Decis. Anal. J. 2023, 6, 100170. [Google Scholar] [CrossRef]
- Sambasivam, V.P.; Thiyagarajan, G.; Kabir, G.; Ali, S.M.; Khan, S.A.R.; Yu, Z. Selection of Winter Season Crop Pattern for Environmental-Friendly Agricultural Practices in India. Sustainability 2020, 12, 4562. [Google Scholar] [CrossRef]
- Ali, S.M.; Hoq, S.N.; Bari, A.M.; Kabir, G.; Paul, S.K. Evaluating factors contributing to the failure of information system in the banking industry. PLoS ONE 2022, 17, e0265674. [Google Scholar] [CrossRef] [PubMed]
Disclaimer/Publisher’s Note: The statements, opinions and data contained in all publications are solely those of the individual author(s) and contributor(s) and not of MDPI and/or the editor(s). MDPI and/or the editor(s) disclaim responsibility for any injury to people or property resulting from any ideas, methods, instructions or products referred to in the content. |
© 2024 by the authors. Licensee MDPI, Basel, Switzerland. This article is an open access article distributed under the terms and conditions of the Creative Commons Attribution (CC BY) license (https://creativecommons.org/licenses/by/4.0/).