1. Introduction
China, as a leading global exporter, plays a pivotal role in the international market with its diverse exports, ranging from high-tech to consumer goods. These exports are crucial not just for China’s economic growth but also for shaping global trade and supply chains. However, market instabilities, especially post-pandemic, have exposed Chinese exports to various risks, affecting their global competitiveness. In 2022, China’s export value reached USD 3.59214 trillion, a 7% increase from the previous year, with a significant contribution from private enterprises, vital for job creation and social stability [
1]. To foster foreign trade and attract investments, China has implemented policies like export tax rebates, special economic zones, and financial support [
2]. While commonly perceived as price-competitive, Chinese products are increasingly recognized for their quality, brand, and innovation. However, excessive competitiveness can lead to dumping allegations, prompting affected countries to enforce anti-dumping duties [
3]. This study aims to dissect the factors affecting the competitiveness of Chinese goods in the international market, employing ISM and MICMAC analyses to categorize risks and explore strategies to sustain competitiveness amidst global market challenges. The purpose of this study is to look into the future development trends of China’s exports and analyze the factors that may affect export competitiveness. This research addresses potential export risks, their interrelationships, and the resilience of Chinese products in the competitive international landscape.
2. Literature Review
For Chinese manufacturers looking to export their products on the international level, there are certain risks and challenges associated in doing so. In general, there is a strong correlation between the mean and variance of quality growth, which ultimately is determined by a country’s financial depth [
4]. China is known as one of the largest economies in the world, rivaling the United States, with a roughly 35% global market share for consumer goods [
5]. As such, there are a growing number of Chinese exporters that join the international trade market each year, and that number continues to increase [
6]. Apart from direct risks in exporting goods on the international level (raw material availability, manpower availability, cost increases, etc.), Chinese manufacturers face indirect risks as well, such as relying on third-party shipping outfits to distribute products around the world, existing supply chain networks, and socio-economic uncertainties in many regions. It is very difficult for all consumer goods exporters to properly quantify and qualify all risks associated with exporting operations; however, there are tools and techniques available in the multi-criteria decision analysis (MCDA) field that can be utilized to compare and quantify differences in each risk factor or risk category. The ISM method, in the field of MCDA, is well suited to this kind of problem, where it can take a complex system (risk factors in our case) and present it in an easily understood manner [
7]. The researchers will define the risk factors used in this study prior to introducing the ISM methodology.
3. ISM Methodology
Interpretive Structural Modeling (ISM) is defined as “a procedure for developing an interconnection matrix of two known digraphs to form a digraph” [
7]. The basis of this technique is to form a structural self-interaction matrix (SSIM) to initially understand the relationship between the variables under consideration. Once this is established, the technique uses different sub-techniques to ultimately rank the variables in terms of level—1 through 5 typically, with 1 being lower and 5 being higher. The steps for this technique typically can be summarized as follows:
(1) Define elements: identify and define the elements in the system.
(2) Determine relationships: determine the relationship between the elements in the system.
(3) Construct an adjacency matrix based on the relationship between elements (O represents no influence, X represents mutual influence, V and A represent unilateral influence).
(4) Detect and analyze the matrix. Check and analyze the adjacency matrix to ensure that all relationships are correctly represented.
(5) Convert to reachability matrix. If A in the adjacency matrix indirectly affects B, A will still be used for recording.
(6) Hierarchical analysis: stratify elements according to the reachability matrix.
(7) Create a model: create an ISM model based on hierarchical analysis results.
(8) Model verification and modification: share the model with experts and relevant practitioners, collect feedback, and perform necessary verification and modification based on the feedback.
3.1. ISM Analysis
Stage 1: Identify Risk Factors
Through an investigation and discussion, the researchers identified nine risk factors (
Table 1) that Chinese goods may face in the international market.
Stage 2: Structural Self-interaction Matrix
Through mutual discussions among researchers and based on consensus, the structural self-interaction matrix was finally determined (
Table 2).
Stage 3: Reachability Matrix
The structural self-interaction matrix has been converted into a reachability matrix showing binary relationships (
Table 3).
Stage 4: Transitivity Matrix
Table 4 shows the transitivity matrix after checking all the transitivity relationships. The new relationship is highlighted with “*”.
Stage 5: Relationship Diagram
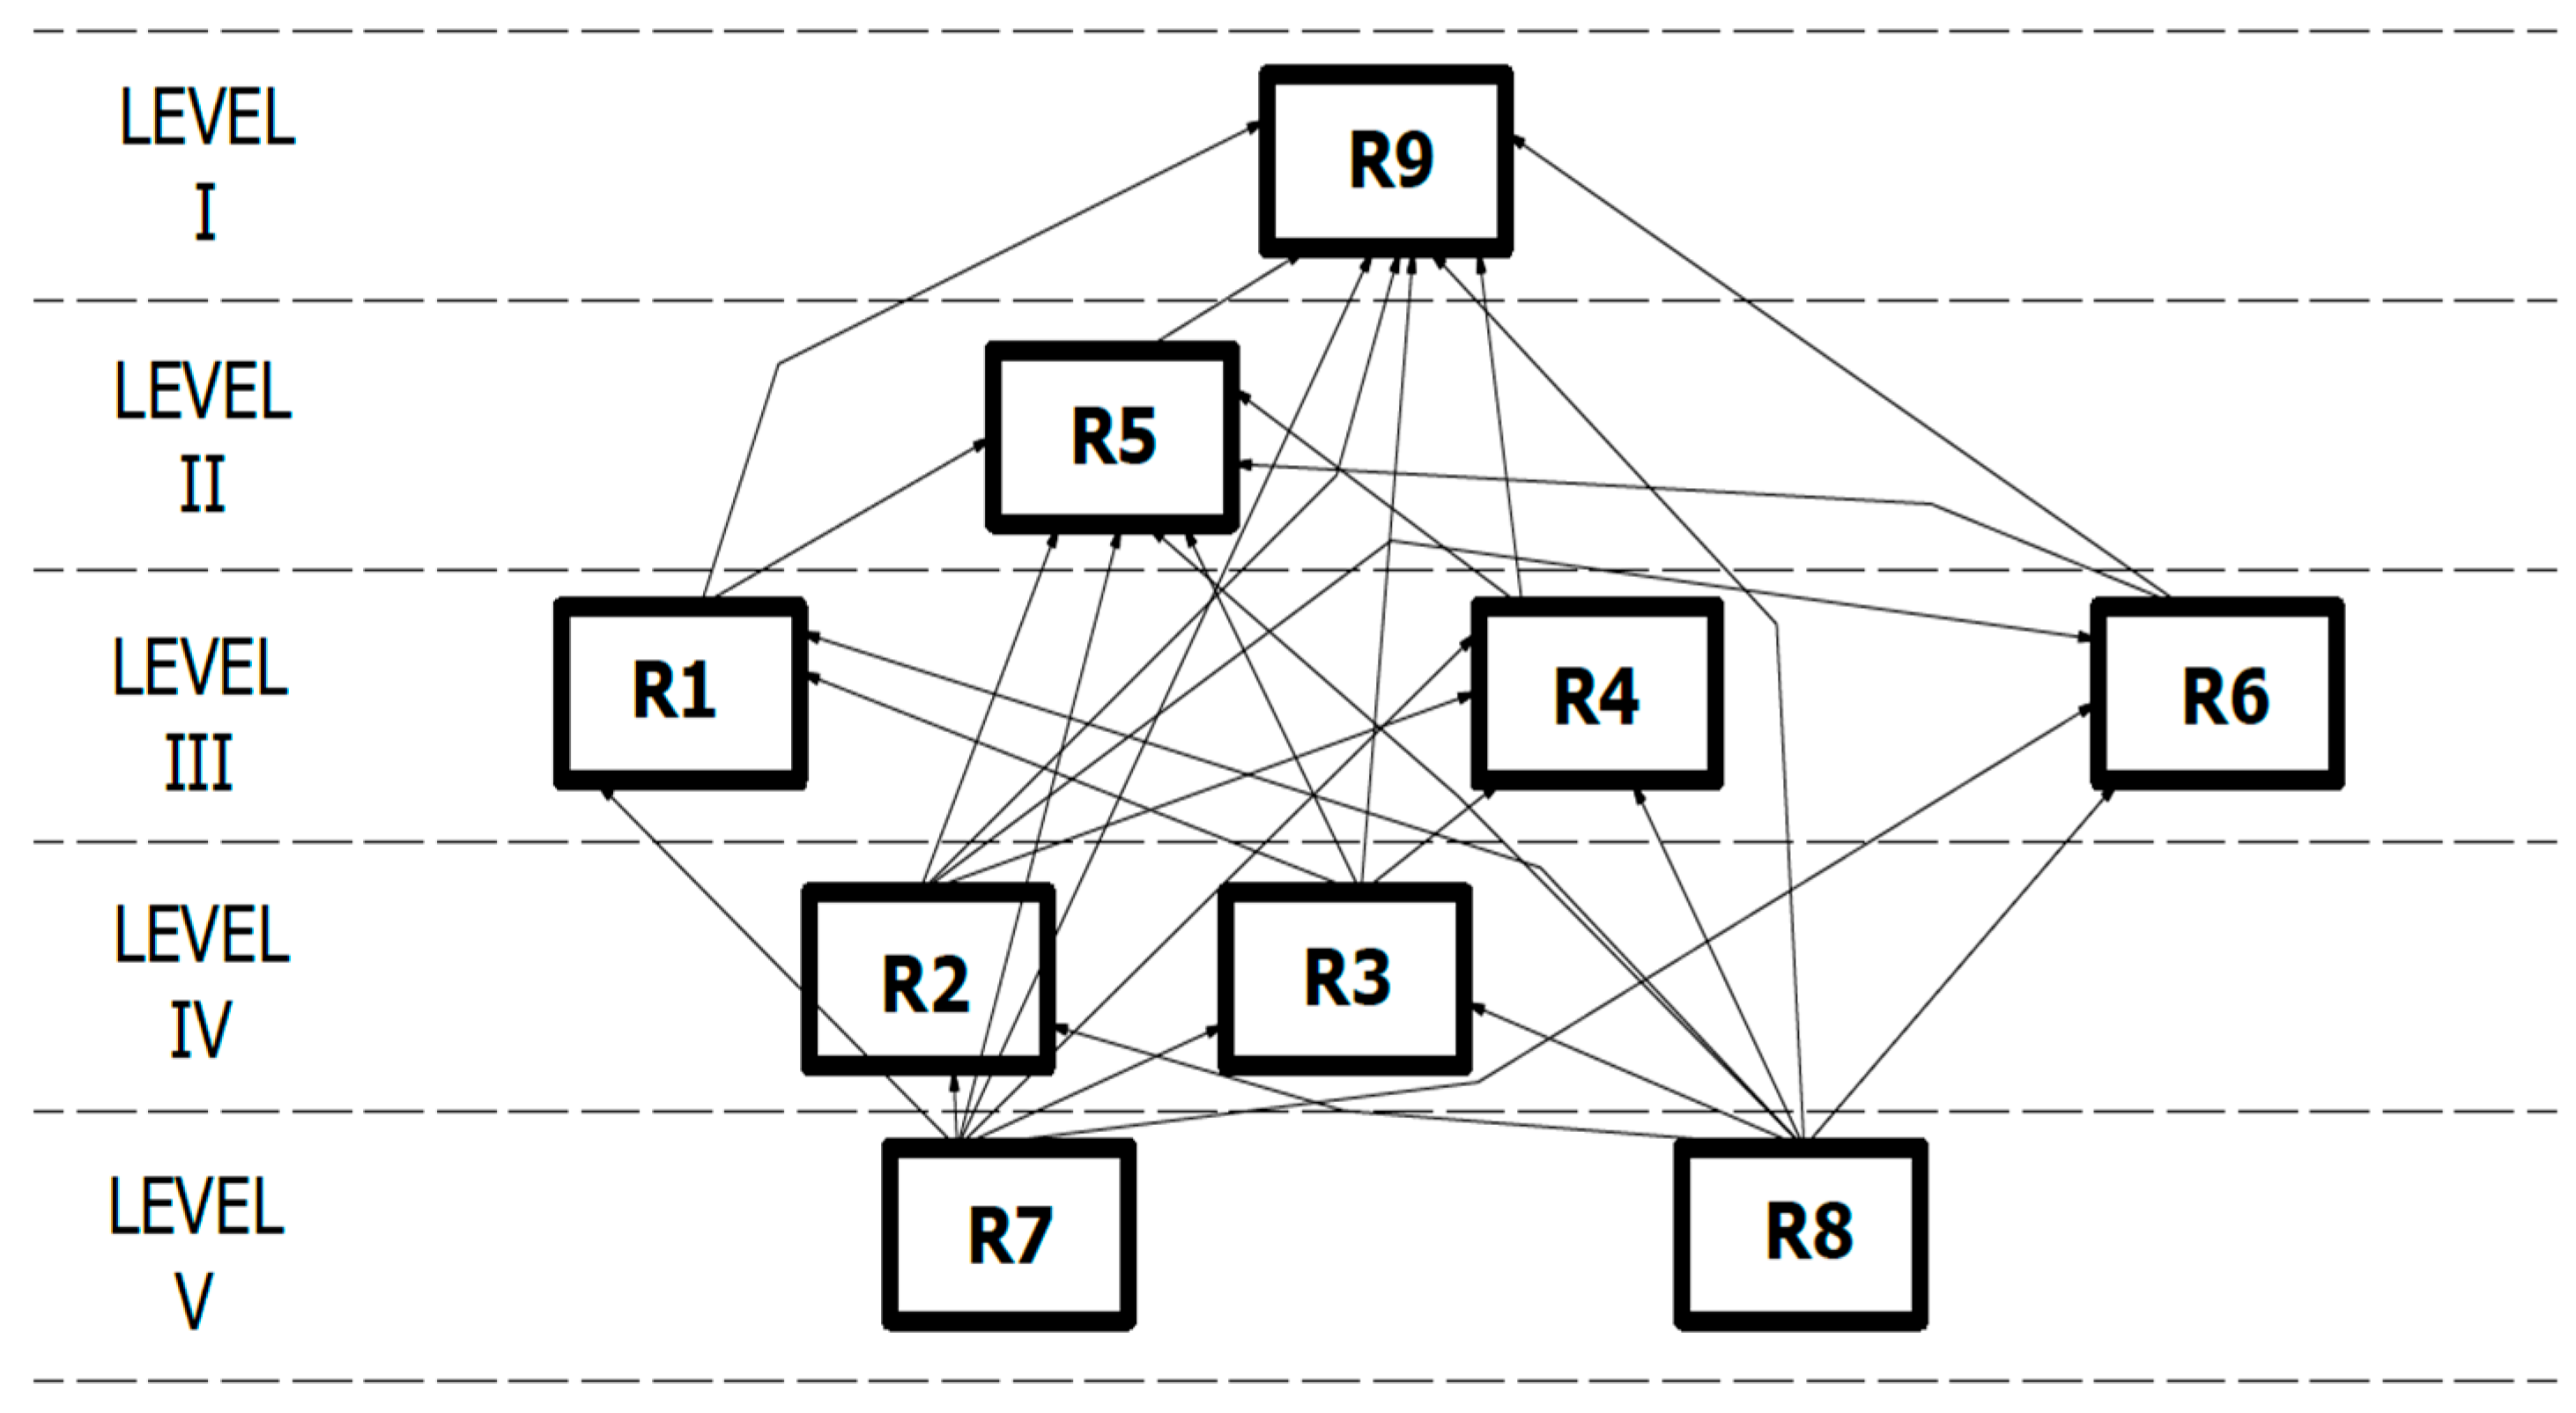
Table 5 and
Figure 1 present the reachability, antecedent, intersection sets, and different levers of the market risk ISM model of Chinese commodities. Nodes and edges are used to describe the relationships between all risk factors.
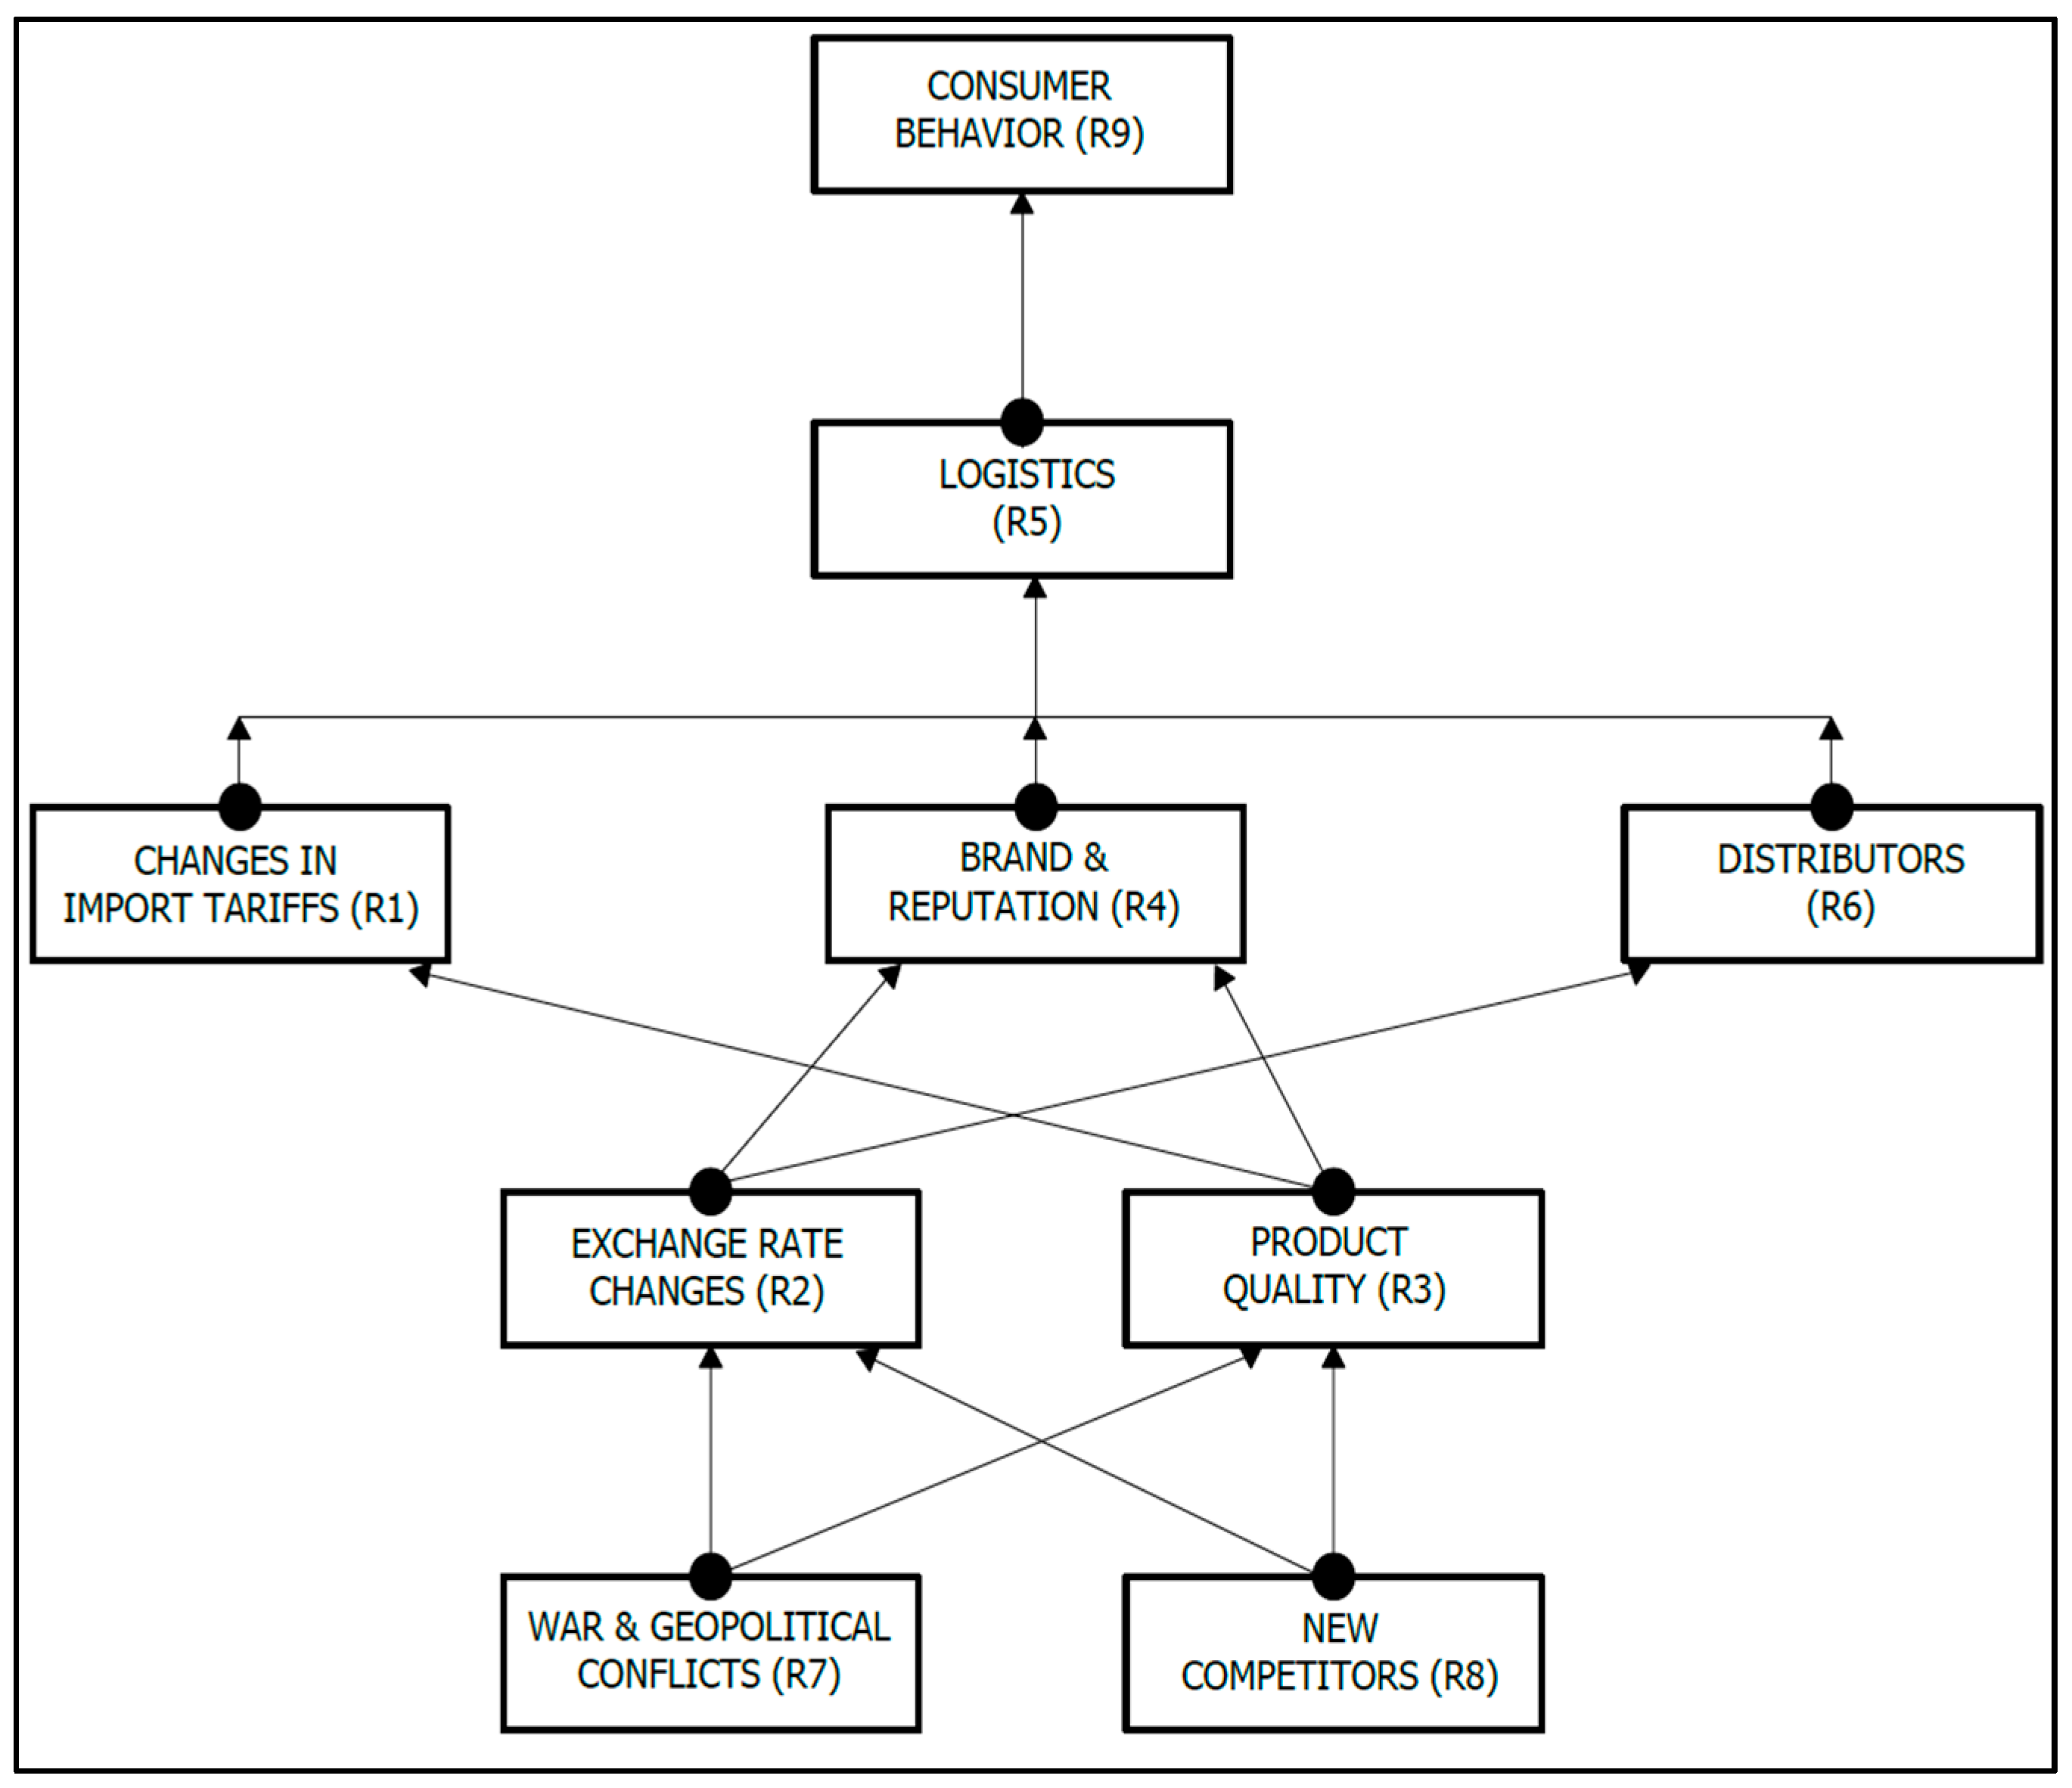
Stage 6: ISM Model (Proposed)
Based on the relationship diagram seen above, the ISM relationship diagram is developed and is shown in
Figure 2.
3.2. MICMAC Analysis
Once the ISM analysis is completed, the next step is to complete a MICMAC (Impact Matrix Cross-Reference Multiplication Applied to a Classification) analysis to compute the driving and dependence power factors for each risk variable (
Figure 3). A MICMAC analysis involves the development of a graph that classifies factors based on driving power and dependence power [
11]. The MICMAC analysis follows the development of the ISM analysis as it allows the researcher to systematically classify certain variables under consideration and to ultimately aid in decision making.
The four categories consisting of a MICMAC analysis include Quadrant A (Autonomous Variables), Quadrant B (Dependent Variables), Quadrant C (Linkage Variables), and Quadrant D (Independent Variables) shown in
Figure 3 below. Quadrant A consisted of one (1) risk factor that had low dependence and driving power—Exchange Rate Changes (R2). Quadrant B consisted of two (2) risk factors that had high dependence power and low driving power—Logistics (R5) and Consumer Behavior (R9). Quadrant C consisted of three (3) risk factors that had high driving and dependence powers—Changes in Import Tariffs (R1), Brand and Reputation (R4), and Distributors (R6). Lastly, Quadrant D consisted of three (3) risk factors that had low dependence power and high driving power—Product Quality (R3), War and Geopolitical Conflicts (R7), and New Competitors (R8).
4. Findings and Discussions
The ISM analysis reveals varying levels of risks for Chinese goods in international markets. High-level risks include war and geopolitical conflicts (R7), as well as the emergence of new competitors (R8). These factors, especially R8, can significantly influence other risk factors due to their strong driving force and potential to reshape market resources. Although war (R7) has a profound impact, it is less likely and challenging to mitigate.
Medium-level risks involve exchange rate fluctuations (R2) and product quality (R3). Sharp exchange rate changes can erode profits and affect the competitiveness of goods, while product quality is central to maintaining a strong market position. Lower-level risks include tariffs (R1), brand reputation (R4), and distributor relationships (R6). These can influence sales and profit margins but are generally more controllable. Tariff changes, while impactful, can be managed through strategic trade practices. Maintaining product quality and strong distributor partnerships can mitigate risks associated with brand reputation and distribution channels. Consumer behavior (R9), though rated lowest in terms of risk, has the highest dependency. Purchasing decisions are influenced by multiple factors, but individual consumer choices are less likely to trigger other risks due to their limited market impact.
5. Conclusions
This study aimed to identify potential risks for Chinese exporters in the global consumer goods market, accounting for about thirty-three percent of the market. The research used Interpretive Structural Modeling (ISM) and the Impact Matrix Cross-Reference Multiplication Applied to a Classification (MICMAC) to analyze risk factors. It pinpointed War and Geopolitical Conflicts and New Competitors as the highest risks, with the latter deemed more prevalent. Conversely, Consumer Behavior was found to be the lowest risk due to its high dependency on rapidly changing factors. Exchange Rate Changes and Product Quality emerged as significant yet partly controllable risks. This study faced limitations, such as the lack of current global economic data and specifics on the number of Chinese exporters. The results of this study may be affected by industry specificity and regional locality, and certain risk factors may have different impact levels in different industries or regions, which may limit the generalizability and applicability of the study results. Despite this, the findings offer valuable insights for Chinese manufacturers considering the global consumer goods market, allowing them to proactively understand and manage associated risks.
Author Contributions
Conceptualization, D.W. and D.U.; methodology, D.W. and D.U.; software, D.W. and D.U.; validation, D.W., D.U., and G.K.; formal analysis, D.W. and D.U.; investigation, D.W. and D.U.; resources, D.W., D.U., and G.K.; data curation, D.W. and D.U.; writing—original draft preparation, D.W. and D.U.; writing—review and editing, G.K.; visualization, D.W. and D.U.; supervision, G.K.; project administration, G.K. All authors have read and agreed to the published version of the manuscript.
Funding
This research received no external funding.
Institutional Review Board Statement
Not applicable.
Informed Consent Statement
Not applicable.
Data Availability Statement
Data will be available upon request.
Acknowledgments
The authors would like to acknowledge the decision makers for their invaluable contributions to this research.
Conflicts of Interest
The authors declare no conflicts of interest.
References
- General Administration of Customs of China. China’s Goods Export Statistics; People’s Republic of China Ministry of Commerce: Beijing, China, 2023. Available online: http://data.mofcom.gov.cn/hwmy/imexmonth.shtml (accessed on 12 December 2023).
- China Government Network. @Foreign Trade Enterprises, These Policies and Measures Can Help You Stabilize Orders and Expand Markets! China Government Network: Beijing, China. 2023. Available online: https://www.gov.cn/zhengce/2023-04/26/content_5753218.html (accessed on 23 October 2023).
- CFI Team. What Is Dumping? 2023. Available online: https://corporatefinanceinstitute.com/resources/economics/dumping/ (accessed on 15 October 2023).
- Krishna, P.; Levchenko, A.; Maloney, W. Growth and Risk: A View from International Trade; The World Bank: Washington, DC, USA, 2020. [Google Scholar]
- China Quarterly Trade Data. Available online: https://wits.worldbank.org/CountrySnapshot/en/CHN/textview#:~:text=China%20Consumer%20goods%20exports%20are,%2C%20product%20share%20of%2045.26%25 (accessed on 16 November 2023).
- Manova, K.; Zhang, Z. China’s Exporters and Importers: Firms, Products and Trade Partners; Working Paper 15249; National Bureau Of Economic Research: Cambridge, MA, USA, 2009. [Google Scholar] [CrossRef]
- Sushil. Interpreting the interpretive structural model. Glob. J. Flex. Syst. Manag. 2012, 13, 87–106. [Google Scholar] [CrossRef]
- Tankersley, J. Trump Hits China With Tariffs on $200 Billion in Goods, Escalating Trade War; New York Times: New York, NY, USA, 2018; Available online: https://www.nytimes.com/2018/09/17/us/politics/trump-china-tariffs-trade.html (accessed on 12 September 2023).
- Baertlein, L. US Supply Chain Woes Shift and Persist in 2023; Reuters: London, UK, 2023; Available online: https://www.reuters.com/business/retail-consumer/reuters-events-us-supply-chain-woes-shift-persist-2023-2023-05-17/ (accessed on 23 October 2023).
- New York Times. Germany Posts Monthly Trade Deficit for First Time in 30 Years; New York Times: New York, NY, USA, 2022; Available online: https://www.nytimes.com/2022/07/04/business/germany-trade-deficit-exports-imports.html (accessed on 12 September 2023).
- Romel, M.; Kabir, G.; Ng, K.T.W. Analysis of barriers to photovoltaic waste management to achieve net-zero goal of Canada. Environ. Sci. Pollut. Res. 2023, 30, 85772–85791. [Google Scholar] [CrossRef] [PubMed]
| Disclaimer/Publisher’s Note: The statements, opinions and data contained in all publications are solely those of the individual author(s) and contributor(s) and not of MDPI and/or the editor(s). MDPI and/or the editor(s) disclaim responsibility for any injury to people or property resulting from any ideas, methods, instructions or products referred to in the content. |
© 2024 by the authors. Licensee MDPI, Basel, Switzerland. This article is an open access article distributed under the terms and conditions of the Creative Commons Attribution (CC BY) license (https://creativecommons.org/licenses/by/4.0/).


