Proceeding Paper

Influence of Marble Dust on Mechanical and Tribological Properties of Injection Molded Polypropylene Composites †

1
Department of Mechanical Engineering, Malaviya National Institute of Technology, Jaipur 302017, India
2
School of Engineering, University of Lincoln, Brayford Pool, Lincoln LN6 7TS, UK
3
Centre for Research Impact & Outcome, Chitkara University Institute of Engineering and Technology, Chitkara University, Rajpura 140401, India
4
School of Mechanical Engineering, Shandong University of Technology, Zibo 255049, China
5
University Centre for Research and Development, Chandigarh University, Mohali 140413, India
6
Clean Energy Technologies Research Institute (CETRI), Process Systems Engineering, Faculty of Engineering and Applied Science, University of Regina, 3737 Wascana Parkway, Regina, SK S4S 0A2, Canada
*
Authors to whom correspondence should be addressed.
Presented at the 1st International Conference on Industrial, Manufacturing, and Process Engineering (ICIMP-2024), Regina, Canada, 27–29 June 2024.
Eng. Proc. 2024, 76(1), 110; https://doi.org/10.3390/engproc2024076110
Published: 12 June 2025

Abstract

This study explores the use of Polypropylene (PP) as a cost-effective matrix in composite materials, employing marble dust (MD) as a readily available filler. PP’s affordability and suitable strength make it ideal for various applications. MD, composed of CaCO3, alumina, and silica, enhances mechanical strength and is commonly used in construction applications like concrete. Composite specimens were fabricated using the injection molding technique, and their mechanical properties (tensile, flexural, and compressive strength) were analyzed following ASTM standards. Tribological properties were assessed through a pin-on-disc apparatus with varying MD proportions. SEM and EDS analyses visually inspected the fracture types and filler distribution in the composites.

1. Introduction

Materials and properties are critical when designing any machine component or application. So, previously, there was a single option of using a conventional material. These materials show excellent mechanical or tribological properties but are too expensive. Therefore, switching to a material that is easy to manufacture, is economical, can be used for mass production, and satisfies all the properties is necessary. For this purpose, composite materials are used and are now mass-manufactured for different applications.
Flax fiber and PP matrix semi-consolidated thermoplastic strips were the subjects of an investigation by Akonda et al. in 2020 [1]. The strength of these semi-consolidated strips is higher than that of the yarn-based composite materials. It might be because the composite samples have a lower porosity and superior impregnation [1]. In 2020, Azammi et al. conducted experiments with kenaf fiber samples and thermoplastic polyurethane. Various ratios of thermoplastic resin (natural rubber) produced favorable adhesion results. To improve the mechanical qualities of the composite materials, they additionally treated the fiber with a 6% solution of sodium hydroxide [2]. In their 2021 study, Siva and Valarmathi et al. employed PLA granules, nano Cissius Quadrangularis, and Cissius Quadrangularis as the fiber to create composite samples using injection molding. The nanofibers filled every empty space. The voids lessen the cavity in the composite samples [3]. In 2021, Mohammed et al. created hybrids with flax as the fiber and expanding polystyrene as the matrix. The goal was to use analytical, numerical, and experimental approaches to determine the typical frequency of composite specimens. The experimental approach was designed to maintain composite specimens in a cantilever configuration. At the final point of the sample was an accelerometer. The vibration output was therefore measured. The findings demonstrated that the modulus of a material affects the natural frequency [4]. In 2021, Siva and Sundar Reddy Nemali et al. created composite samples with a hemp fiber serving as reinforcement and virgin e-PLA serving as the matrix. They used extruded injection molding and injection molding techniques to create two kinds of samples. The latter technique resulted in a stronger matrix–fiber connection. Because of the Twin Extruder’s high-intensity mixing, the amount of void material decreased [5]. In 2019, Szostak et al. employed hemp and flax as reinforcement and polyethylene as the matrix. They used varying amounts of various flame retardants, including melamine, graphite, and halloysite. Thus, a fire test was conducted to evaluate the efficacy of the flame retardants. The samples that contained flame retardants burned at the lowest rate and took the shortest amount of time to reach the markers, which were 25 mm and 100 mm [6]. In 2020, Chegdani et al. used injection molding to create composites of flax fiber and PP. When cutting the composites, they saw that they behaved in an elastoplastic manner. They used the Iosipescu shear test to test the samples and validate the Merchant model. The fiber exhibited maximum stiffness at 45°, while it exhibited ductile behavior when orientated perpendicular to the shearing direction [7]. Van Vuure et al., 2021 [8], experimented with the twill weave silk fiber. Their experiment found that a PBS matrix composite had good mechanical properties compared to MA-g-PP samples [8]. Christu Paul et al., 2020 [9], fabricated PP composites with Areca fillers using the injection molding process. Also, MA was added as compatibilizers. It was found that 5 wt% of areca fiber gives better strength when compared with 10 and 15 wt% [9]. Punyamurthy et al., 2017 [10], used chloride to treat abaca fibers. With FTIR analysis, the reaction between fiber cellulose and benzene diazonium chloride [10] was confirmed. Bledzki et al., 2009 [11], made PLA composites with artificial cellulose and abaca as the fibers. A composite with synthetic cellulose will show more mechanical strength than abaca since abaca has 60–70% cellulose content [11]. Pappu et al., 2019 [12], made composites using PLA as the matrix and hemp, sisal fillers as reinforcement using injection molding. A hybrid composite can be a better alternative since both fibers reduce the other fiber’s demerits [12]. According to Meena et al., in a 2023 study, the matrix is polyoxymethylene (POM), and the filler is alumina powder (Al2O3). The composite specimens for this experiment were made using the injection molding technique. In this study, the strength of the composite was investigated using mechanical, tribological, and morphological testing [13]. Using an injection molding machine and twin-screw extruder, Meena et al. created Polypropylene composite specimens by mixing different weight percentages of fly ash particles with Polypropylene. The composites underwent extensive testing to assess their modulus, damping, thermal response, solid-state and polymer melt characteristics, as well as tensile, compressive, and flexural strength. According to the results, Polypropylene’s compressive strength rises up to two weight percent of fly ash particles added before slightly declining [14].
The composite samples utilized in this investigation were created using the injection molding technique. A twin-screw extruder was used to compound composite pellets prior to injection molding. The goal of compounding is to create a uniform mixture. In accordance with accepted ASTM guidelines, mechanical attributes such as compressive, tensile, and flexural strengths were examined. Additionally, a pin-on-disc device with a wear test was used to assess tribological characteristics.

2. Materials and Method

2.1. Materials Used

For the fabrication of composite samples, matrix Polypropylene (PP) was used in the composite (grade 3120MA), as shown in Figure 1a. Marble dust contains a high amount of calcium carbonate and some amount of silica, alumina, etc. The filler material used was marble dust in powder form, as shown in Figure 1b. Polypropylene has a processing temperature of 170–230 °C.
The Twin Extruder Machine contains two hoppers, one for the matrix and one for the filler materials. The mixing takes place in a 900 mm barrel. The barrel has ten zones, and the temperature was set in increasing order in the direction of the material flow. We used the injection molding machine JIT 80T to fabricate the composite material samples. The injection machine used a cassette mold. So, it can easily be changed, different molds can be used, and time can be saved. There were three molds for tensile, flexural, and compression specimens. Each mold produces two samples of tensile, flexural, and compressive specimens.

2.2. Testing Equipment and Process

2.2.1. Testing Equipment and Process for Tensile, Compression, and Flexural Testing

All of the specimens were tested using a Heico Universal Testing Machine (UTM) equipped with a tensile analysis apparatus. The specimens underwent testing in compliance with ASTM 638. It was made up of two grippers that were powered by hydraulics. The specimens were pulled by these grippers at a steady loading rate that the user specified. At the rate of loading of 50 mm/min, a uniaxial tensile force was applied to the specimen’s two ends. The samples had a gauge length of 70 mm. Every 0.1 s, the machine took measurement data.
The behavior of the products under uniform compression loads was ascertained by a compression test. The specimen measured 25 by 12.5 by 12.5 mm2. Parallel to the surface, the sample was positioned between compressive plates. All of the samples were tested at a consistent loading rate of 2 mm/min. The specimens underwent testing in compliance with ASTM D695 guidelines.
The Universal Testing Machine (UTM) manufactured by Heico Company was used to measure the composites’ flexural strength. Testing was performed using the flexural testing equipment. A three-point flexural test was used to test a specimen with a rectangular cross-section for 8 mm deflection. The span length, or the distance between two simple supports, was 48 mm. The ASTM D790 test protocol was followed for testing the specimens. The rate of loading was 2 mm/min.

2.2.2. Pin-on-Disk Testing

The composites’ wear performance was evaluated using a sliding wear test in a friction and wear test rig of the pin-on-disc variety, which was provided by DUCOM. Made of high carbon alloy steel E31 that has been hardened to 60 HRC-2, the counter body was a disc. Along with compressive strength and abrasion resistance, it provided a high degree of hardness. While a normal force was given via a lever mechanism, the disc rotated while the specimen remained stationary.

2.2.3. Testing Equipment Used for SEM and EDS Analysis

The Nova Nano FE-SEM 450 (FEI) is the SEM and EDS analysis device. It offers characterization and analysis with ultra-high resolution, providing exact and accurate information at the nanometer scale. There is also an EDS attachment feature in this system. Material topography is studied using SEM. The substances ought to be conductive. The gold coating is required for the investigation of the non-conductive materials, which in this case are polymer materials.

3. Results and Discussion

3.1. Tensile, Compression, and Flexural Testing

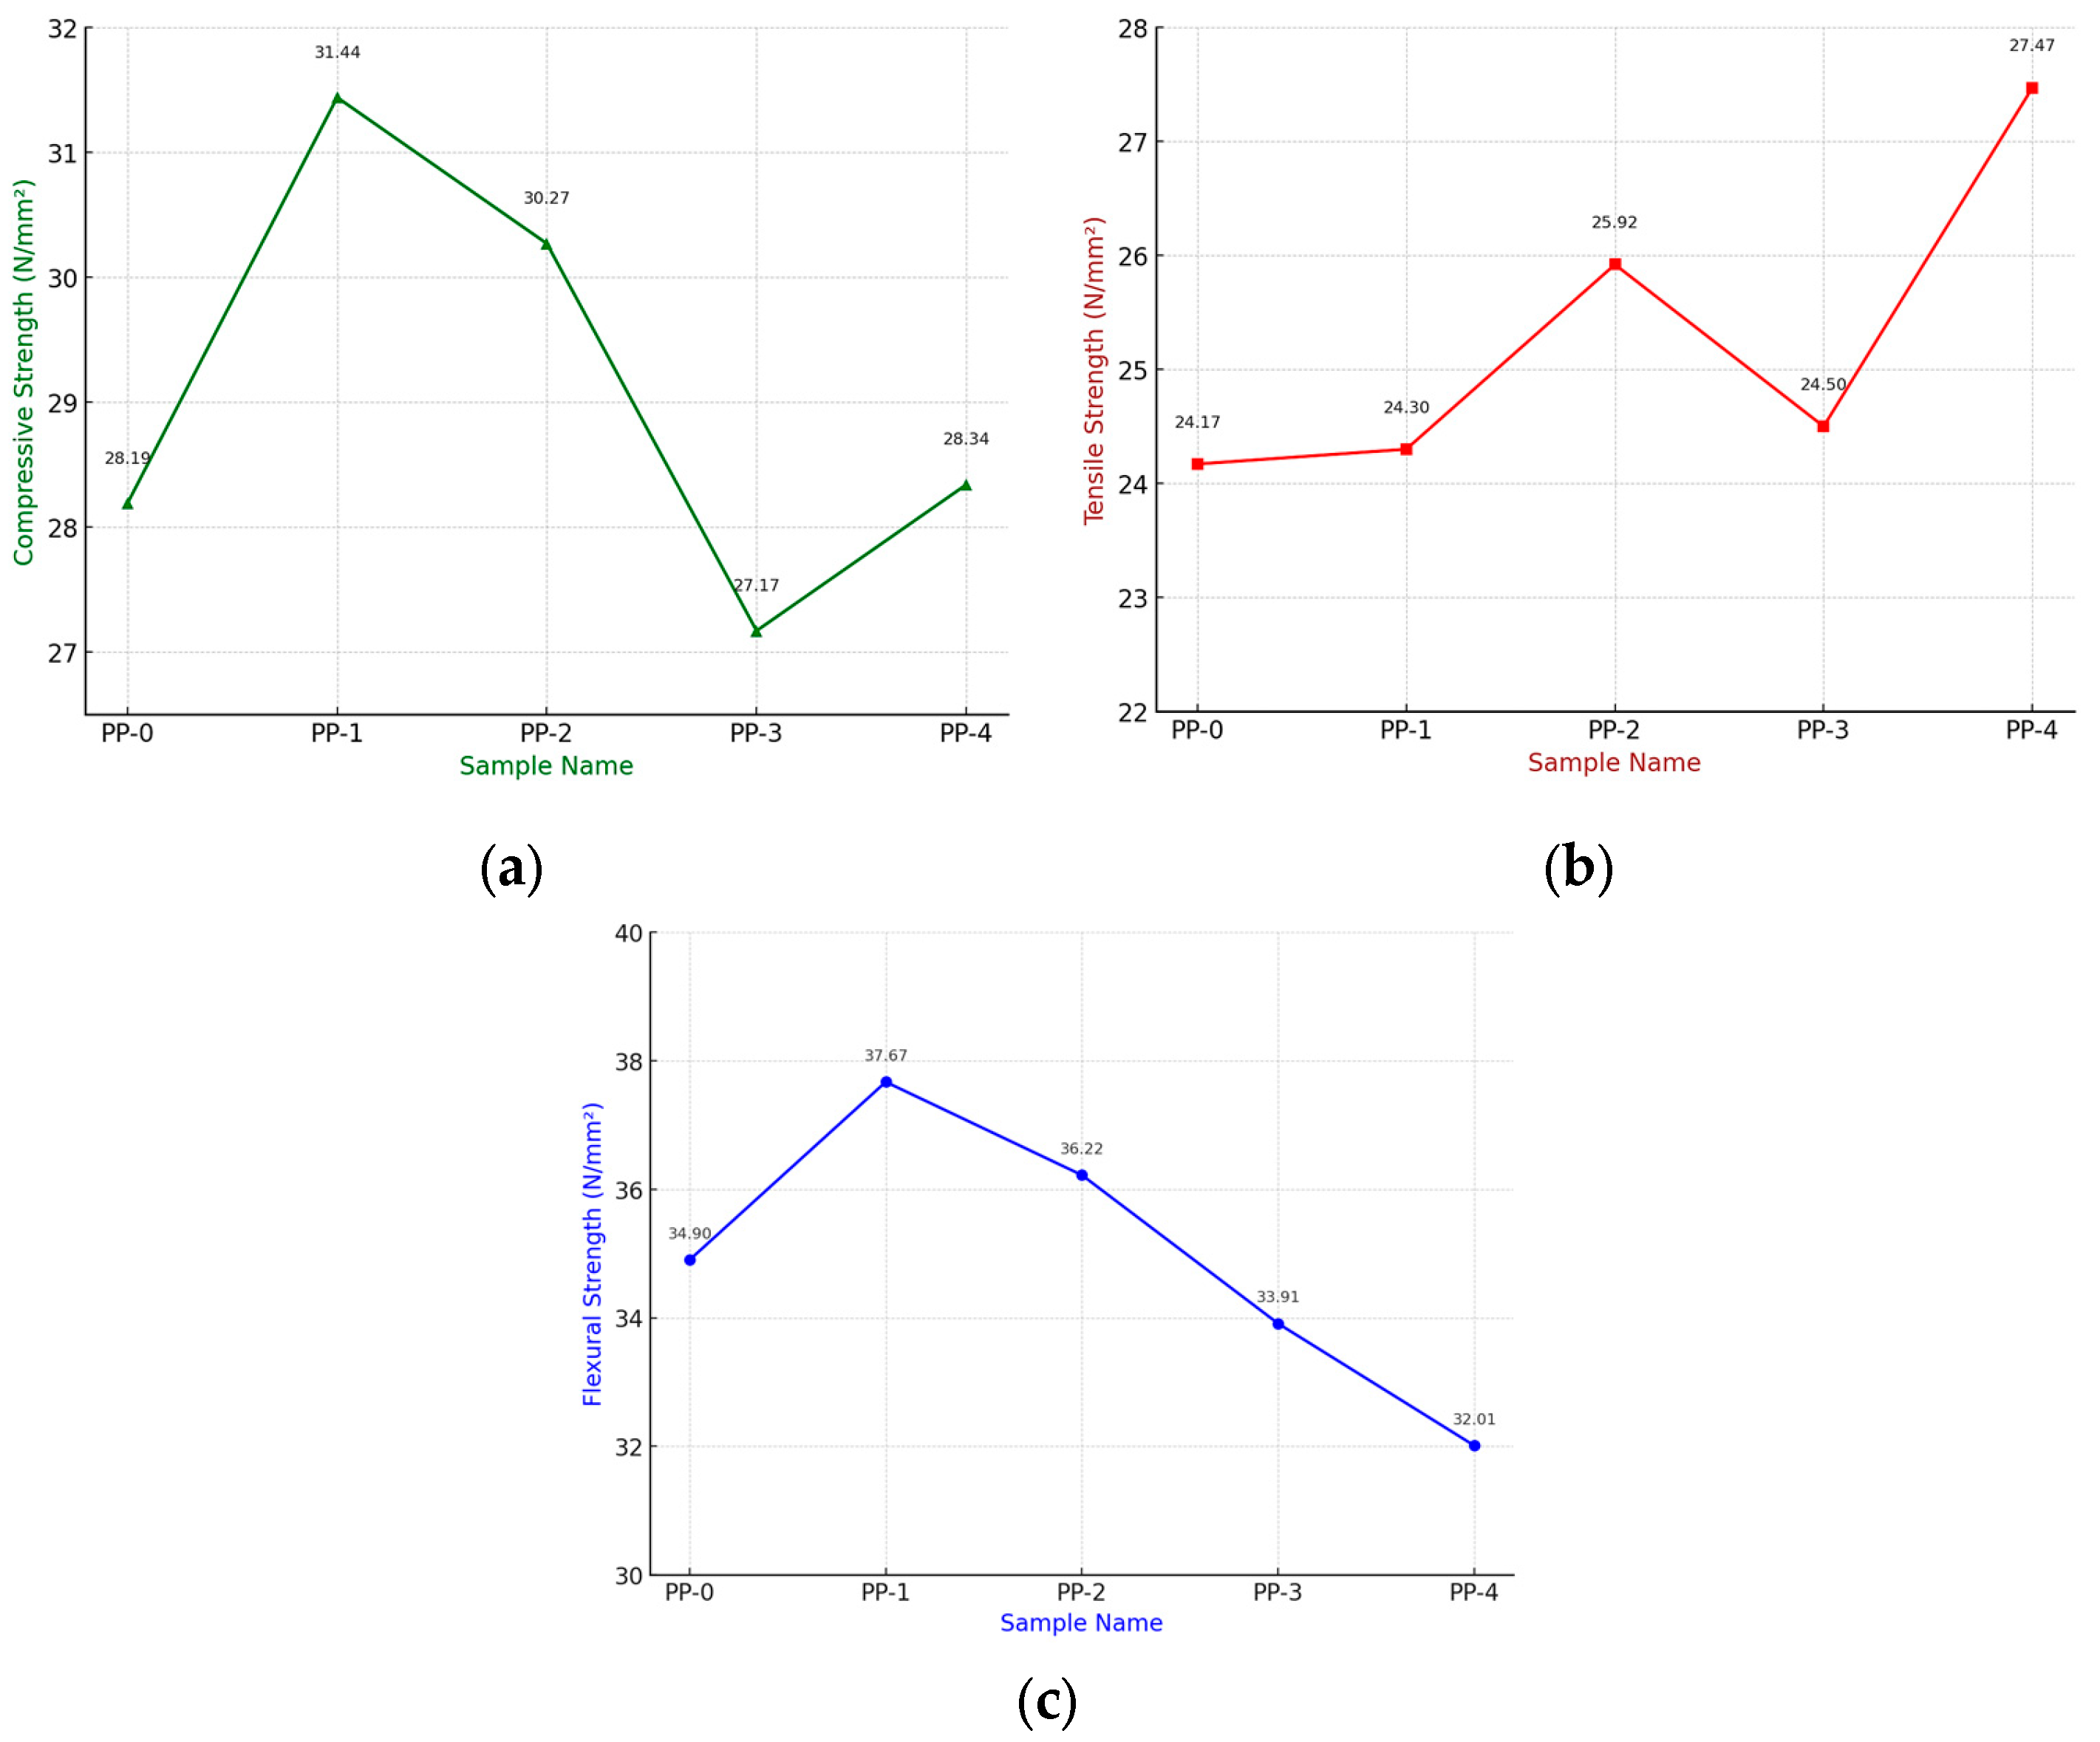
The tensile strength curve showed an increasing trend except for the PP-3 samples. This increase proves that the stress transfer was appropriate when increasing filler composition. As seen in Figure 2a, it can be said that the specimens went through a yielding phase and then a ductile failure. There is a 0.52% increase in PP-1 from PP-0. Then, there is an increase of 6.99% in PP-2. The trend shows a good interaction between the matrix and the filler materials under axial load. The decrease in tensile strength for PP-3 can be explained by SEM and EDS analysis. It can be seen that a significantly less amount of reinforcement is present in the fractured cross-section. So, it can be said that an inhomogeneous mixing was obtained.
The trend for compressive strength is somewhat like flexural strength. There is abnormal behavior at PP-3. In the compression and tensile test, the load is axial in direction. Therefore, it can be said that both showed similar behavior for PP-3, as shown in Figure 2b. The compressive strength mainly depends on the void fraction and the adhesion between the PP and MD. Also, it can be observed by SEM images that the filler particulates are irregular in shape. With the increase in filler proportion, the chances of an increase in the agglomeration of particles increase the chances of failure.
The flexural strength showed a downtrend with a slight increase of 7.93% from PP-0 to PP-1, as shown in Figure 2c. The flexural strength increase is due to the matrix and the filler material adhesion. As can be seen from the SEM images, there are places where filler pullout is visible.

3.2. Pin-on-Disk/Wear Rate Test and Void Fraction

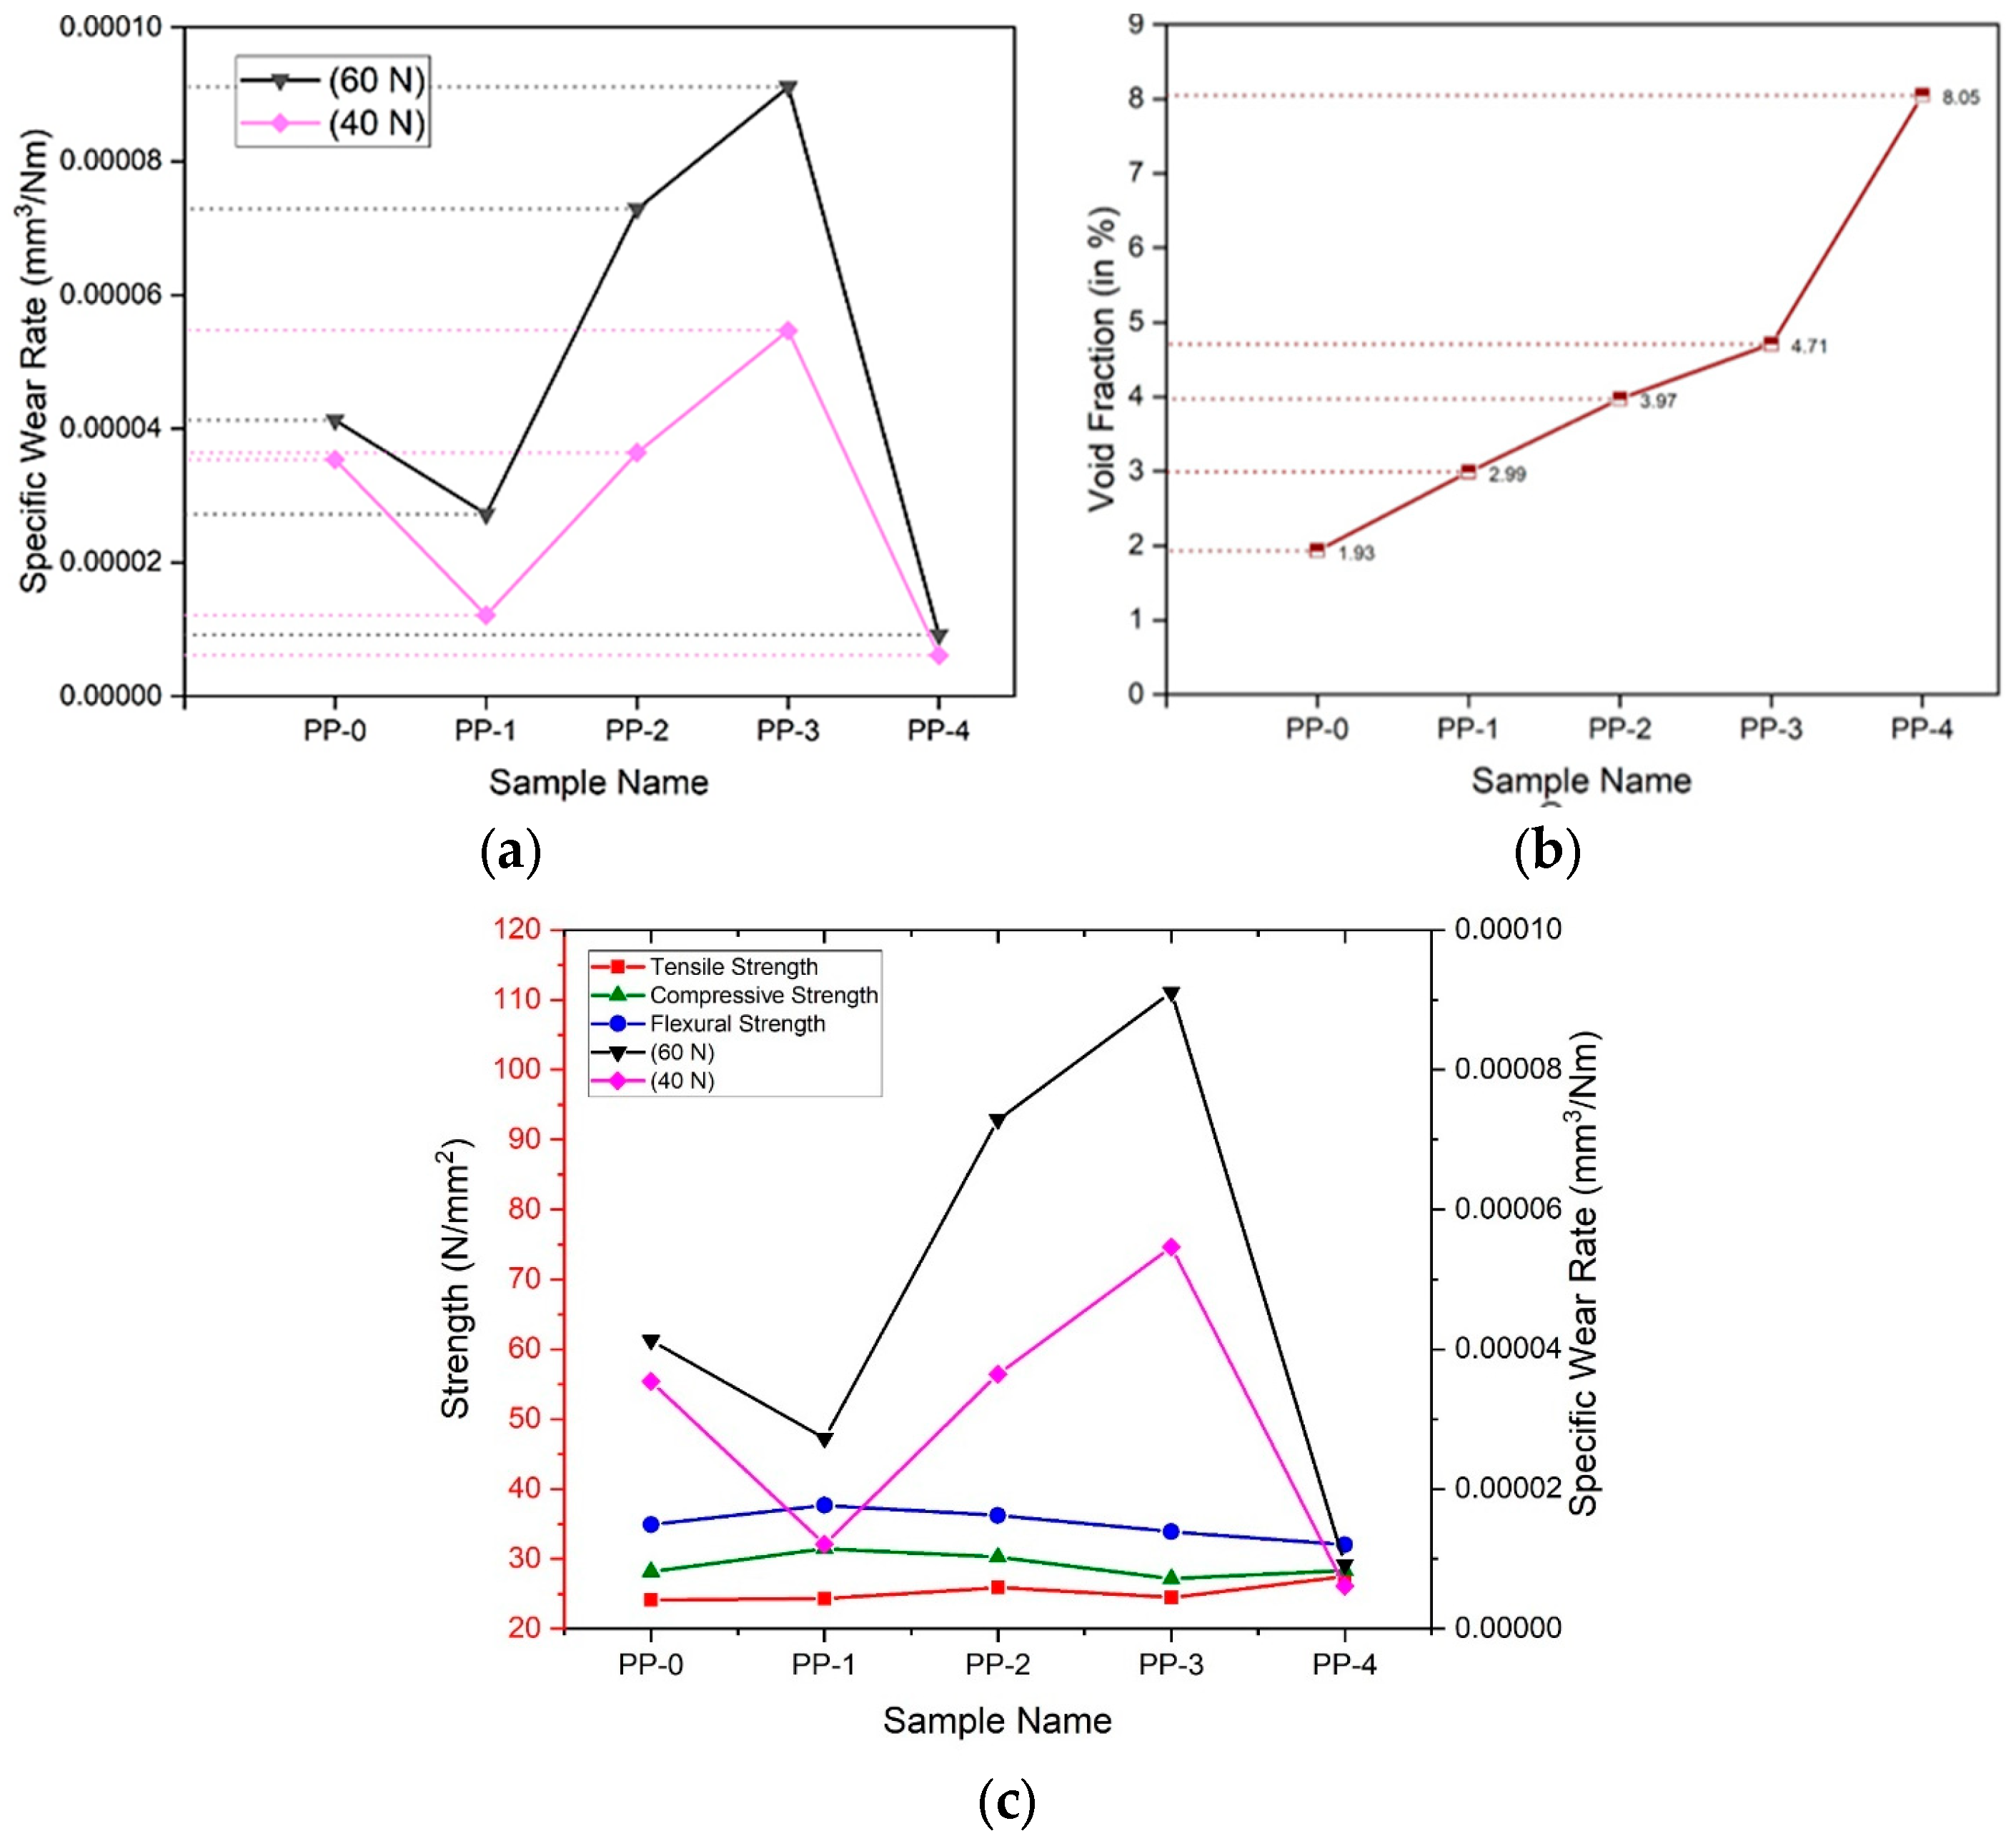
This study shows that the wear rate when 60 N is applied is greater than 40 N. For both loads, the wear rate shows similar behavior. Abnormal behavior is seen in the test. For PP-2 and PP-3, the wear rate is greater than the wear rate of PP-0. The wear rate increase can be due to filler materials that inhibit resistance to the wear. These MD particles wear out due to a lack of appropriate adhesion between PP and MD. For PP-4, the wear rate is less than that of PP-0. The wear rate value for PP-4 is nearly the same for both loads, as shown in Figure 3a.
From Figure 3b, it can be seen that as the filler materials are increased, the void fraction increases. For PP-0 samples, the void fraction is estimated to be less than 1%. These void fractions help in explaining other mechanical and tribological analyses. From PP-1 to PP-2, there is an increase of 32.77% in the void fraction. From PP-2 to PP-3, there is an increase of 18.63%, whereas, after 3 wt% of filler material, there is an increase of 70.91%. A rapid rise in voids can be seen. Figure 3c represents all strengths and specific wear rates of the composite samples. Table 1 shows the specific wear rate of composite specimens at 40 N and 60 N load and void fraction.

3.3. SEM and EDS Analysis

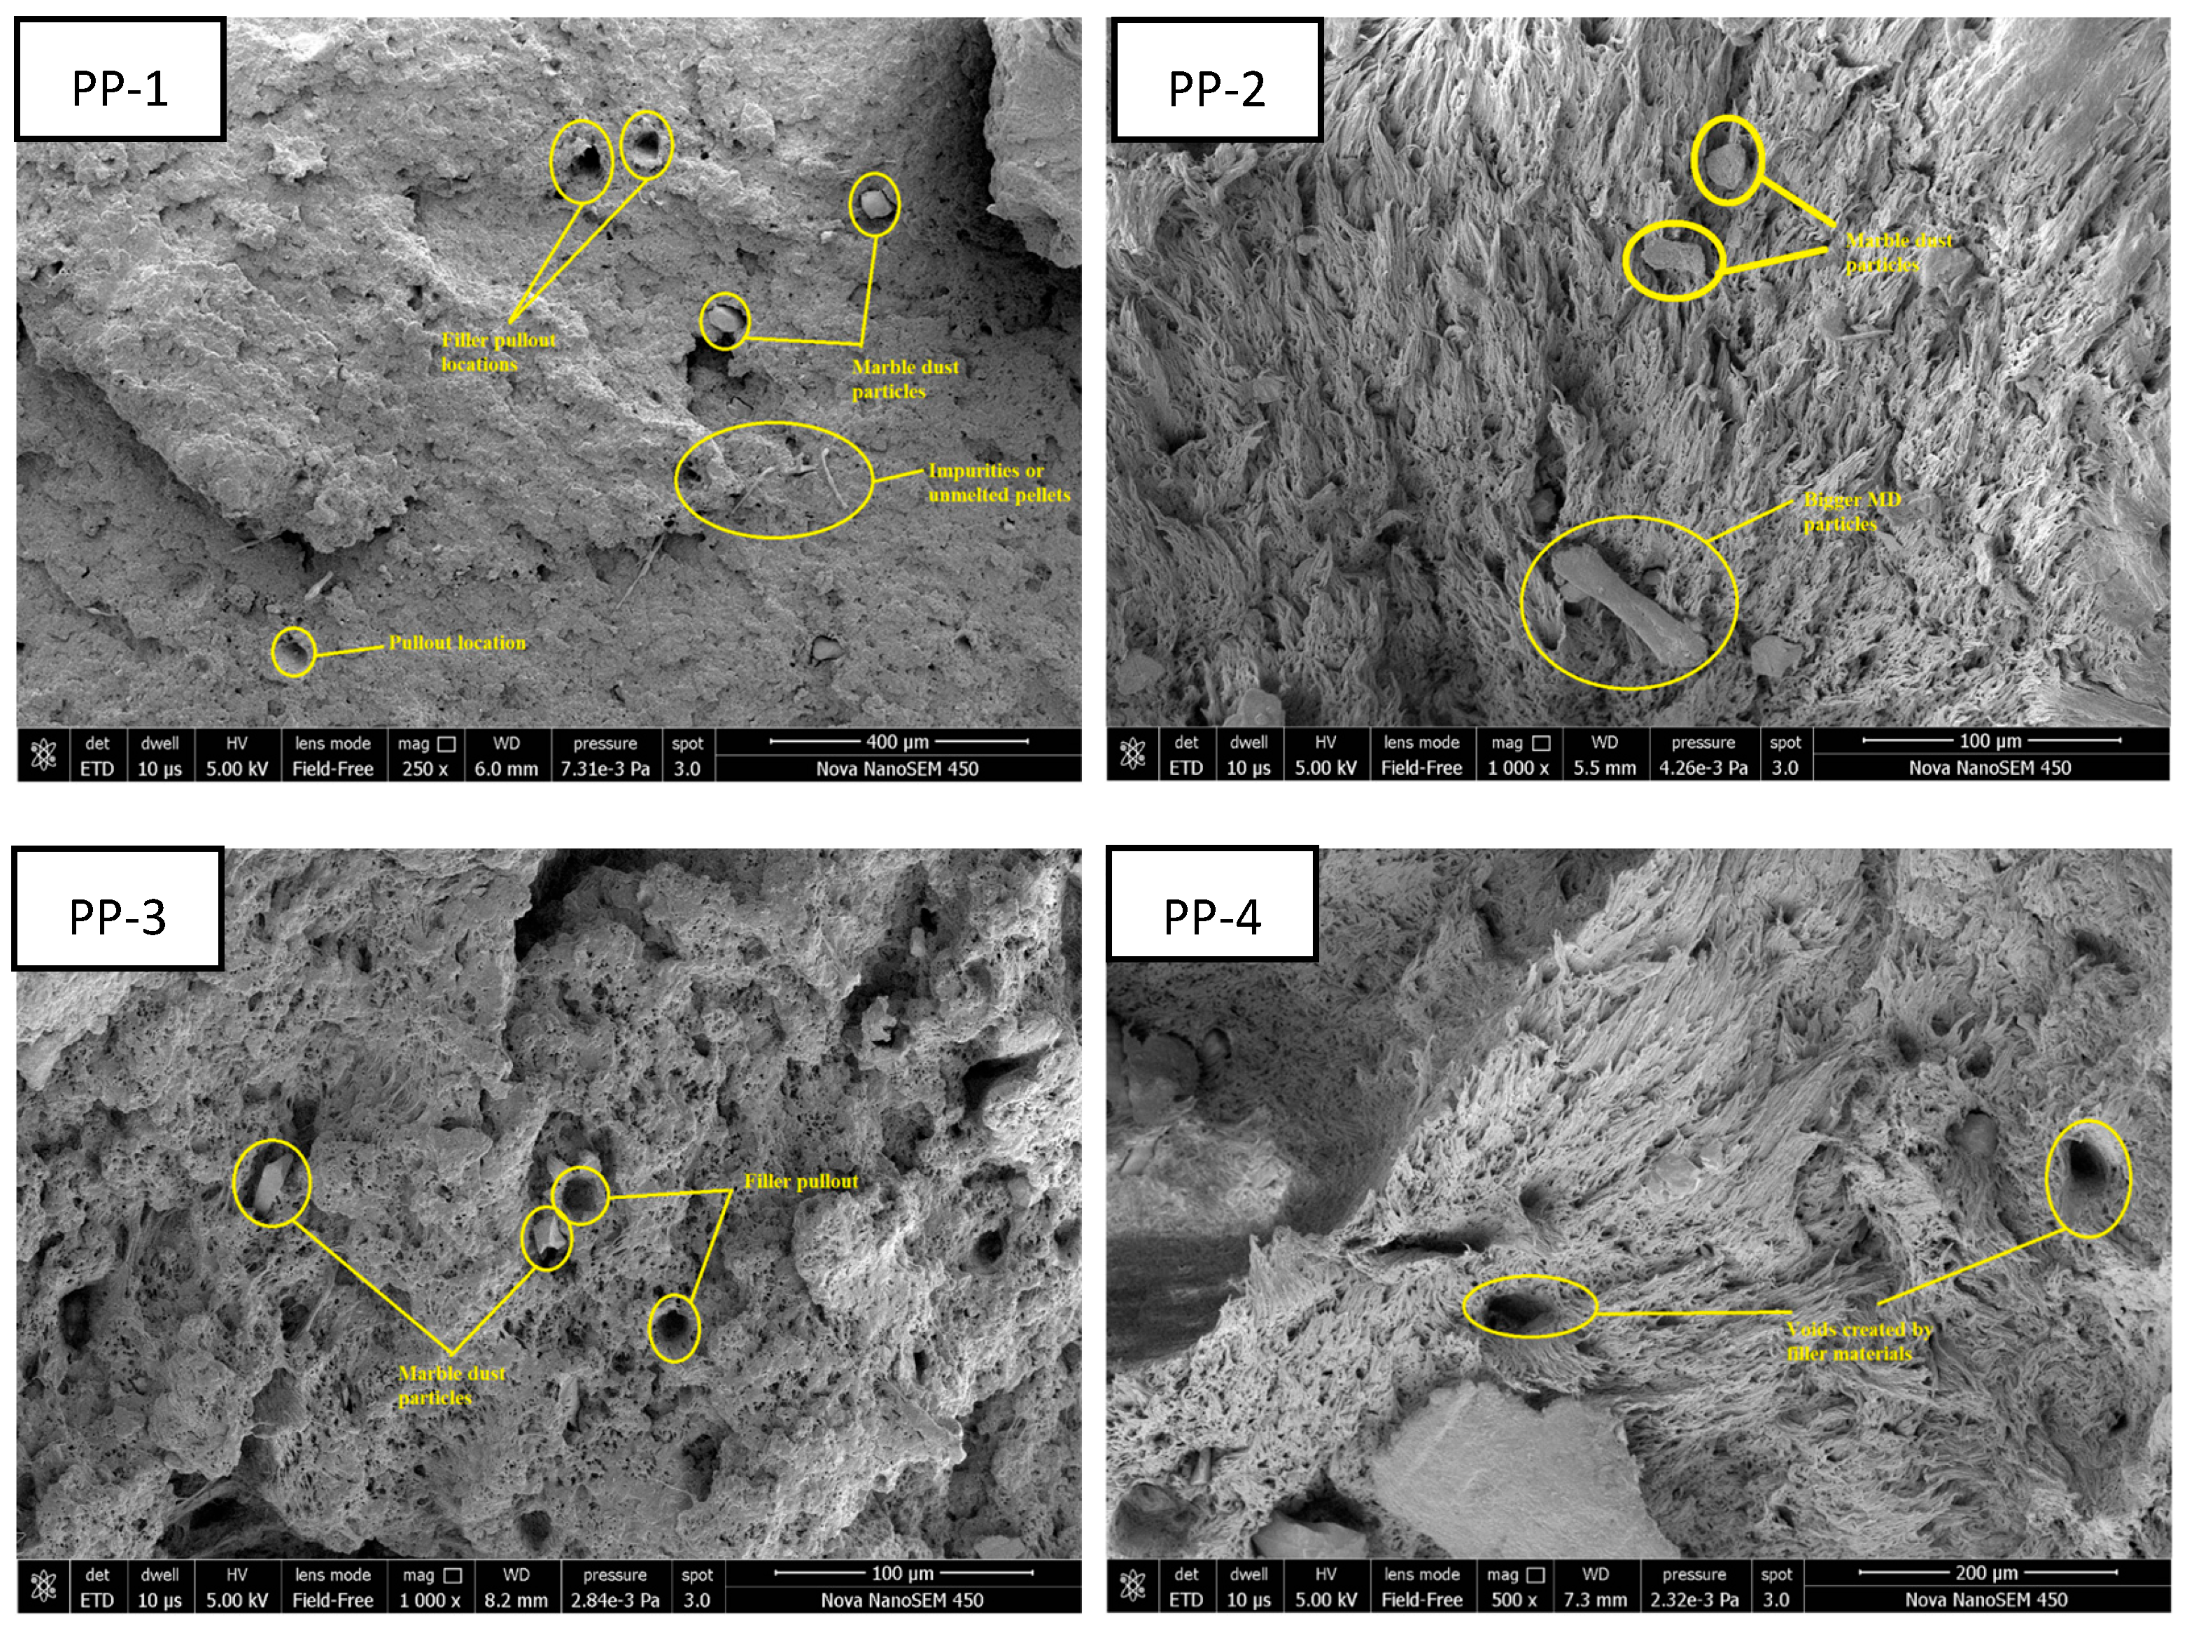
As is visible in Figure 4, there are some MD particles and pullout locations. Also, there are some impurities or unmelted pellets in PP-l. The particle size was estimated using ImageJ software (1.54i 03 released in March 2024). The particle size which was analyzed is around 45–60 µm. From EDS analysis, on the surface, it was found that 83.75% contains carbon (from PP), and 1.01% has Ca, which was from marble dust. For PP-2 in Figure 4, the size of the particles is around 17–30 µm. This variation in the particle size is because irregular shapes and sizes of marble dust are obtained after machining marbles. So, the orientation of filler material in the matrix can vary and thus shows deviation. It can be seen that a bigger MD particle of the size of approximately 70 µm is observed. Also, it was observed that 3.87% by weight of Ca and 82.04% by weight of C were seen.

4. Conclusions

The selection of matrix and filler materials is crucial for composite specimens, as it affects adhesion and void fraction. Optimal adhesion is achieved when the surface energies of mixed materials are similar. Compounding is key for a homogeneous mixture, with treated filler materials to prevent process clogging. Correct purging in injection molding ensures no unmelted pellets and proper fluidity for molding. Stress transfer is essential for mechanical strength, but PP-3 samples showed abnormal behavior due to fabrication defects. Size variation of micro-defects, observed via ImageJ software, and SEM images indicated ductile fractures and pullout locations. EDX analysis revealed the filler material proportion, with PP-3 samples having less filler, highlighting the importance of material selection and processing in composite performance.

Author Contributions

Conceptualization, writing—original draft preparation, and methodology: R.M., A.W.H. and S.A.; supervision and project administration: F.I. and A.M.; formal analysis, writing—review and editing, and funding acquisition: M.Y. and H.I. All authors have read and agreed to the published version of the manuscript.

Funding

This research received no external funding.

Institutional Review Board Statement

Not applicable.

Informed Consent Statement

Not applicable.

Data Availability Statement

All data generated or analyzed are included in this article.

Acknowledgments

The authors would like to express their sincere gratitude to MNIT Jaipur, India, and CETRI, University of Regina, Canada, for providing resources in carrying out this research.

Conflicts of Interest

The authors declare no conflicts of interest.

References

  1. Akonda, M.H.; Shah, D.U.; Gong, R.H. Natural fibre thermoplastic tapes to enhance reinforcing effects in composite structures. Compos. Part A Appl. Sci. Manuf. 2020, 131, 105822. [Google Scholar] [CrossRef]
  2. Azammi, A.N.; Sapuan, S.M.; Ishak, M.R.; Sultan, M.T. Physical and damping properties of kenaf fibre filled natural rubber/thermoplastic polyurethane composites. Def. Technol. 2020, 16, 29–34. [Google Scholar] [CrossRef]
  3. Siva, R.; Valarmathi, T.N.; Venkatesh, S.; Reddy, S.S.; Pandurangan, P.; Karthikeyan, P. Mechanical characterization and microstructure analyses of nano cellulose fiber biodegradable composite. Mater. Today Proc. 2021, 44, 3673–3677. [Google Scholar] [CrossRef]
  4. Mohammed, A.; Batu, T.; Manaye, M.; Allasi, H.L. Free vibration characteristics of flax fiber/expanded polystyrene waste composite. Mater. Today Proc. 2021, 45, 5328–5333. [Google Scholar] [CrossRef]
  5. Siva, R.; Nemali, S.S.; Gokul, K. Comparison of mechanical properties and water absorption test on injection molding and extrusion-injection molding thermoplastic hemp fiber composite. Mater. Today Proc. 2021, 47, 4382–4386. [Google Scholar] [CrossRef]
  6. Szostak, M.; Tomaszewska, N.; Kozlowski, R. Mechanical and thermal properties of rotational molded PE/Flax and PE/Hemp composites. In Advances in Manufacturing II: Volume 4-Mechanical Engineering; Springer International Publishing: Berlin/Heidelberg, Germany, 2019; pp. 495–506. [Google Scholar]
  7. Chegdani, F.; Takabi, B.; El Mansori, M.; Tai, B.L.; Bukkapatnam, S.T. Effect of flax fiber orientation on machining behavior and surface finish of natural fiber reinforced polymer composites. J. Manuf. Process. 2020, 54, 337–346. [Google Scholar] [CrossRef]
  8. Van Vuure, A.W.; Vanderbeke, J.; Mosleh, Y.; Verpoest, I.; El-Asmar, N. Ductile woven silk fibre thermoplastic composites with quasi-isotropic strength. Compos. Part A Appl. Sci. Manuf. 2021, 147, 106442. [Google Scholar] [CrossRef]
  9. Christu Paul, R.; Ramachandran, B.; Sushma, G.; Harshavardhan, K.A.; Rohith, I. An empirical research on areca fiber polymer composite for automotive components in modern industry. Mater. Today Proc. 2020, 33, 4493–4497. [Google Scholar] [CrossRef]
  10. Punyamurthy, R.; Sampathkumar, D.; Ranganagowda, R.P.; Bennehalli, B.; Srinivasa, C.V. Mechanical properties of abaca fiber reinforced polypropylene composites: Effect of chemical treatment by benzenediazonium chloride. J. King Saud Univ. Eng. Sci. 2017, 29, 289–294. [Google Scholar] [CrossRef]
  11. Bledzki, A.K.; Jaszkiewicz, A.; Scherzer, D. Mechanical properties of PLA composites with man-made cellulose and abaca fibres. Compos. Part A Appl. Sci. Manuf. 2009, 40, 404–412. [Google Scholar] [CrossRef]
  12. Pappu, A.; Pickering, K.L.; Thakur, V.K. Manufacturing and characterization of sustainable hybrid composites using sisal and hemp fibres as reinforcement of poly (lactic acid) via injection moulding. Ind. Crops Prod. 2019, 137, 260–269. [Google Scholar] [CrossRef]
  13. Meena, R.; Mali, H.S.; Meena, A.; Sharma, P.N.; Kumar, P.; Choudhary, K. Influence of alumina powder (Al2O3) on mechanical and tribological properties of injection molded polyoxymethylene composites. Mater. Today Proc. 2023, in press. [CrossRef]
  14. Meena, R.; Hashmi, A.W.; Ahmad, S.; Iqbal, F.; Soni, H.; Meena, A.; Al-Kahtani, A.A.; Pandit, B.; Kamyab, H.; Payal, H.; et al. Influence of fly ash on thermo-mechanical and mechanical behavior of injection molded polypropylene matrix composites. Chemosphere 2023, 343, 140225. [Google Scholar] [CrossRef] [PubMed]
Figure 1. Composite preparation: (a) Pure Polypropylene and (b) marble dust.
Engproc 76 00110 g001
Figure 2. Mechanical properties of composite specimens: (a) tensile strength, (b) compressive strength, and (c) flexural strength.
Engproc 76 00110 g002
Figure 3. Comprehensive analysis of composite specimens: (a) specific wear rate, (b) void fraction, and (c) comparative overview of strengths and specific wear rates.
Engproc 76 00110 g003
Figure 4. SEM and EDX analysis of PP-1, PP-2, PP-3, and PP-4.
Engproc 76 00110 g004aEngproc 76 00110 g004b
Table 1. Specific wear rate of composite specimens at 40 N and 60 N load and void fraction.
S. No.Sample NameSpecific Wear Rate at 40 N Load (mm3/Nm) (×10−5)Specific Wear Rate at 60 N Load (mm3/Nm) (×10−5)Void Fraction (%)
1PP-03.534.121.93
2PP-11.212.722.99
3PP-23.647.283.97
4PP-35.469.14.71
5PP-40.610.918.05
Disclaimer/Publisher’s Note: The statements, opinions and data contained in all publications are solely those of the individual author(s) and contributor(s) and not of MDPI and/or the editor(s). MDPI and/or the editor(s) disclaim responsibility for any injury to people or property resulting from any ideas, methods, instructions or products referred to in the content.