Proceeding Paper

An Electrochemical Sensing Platform Based on a Carbon Paste Electrode Modified with a Graphene Oxide/TiO2 Nanocomposite for Atenolol Determination †

1
Department of Basic Sciences, Faculty of Dental Medicine, Western Balkans University, 1001 Tirana, Albania
2
Department of Chemistry, Faculty of Natural Sciences, University of Tirana, 1001 Tirana, Albania
*
Author to whom correspondence should be addressed.
Presented at the 4th International Electronic Conference on Biosensors, 20–22 May 2024; Available online: https://sciforum.net/event/IECB2024.
Eng. Proc. 2024, 73(1), 1; https://doi.org/10.3390/engproc2024073001
Published: 19 August 2024
(This article belongs to the Proceedings of The 4th International Electronic Conference on Biosensors)

Abstract

:
Atenolol is a medication belonging to the class of drugs known as beta-blockers, used to treat high blood pressure (hypertension) and irregular heartbeats (arrhythmia). Their presence in the environment has serious impacts on humans, animals, and the water ecosystem. In this context, the aim of this study was to develop a simple voltammetric method for the determination of atenolol (ATN) using carbon paste electrodes modified with the nanomaterials TiO2 and rGO/TiO2. The analytical performance of the modified sensor was evaluated using square wave voltammetry and cyclic voltammetry in 0.1 mol L−1 acid sulfuric solution (H2SO4), pH 2. The nanocomposite electrode CPE/rGO/TiO2 exhibited excellent electrocatalytic activity towards ATN oxidations at 0.1 mol L−1 H2SO4 compared with unmodified carbon paste electrodes CPEs and those modified with titanium oxide, CPE/TiO2. Different experimental and conditional parameters were optimized, such as supporting electrolytes, pH, amplitude, frequency, etc. Under optimal conditions, linear calibration curves were obtained, ranging from 1.7 to 23.2 µmol L−1 for ATN with detection limits of 0.05 μmol L−1. The modified nanocomposite CPE/rGO/TiO2 sensor showed good sensitivity and good repeatability (RSD ≤ 0.61%) for ATN determination. The proposed sensor is mechanically robust and presented reproducible results and a long useful life. In order to verify the usefulness of the developed methods, the nanocomposite sensor CPE/rGO/TiO2 was applied for the detection of atenolol in real samples (pharmaceutical tablets without any pre-treatment). The excipients present in the tablets did not interfere in the assay. Recoveries ranging from 97.7% to 106% were obtained. The results showed that the CPE/rGO/TiO2 voltammetric sensor could be successfully applied in the routine quality control of ATN in complex matrices.

1. Introduction

The β-blocker drug atenolol (I), designated chemically as 4-(2-hydroxy-3-isopropylaminopropoxy) phenylacetamide, is a hydrophilic, β1-selective (cardioselective) adrenoceptor antagonist [1]. The tremendous increase in the use of antihypertensive medications such as beta-blockers points toward the increasing number of hypertension cases in the last decade. Atenolol is one of the most widely used β-blockers in the treatment of various cardiovascular disorders [2]. The use of nanomaterials for the determination of a variety of compounds is attracting attention in recent electroanalytical research. In order to modify and improve the sensitivity and selectivity of working electrodes, nanomaterials have been shown to be suitable materials [3]. Electroanalytical techniques can be easily adopted to solve many problems of fundamental importance with a high degree of accuracy, precision, sensitivity, and selectivity, often in a spectacularly reproducible way. In these techniques, the electrode surface itself is a powerful tool for the quantification of an analyte. By controlling the potential, the electrode can be used as a variable free energy source (or sink) of electrons. In addition, electrons crossing the electrode–solution interface can be determined with great sensitivity by measuring current. Voltammetry is considered an important electrochemical technique for electroanalytical chemistry because it has low cost, sensitivity, and precision, as well as accuracy, simplicity, and rapidity. Voltammetric techniques, such as cyclic voltammetry (CV), differential pulse voltammetry (DPV), square wave voltammetry (SWV), etc., have been proven to be very sensitive for the determination of organic molecules including drugs and related molecules in pharmaceutical dosage forms and biological fluids. Therefore, simpler and faster methods for the analyses of different receptor blocking agents are interesting for the quality of pharmaceutical formulations that contain them and also for therapeutic drug monitoring purposes. Despite their high use and application, little work has been conducted on the determination of cardiovascular drugs for electrochemical and related sensing devices [2,4,5,6]. In the present work, we introduced a highly sensitive electrochemical method, which is simple and selective. The determination of ATN has been reported on by utilizing carbon paste sensors nanomodified with nanoparticles TiO2/CPE and reduced graphene oxide decorated with nanoparticles rGO/TiO2/CPE. Two nanostructure modifiers, TiO2 and rGO/TiO2, are effective in composite sensors for β-blocker (ATN) detection because these materials are easy to prepare, have good biocompatibility, and can transfer electrons quickly, making them ideal for sensitive and selective ATN detection. In the pharmaceutical industry, electroanalysis is an effective analytical method that is becoming more useful [5,6,7,8,9,10]. Square wave voltammetry (SWV) is a technique that is supposed to be used with samples in order to investigate analytes in their pharmaceutical formulations.

2. Materials and Methods

2.1. Experimental Section

2.1.1. Reagents and Chemicals

All experimental materials and reagents were of analytical grade (Sigma and Merck, by Merck, KGaA Darmstadt, Germany). ATN was in powder form, pure standard form (series 00336). Double-distilled water was used to prepare each solution. Merck (99% Merck) provided the H2SO4 needed to create the supporting electrolyte. Synthetic graphite powder (90–71 μm particle size) was obtained from Alfa Aesar (99.9% Alfa Aesar, by Thermo Scientific Chemicals, MA, USA), and paraffin oil (Olio di Vaselina, by Humanitas, Milano, Italia) was supplied by Zeta Farmaceutici (Sandrigo VI, Italy). The TiO2 synthetic powder was of analytical grade, 99%. Sodium chloride, sodium hydrogen phosphate, acetic acid, and all other salts were obtained from Aldrich, except for sodium hydroxide and hydrochloric acid, which were supplied by Merck. A freshly made stock solution containing 10 mmol L−1 of ATN was diluted in 0.1 mol L−1 of H2SO4 solution and refrigerated at 4 °C.

2.1.2. Apparatus

PalmSens4 (PalmSens, De Indruk, The Netherlands), potentiostat–galvanostat, connected via Bluetooth to a computer running three-electrode system software, was used for all electrochemical measurements. A platinum wire was the counter-electrode, silver–silver chloride Ag/AgCl/KCl (3M) was the reference electrode, and the CPE/rGO/TiO2 and CPE/TiO2 sensors were developed as working electrodes for this study. Cyclic voltammetry (CV) and square wave voltammetry (SWV) were used to electrochemically detect ATN. SW voltammograms were first recorded in an electrochemical cell with 15 mL of 0.1 mol L−1 H2SO4 serving as a supporting electrolyte and then by adding different concentrations of ATN beta-blockers at a potential between 1.0 and 1.7 V (vs SCE), with a frequency of 30 Hz, an amplitude of 50 mV, and a scan rate of 100 mVs−1. Voltammetric measurements were performed at 26 ± 0.5 °C in an unstirred electrochemical cell with 15 mL of 0.1 mol L−1 H2SO4 as the supporting electrolyte. Pulsed ultrasonic bath model: QC, capacity: 2.5 L, tank cleaning power: 375 w, cleaning frequency: 49 Khz, timer adjustment: 1–30 min, quiet operation, tank size internal: (mm) 240 × 130 × 100 deep (inches) 9.5 × 5 × 4 deep. A scheme of the ATN oxidation mechanism is shown in Figure 1.

2.2. Synthesis of Carbon-Based Modified Nanocomposite Sensors

2.2.1. Preparation of CPE/TiO2 Sensor

CPE/TiO2 was obtained by mixing 1.00 g of carbon powder, 0.100 g of TiO2, and 300 µL of paraffin for 30 min to prepare a homogenous paste. Firstly, paraffin and graphite powder (particle size, 90–72 μm) were mixed, and a TiO2 modifier was added and mixed with a mortar and pestle until a homogeneous paste was achieved. Before measurement, the produced composite material was stored for 24 h at 4 °C in a refrigerator. The produced paste was packed into a plastic syringe with an 8 mm inner diameter containing a 9.5 mm copper wire as the external electric contact. Preparing the unmodified CPE involved identical steps but without adding a modifier (TiO2): 1.00 g of graphite powder and 300 µL of paraffin. Before the measurements, the electrode surface was smoothed on a glass surface. After removing a portion of the paste and polishing the glass surface, the electrode’s surface was renewed.

2.2.2. Preparation of CPE/rGO/TiO2 Sensor

  • Preparation of rGO/TiO2 Composite: In total, 1.00 g of graphene oxide, 0.143 g of TiO2, and 15 mL of distilled water were mixed to create the composite. After the paste was mixed, it remained in an ultrasonic bath for 4 h and was then centrifuged at 5000 RPM.
  • CPE/rGO/TiO2: The composite electrode material was synthesized by mixing 1.00 g of carbon powder with particle sizes ranging from 70 to 90 μm, 0.100 g of reduced graphene oxide (rGO) decorated with titanium dioxide (TiO2), and 300 µL of paraffin. The mixture was thoroughly mixed for 30 min to obtain a uniform paste. First, the graphite powder and paraffin were mixed, and then the rGO/TiO2 mixture modifier was added and mixed again with a mortar and pestle until a consistent paste was formed. The resulting paste was filled into a plastic syringe with an internal diameter of 8 mm and an exterior diameter of 9.5 mm. The syringe also contained a copper wire as the external electric contact.

3. Results and Discussion

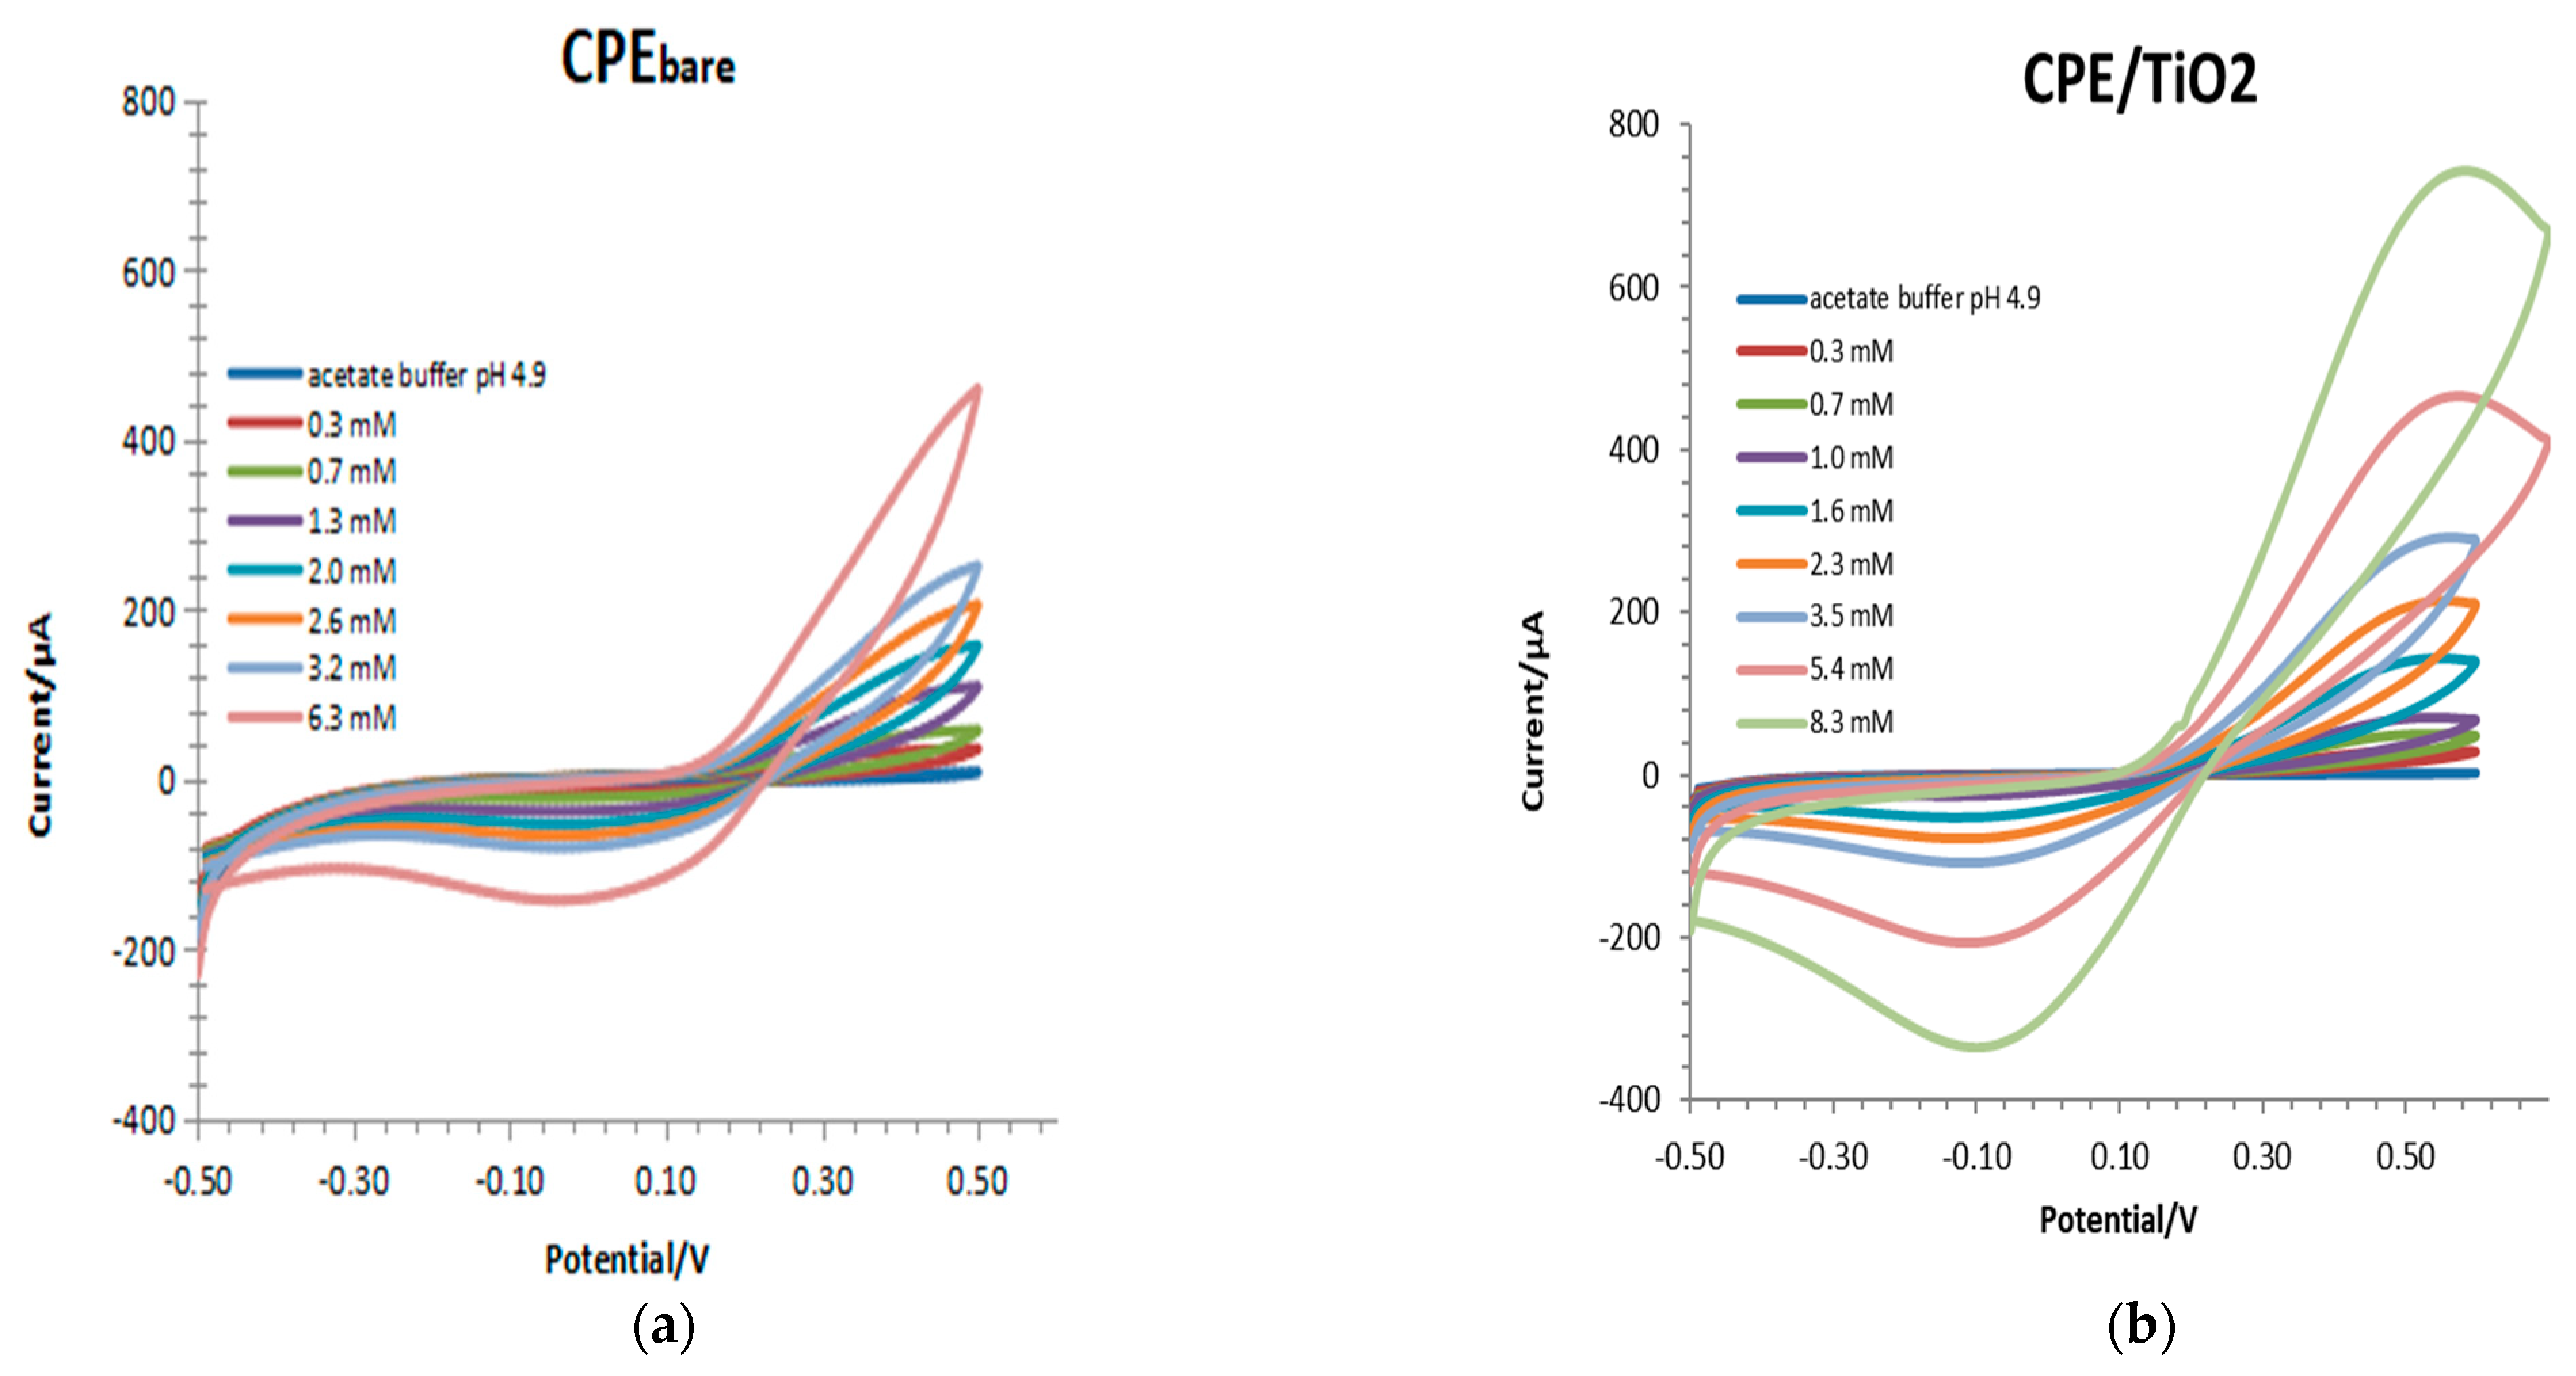
3.1. Electrochemical Characterization of Nanocomposite Sensors

The electrochemical characterization of the nanocomposite sensor CPE/TiO2 was carried out by cyclic voltammetry, using K3Fe(CN)6 as a redox probe in acetate buffer pH 4.9, from −0.5 to +0.5 V at scan rate 100 mV/s. Typical cyclic voltammograms registered with bare CPEs and modified electrodes are presented in Figure 2. It can be observed that the incorporation of TiO2 nanoparticles in the composite CPE showed an improvement in the electrochemical response of CPE/TiO2, manifested by an increase in the peak current and a well-defined peak (oxidation and reduction peak) compared to the CPE. This can be related to the increase in the active surface area due to the TiO2 nanoparticles and its electrocatalytic effects [2,3,7].
The voltammetric behavior of the nanocomposite sensor CPE/TiO2 was studied using K3Fe(CN)6 as a redox probe in cyclic voltammetry at a 100 mVs−1 scan rate. The Randles–Sevcik equation was used to calculate the effective surface area [11].
I = (2.69 × 10⁵) ACD1/2 n 3/2 ʋ1/2
where the effective surface area of the electrode in cm2 is represented by A; n is the number of electrons taking part in the charge transfer process; D is the diffusion coefficient of the analyte in the solution; and C is the K3Fe(CN)6 solution concentration. The values of n and D for K3Fe(CN)6 are 1 and 7.6 × 10⁻⁶ cm2 s−1, respectively. The surface areas of the electrodes were calculated using the Randles–Sevcik equation [12]; the calculated surface areas of the bare CPE and CPE/TiO2 were 0.14 cm2 and 0.32 cm2, respectively (Figure 2), indicating that CPE/TiO2 has the largest surface area and electroactive site for analyte detection.

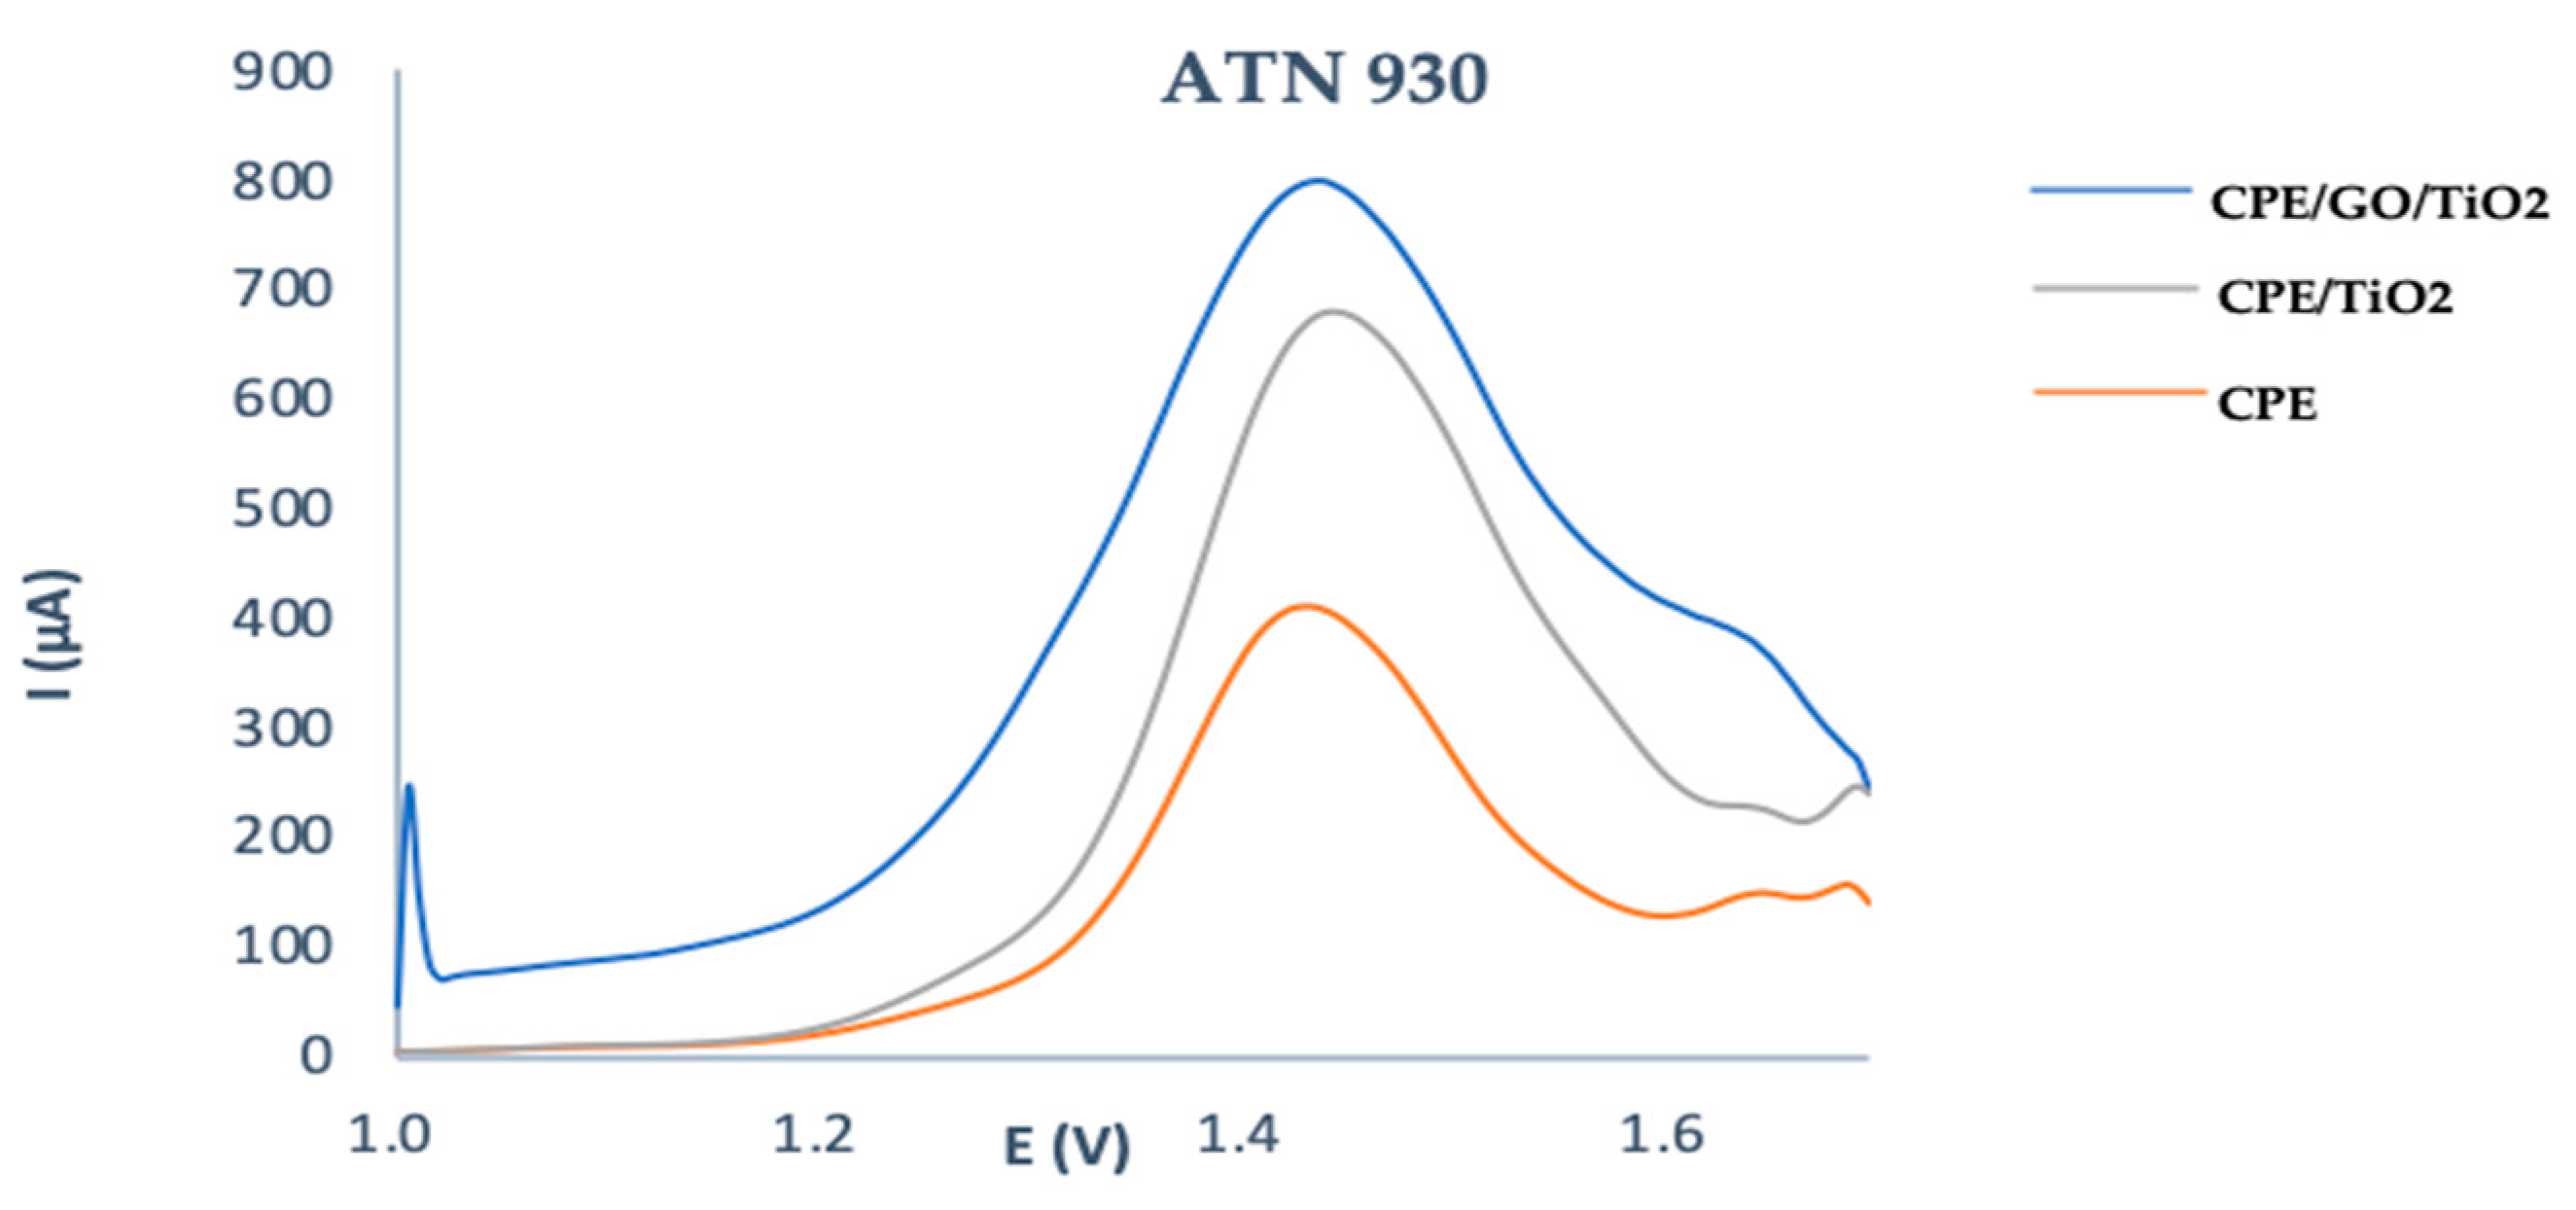
3.2. Electrochemical Behavior of ATN

Our previous research demonstrated that using ilmenite natural nanomaterials incorporated as nanocomposites into CPEs resulted in a catalytic impact during the electro-oxidation of atenolol [2,3]. In the present study, we tested the effect of adding nanostructure modifiers such as TiO2 and reduced graphene oxide decorated with TiO2 nanoparticles to CPE composite sensors. We tested the peak intensity and potential values using an unmodified carbon paste electrode and a modified carbon paste (CPE/TiO2 and CPE/rGO/TiO2). The best modifier should provide a low background current, the highest current value, and a resolution. The square wave voltammetric method was used to investigate the oxidation behavior of ATN (930 µM). The voltammetric-modified sensors (CPE/TiO2 and CPE/rGO/TiO2) showed good electrocatalytic activity toward ATN electrochemical oxidation at a potential of 1.42 V in a 0.1 mol L−1 H2SO4 solution (pH 2) compared with the bare electrode (CPE). The maximum current was observed with the CPE/rGO/TiO2 sensor (Figure 3) [2,13,14,15].
The results show that a well-defined anodic peak and the highest signal were obtained using CPE/rGO/TiO2, while for the other electrodes, a smaller anodic peak appeared.

3.3. Study of pH and Supporting Electrolyte

The influence of pH values on the oxidation peak current for ATN was investigated using the square wave technique, employing different electrolytes of pH 4.9–7.0 (Figure 4). In the ion exchange reactions, the response of the nanomodified sensor CPE/rGO/TiO2 was strongly affected by the supporting electrolyte, pH, or ionic strength. Concretely, the effect of pH and the supporting electrolyte on the sensor response was tested in 1500 µM ATN solutions prepared with an acetate buffer (pH 4.5), a phosphate buffer (pH 7), and a 0.1 mol L−1 H2SO4 solution (pH 2). Figure 4 and its inset show the effect of the electrolyte and the pH of the preconcentration solution on the anodic current response in detecting ATN, revealing that pH strongly influences the oxidation process. These pH values were investigated because ATN provides better electrochemical behavior at 0.1 mol L−1 in H2SO4 (pH 2.0), as previously shown by N. Broli et al., 2022 [2,3,13]. The highest anodic peak current and a well-defined peak were observed at a pH of 2.0 in a sulfuric acid solution, and this was selected for further experiments.

3.4. Optimization of Experimental Parameters and Analytical Curves

We optimized the influence of SWV parameters like square wave frequency (f) and pulse amplitude (a) on the electro-oxidation reaction of 1500 µmol L−1 ATN at CPE/TiO2 in a 0.1 mol L−1 H2SO4 solution with a pulse width of 30 mS (Figure 5). The ranges studied were 10–60 Hz for the square wave frequency and 10–100 mV for the pulse amplitude; the registered SW voltammograms are shown in Figure 5 A, B. The oxidation peak currents (Ipa) of ATN for the pulse amplitude ranging from 10 to 100 mV indicated that a well-defined peak and a greater peak current were obtained using a 50 mV pulse amplitude. The impact of frequency was also assessed within a range of 10 to 60 Hz. The peak current intensity was positively correlated with the increasing frequency, reaching a distinct maximum at 30 Hz. The optimal peak definition for ATN detection was achieved by utilizing a pulse amplitude of 50 mV and a frequency of 30 Hz.

3.5. Analytical Performance of Nanocomposite Sensors for ATN Determination

Square wave voltammetry was employed for the quantitative measurements of atenolol, owing to its higher sensitivity than cyclic voltammetry. Thus, SWV was employed to study the electrochemical response of the CPE/TiO2 and CPE/rGO/TiO2 nanocomposite sensors toward ATN. Under optimized conditions, the applicability of the proposed voltammetric sensors (CPE/TiO2 and CPE/rGO/TiO2) for ATN detection was examined by measuring the peak current as a function of the analyte (ATN) concentration. Figure 6 illustrates the SW voltammograms obtained with CPE/TiO2 sensors for different concentrations of ATN in 0.1 mol L−1 H2SO4 at a pH of 2.0.
Square wave voltammograms obtained with increasing amounts of ATN showed that the oxidation peak current increased linearly with increasing concentration, as shown in Figure 6. Under the optimal working conditions described above, linear calibration curves were obtained for ATN in a range of 1.7 to 23.2 µmol L−1. The linear equation was Ip (µA) = 1.734C (µM) + 10.9 (R2 = 0.990). A deviation from linearity was observed for more concentrated solutions, owing to the adsorption of its oxidation product on the nanoelectrode surface. Related statistical data on the calibration curves were obtained from three different calibration curves. The limit of detection (LOD) was calculated using the equation LOD = 3 s/m, where s is the standard deviation of the peak currents of the blank (four runs), and m is the slope of the calibration curve resulting from 0.68 µM. The LOD sample solutions recorded after 48 h did not appreciably change the assay values. The electrochemical behavior of the nanocomposite sensor (CPE/rGO/TiO2) was also evaluated for ATN detection in the same optimal conditions as the CPE/TiO2 sensor. SW voltammograms obtained after successive ATN standard solution additions are shown in Figure 7.
Figure 7 shows that the height of this peak increases with increasing analyte concentrations. The calibration graph of the peak current versus concentration was constructed using data from these measurements, and the least squares were evaluated using the linear regression method. The oxidation peak currents exhibited a linear relationship with the ATN concentrations of 6.6 to 26.6 µM. The inserts in this figure depict the work zone and the analytical curve obtained for ATN (r = 0.9954), with a corresponding best-fit regression equation of Iap (µA) = 5.89C (µM) + 1.0.0 (R2 = 0.9954), where Iap is the anodic peak current, and C is the ATN concentration in mol L−1, with an LOD of 0.05 µM. The Table 1 summarizes the analytical parameters of bare CPE and modified nanocomposite sensors, evaluated using the SWV technique in the 0.1 M H2SO4 solution (pH 2).
The results show that the proposed modified nanocomposite sensors are preferable for atenolol detection, where CPE/rGO/TiO2 resulted in a higher sensitivity of 5.89 µA/µM. Moreover, these modified electrodes are simple to prepare and use, have a low cost, and have very high stability; thus, they can be alternatively used to detect ATN in pharmaceutical formulations.

3.6. Real Sample Analysis

The high-performance carbon paste electrode modified with rGO/TiO2 was successfully applied to measure ATN in pharmaceutical preparations (100 mg per tablet) using SWV and CV. The ATN tablets were ground into powder, dissolved in H2SO4 0.1 mol L−1 solution, filtered, and then diluted so that the ATN concentration was in the working range. A standard addition method was applied to measure accuracy. Table 2 summarizes the data from the examined samples utilizing the functionalized CPE/rGO/TiO2 nano-composite sensors. The results agreed well with the content marked on the label. The detected contents were 97.9 ± 6.0 mg and 124.7 ± 6.0 mg per tablet, respectively, for SWV and CV.
An ATN recovery test ranging from 65 µmol L−1 to 130 μmol L−1 was performed using square wave voltammetry. The recoveries in different samples ranged from 97.7% to 106%, with an RSD of 1.58%. These results indicate that the proposed method employing the developed nanosensors are suitable for practical applications.

4. Conclusions

In the current work, stable and durable modified carbon paste nanocomposite sensors based on CPE/TiO2 and CPE/rGO/TiO2 sensitively detected atenolol. We studied the electrochemical performance of the examined nanomodifier (using TiO2 nanoparticles and graphene oxide functionalized with TiO2) based on factors such as high electrical conductivity, high surface area, and good adsorptive characteristics. The CPE/rGO/TiO2 nanocomposite carbon paste sensor showed improved ATN detection in terms of its linearity range, detection limit, mean recovery percentage, and precision. The nanocomposite sensors successfully detected ATN in the pharmaceutical tablets. The sensors showed good capabilities, and the analytical data show that they can quickly detect ATN in routine control analyses.

Author Contributions

Conceptualization, E.H. and N.B.; methodology, E.H.; software, E.H.; validation, E.H., N.B. and M.V.; formal analysis, E.H.; investigation, E.H.; resources, S.C.; data curation, E.H.; writing—original draft preparation, E.H.; writing—review and editing, E.H. and N.B.; visualization, E.H.; supervision, N.B.; project administration, N.B.; funding acquisition, E.H. All authors have read and agreed to the published version of the manuscript.

Funding

This research received no external funding.

Institutional Review Board Statement

Not applicable.

Informed Consent Statement

Not applicable.

Data Availability Statement

Data are contained within the article.

Acknowledgments

The authors would like to thank all staff members at the University of Tirana who assisted us during this experimental study. We also thank AKKSHI (National Agency for Scientific Research and Innovation) for providing chemical reagents.

Conflicts of Interest

The authors declare no conflict of interest.

References

  1. Rajendra, N.G.; Vinod, K.G.; Munetaka, O.; Neeta, B. Differential pulse voltammetric determination of atenolol in pharmaceutical formulations and urine using nanogold-modified indium tin oxide electrode. Electrochem. Commun. 2006, 8, 65–70. [Google Scholar]
  2. Broli, N.; Vasjari, M.; Vallja, L.; Shehu, A.; Duka, S.; Cenolli, S. A carbon paste sensor modified with banana tissue for determination of atenolol in pharmaceutical tablets. J. Hyg. Eng. Des. 2022, 149–154. Available online: https://keypublishing.org/jhed/wp-content/uploads/2022/04/03.-Full-paper-Nevila-Broli.pdf (accessed on 14 July 2024).
  3. Broli, N.; Vasjari, M.; Vallja, L.; Duka, S.; Shehu, A.; Cenolli, S. Electrochemical determination of atenolol and propranolol using a carbon paste sensor modified with natural ilmenite. Open Chem. 2021, 19, 875–883. [Google Scholar] [CrossRef]
  4. Nimisha, J.; Rajeev, J.; Swati, S.; Kshiti, S. Recent trends in electrochemical sensors for multianalyte detection—A review. Talanta 2016, 161, 894–916. [Google Scholar]
  5. Radi, A.; Wassel, A.A.; El Ries, M.A. Adsorptive behavior and voltammetric analysis of propranolol at carbon paste electrode. Chem. Anal. 2004, 49, 51–58. [Google Scholar]
  6. Sartori, E.R.; Medeiros, R.A.; Rocha-Filho, R.C.; Fatibello-Filho, O. Square-wave voltammetric determination of propranolol and atenolol in pharmaceuticals using a boron-doped diamond electrode. Talanta 2010, 81, 1418–1424. [Google Scholar] [CrossRef] [PubMed]
  7. Nurdina, M.; Prabowoa, O.A.; Arhamb, Z.; Wibowoc, D.; Maulidiyaha, M.; Saadd, S.K.M.; Umar, A.A. Highly sensitive fipronil pesticide detection on ilmenite (FeO·TiO2)-carbon paste composite electrode. Surf. Interfaces 2019, 16, 108–113. [Google Scholar] [CrossRef]
  8. Uslu, B.; Ozkan, S.A. Electroanalytical methods for the determi- nation of pharmaceuticals: A review of recent trends and developments. Anal. Lett. 2011, 44, 2644–2702. [Google Scholar] [CrossRef]
  9. Taylor, K.M.L.; Rieter, W.J.; Lin, W. Manganese-based nanoscale metal−organic frameworks for magnetic resonance imaging. J. Am. Chem. Soc. 2008, 130, 14358–14359. [Google Scholar] [CrossRef] [PubMed]
  10. Nurdina, M.; Agusub, L.; Putraa, A.A.M.; Maulidiyaha, M.; Arhamc, Z.; Wibowoa, D.; Muzakkar, M.Z.; Umar, A.A. Synthesis and electrochemical performance of graphene-TiO2-carbon paste nanocomposites electrode in phenol detection. J. Phys. Chem. Solids 2019, 131, 104–110. [Google Scholar] [CrossRef]
  11. Currie, L.A. and Svehla, G. Nomenclature for the presentation of results of chemical analysis. Pure Appl. Chem. 1994, 66, 595–608. [Google Scholar] [CrossRef]
  12. Swati, S.; Nimisha, J.; Rajeev, J. Development of Electrochemical Sensor for Simultaneous Quantification of Atenolol and Losartan Potassium. Nanosci. Technol. 2018, 5, 1–13. [Google Scholar] [CrossRef]
  13. Roopa, H. Patil, Rajesh N. Hegde, and Nandibewoor S.T. Voltammetric Oxidation and Determination of Atenolol Using a Carbon Paste Electrode. Ind. Eng. Chem. Res. 2009, 48, 10206–10210. [Google Scholar]
  14. Tajik, S.; Beitollahi, H.; Mohammadi, S.Z.; Nejad, F.G.; Dourandish, Z. Voltammetric sensor based on a Ni-Co-layered double hydroxide/multi-walled carbon nanotubes nanocomposite for 4-aminophenol determination. Chem. Phys. Impact 2024, 8, 100653. [Google Scholar] [CrossRef]
  15. Babaei, A.; Mirzakhani, S.; Khalilzadeh, B. A Sensitive Simultaneous Determination of Epinephrine and Tyrosine using an Iron(III) Doped Zeolite-Modified Carbon Paste Electrode. J. Braz. Chem. Soc. 2009, 20, 1862–1869. [Google Scholar] [CrossRef]
Figure 1. Proposed mechanism for electro-oxidation of ATN [2].
Engproc 73 00001 g001
Figure 2. CVs obtained with (a) bare CPE and (b) CPE/TiO2 in different [Fe(CN)6] 3−/4 concentrations, with an acetate buffer solution of pH 4.9 at a scan rate of 100 mV/s.
Engproc 73 00001 g002
Figure 3. SWV obtained at the surface of the unmodified electrode (CPE), CPE/TiO2, and CPE/rGO/TiO2, in a 0.1 M H2SO4 solution with pH 2.0 in 930 μmol L−1 of atenolol, frequency 30 Hz, and amplitude 50 mV (sweep rate: 100 mV/s; preconcentration time: 150 s).
Engproc 73 00001 g003
Figure 4. The SWV anodic peak current of 1500 µmol L−1 ATN was obtained at CPE/GO/TiO2 in different supporting electrolytes and pH.
Engproc 73 00001 g004
Figure 5. SW voltammograms obtained with CPE/TiO2 in 1500 µmol L−1 ATN and 0.1M H2SO4 solution (pH 2): (A) applying a frequency of 10 Hz to 60 Hz and (B) an amplitude of 10 mV to 100 mV.
Engproc 73 00001 g005
Figure 6. SWVs obtained at CPE/TiO2 in 0.1 M H2SO4 (pH = 2.0) containing various concentrations of atenolol (from 1.7 to 3185 µM). Inset: a plot of the anodic current as a function of ATN concentration (work area and linear zone).
Engproc 73 00001 g006
Figure 7. SWVs obtained at CPE/rGO/TiO2 in 0.1 mol L−1 M H2SO4 (pH = 2.0) containing various concentrations of atenolol (6.6 to 909 µM). Inset: a plot of the anodic current as a function of ATN concentration (work area and linear zone).
Engproc 73 00001 g007
Table 1. The quantitative analytical results for the investigated sensors using the SWV technique.
SensorsDynamic Range
(µM)
Correlation Coefficient R2Sensitivity
(µA/µM)
LOD
(µM)
RSD
(%)
CPE36–5870.9980.312.725.0
CPE/TiO21.7–31850.9901.70.81.0
CPE/rGO/TiO26.6–9090.9955.90.10.6
Table 2. ATN detection in pharmaceutical formulations using the proposed SWV and CV methods with CPE/rGO/TiO2.
Sample ATN
(mg Tablet)
Label ValueSWV ATN (mg Tablet)RSD
(%)
CVRSD
(%)
1100.01071.3125.04.2
2100.0102.51.8127.83.8
3100.084.32.7121.34.5
Disclaimer/Publisher’s Note: The statements, opinions and data contained in all publications are solely those of the individual author(s) and contributor(s) and not of MDPI and/or the editor(s). MDPI and/or the editor(s) disclaim responsibility for any injury to people or property resulting from any ideas, methods, instructions or products referred to in the content.

