1. Introduction
The Clinical Dementia Rating Scale (CDR) rates dementia severity. Mild cognitive impairment (MCI) is considered a condition between normal aging and dementia. It is a common diagnosis in the older population with 14–18%. Individuals with MCI have a high risk of developing dementia compared to their non-impaired counterparts. Nearly one-third of all Alzheimer’s disease cases are imputable to control the risk factors. Hence, the early detection of MCI is essential. Several clinically significant findings, including decreasing gradual loss of cognitive impairment, reducing the unhealthy conditioned life years, and improving the well-being of life, have been reported for the early detection of MCI cases [
1,
2].
The present research focuses on examining the interconnection between CDR scores and expert MCI diagnosis. It helps in determining the baseline CDR values prognostic of cognition or functional decline and also the progression to dementia. There are various methods to analyze the CDR score and dementia severity, such as statistical methods, machine learning, and deep-learning techniques, which have been used to assess cognitive impairment. A classification accuracy of 95% has been reported for the Alzheimer’s Disease Neuroimaging Initiative (ADNI) CDR dataset using support vector machine and random forest classifiers [
3,
4,
5]. Convolutional neural networks (CNNs) have achieved a classification accuracy of 99% on the ADNI dataset for the binary classification of AD and cognitively normal (CN) [
6].
A cellular automata (CA) approach has been employed for classification problems. Cellular automata are discrete and abstract computational systems that allow simulations of spatially distributed phenomena and their dynamics over time. It has proved beneficial as a general complexity model and a more specific representation of non-linear dynamics [
7]. CAs are used in modeling biological systems, such as virus evolution, gene mutation, kidney models, heart dynamics, brain dynamics, and the spread of disease [
8,
9]. CA is composed of a cell grid. Each cell in the grid can be in one of a predefined set of feature values, and computation is carried out by updating the state values using a diffused rule. These rules are defined based on the interaction of neighbor cells [
10,
11]. A CA framework has been utilized in the algorithm to warm the automata cells. The obtained characteristic heat map for the classes in the data has been classified using machine learning models [
12,
13].
The Game of Life has been used to capture the behavior of the evolution of several million neurons. The interactions between neurons have been achieved through signal transfer logic. It has been compared with brain dynamics [
14]. Elementary cellular automata (ECA) transition rules have been categorized from the cognitive control versus schizotypy spectrum phase space. The interpreted cellular automaton behavior regarding creativity is expressed as the Derrida coefficient in four regions [
15]. A mathematical model has been developed for the progress of Alzheimer’s disease with the CA network and Puri-Li differential equations. It has explained the internal behavior within the hippocampus. It is also observed that the neuron states are more sensitive to astroglia variations when compared to microglia variations [
16].
Over the past several years, several elucidations have been proposed to address the translucency deficit in deep learning models. One of the best methods is explainable artificial intelligence (XAI) solutions. Local explainable model-agnostic explanation (LIME) has been widely acquired to provide an interpretable technique used for machine learning black-box models. LIME is proficient in differentiating effectual features based on the supporting or not supporting of cells in a particular class from the input image [
17,
18].
In this paper, the clinical dementia rating between healthy and unhealthy (dementia) subjects is classified using the CA framework. The result has been interpreted based on the importance of CDR features from evolved CA images.
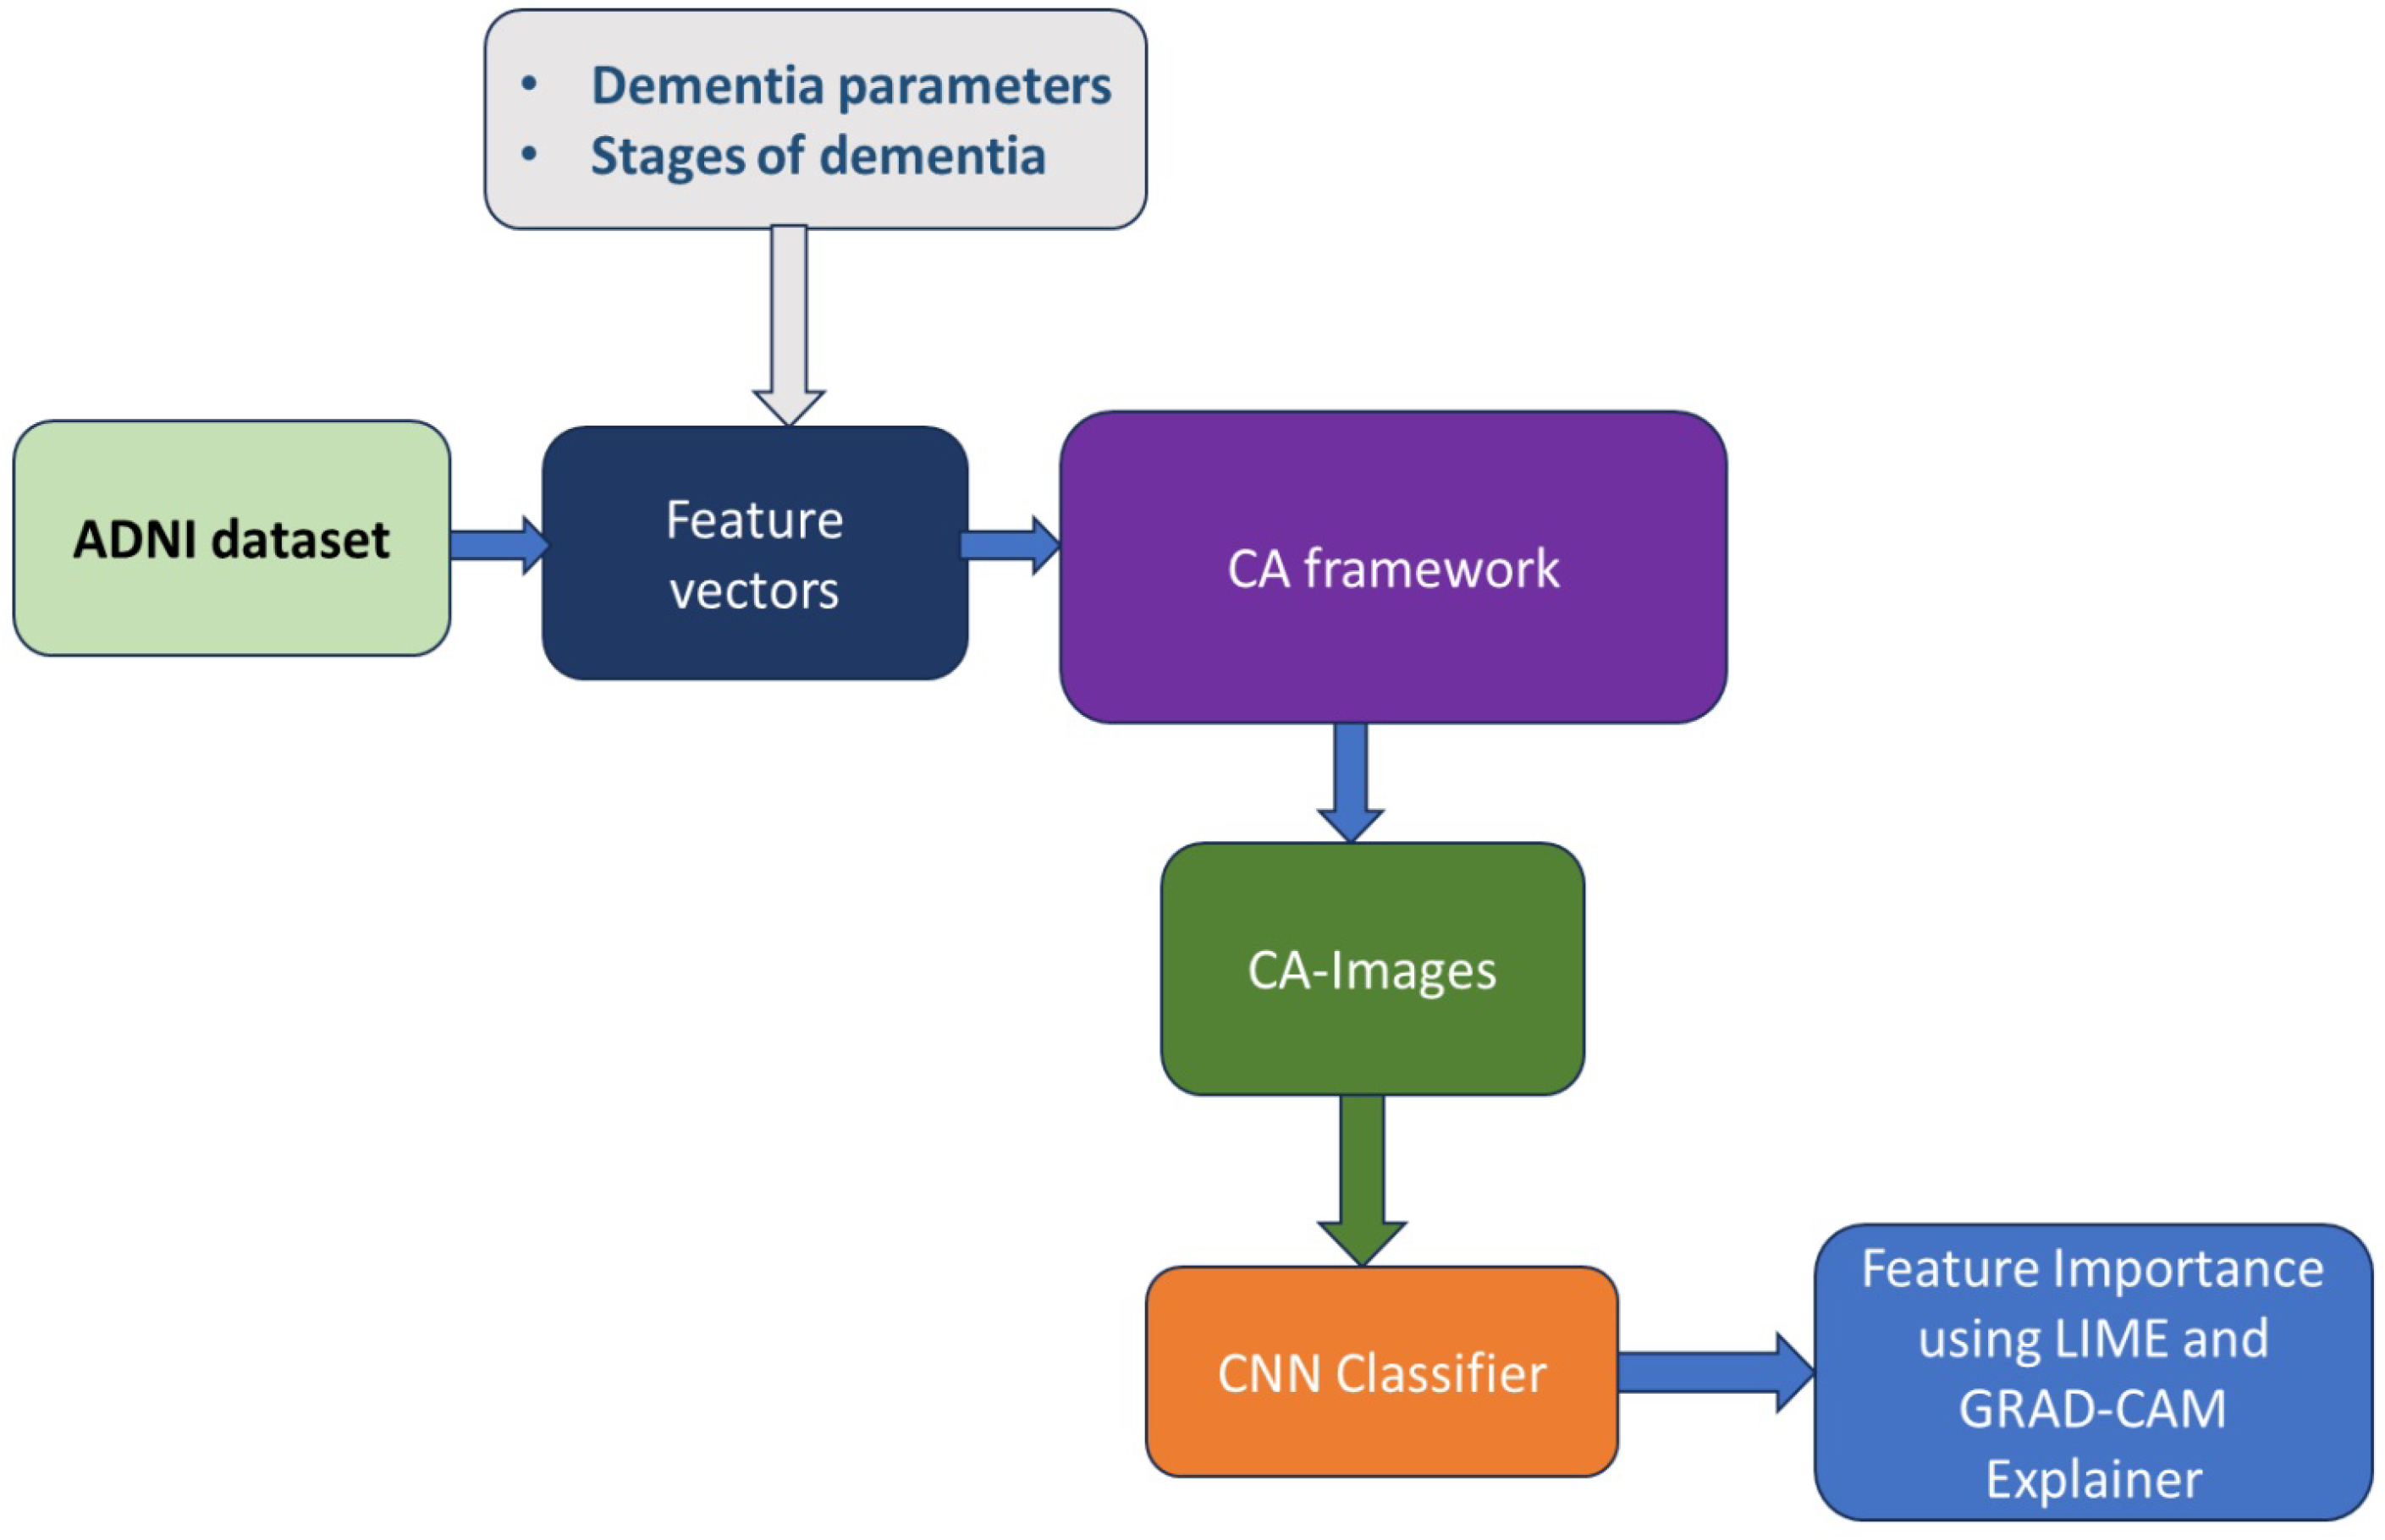
Feature importance has been interpreted using GRAD-CAM and LIME. The contributions of the proposed work are as follows:
- (a)
Application of cellular automata framework for dementia classification;
- (b)
Explaining the feature’s importance using image representation.
2. Materials and Methods
Figure 1 shows the block diagram of the proposed work using the cellular automata framework and explainable AI. In this study, a CA framework for the classification problem has been proposed. The method is based on forming classes in cellular automata by interacting with neighborhood cells. Initially, the training data instances are assigned to the cells of a cellular automaton. The state of a cell denotes the class assignment of that point in the instance space. At the beginning of the process, only the cells with a data instance have features. However, these features are spread to the neighbor cells based on a rule inspired by the diffusion process in nature. The proposed CA method has utilized an algorithm to diffuse the cells of the grid and obtain an evolution of CA images for the classes in the dataset [
12,
13].
The ADNI dataset has been used in the proposed work for the feature vector based on the brain function and CDR. The preprocessing of the ADNI dataset has been performed to identify and handle missing data, extract relevant features for the CDR scale, and remove the patient ID for privacy and ethical standards.
The CDR from the ADNI dataset comprising 1000 subjects depicted in
Table 1 has been preprocessed for the six features and five classes. CDR evaluates cognitive and functional performance across six domains: memory, orientation, judgment, community affairs, homes and hobbies, and personal care. The five classes are as follows: no dementia, as no cognitive impairment (NCI); questionable dementia, as questionable cognitive impairment (QCI); low dementia, as low cognitive impairment (LCI); moderate dementia, as moderate cognitive impairment (MCI); and severe dementia, as severe cognitive impairment (SCI)). The dataset is multi-class but the classification problem is between healthy and unhealthy. Hence, no dementia is considered a healthy case, and the remaining dementia stages are considered unhealthy or dementia cases.
A subject is assigned to a CA cell grid. The number of rows in the cell grid is a feature, and m is the tuning parameter that gives the number of cells in each row. The six featured values from each subject have been assigned to the 6 × m cell grid in a systematic procedure using the transfer function depicted in Equation (
1). When an indexed cell in the CA grid receives a feature value from a subject, the cell and its neighbors are diffused based on a transfer function. The maximum and minimum values of the feature associated with grid dimension are
and
in the dataset,
is the index of the cell for a
subject that has
feature value, as calculated from the given Equation (
1). For a data instance, an example subject with feature values has been assigned to the 6 × 5 CA cell grid, as shown in
Figure 2.
The feature value distribution in the CA grid from the initialized cell to the neighboring cells in the row has a diffusion rate of
to
. Each subject and class in the dataset have been mapped with a CA grid, and a redistributed transfer procedure has been applied per the specified rule. The redistribution process has been depicted in
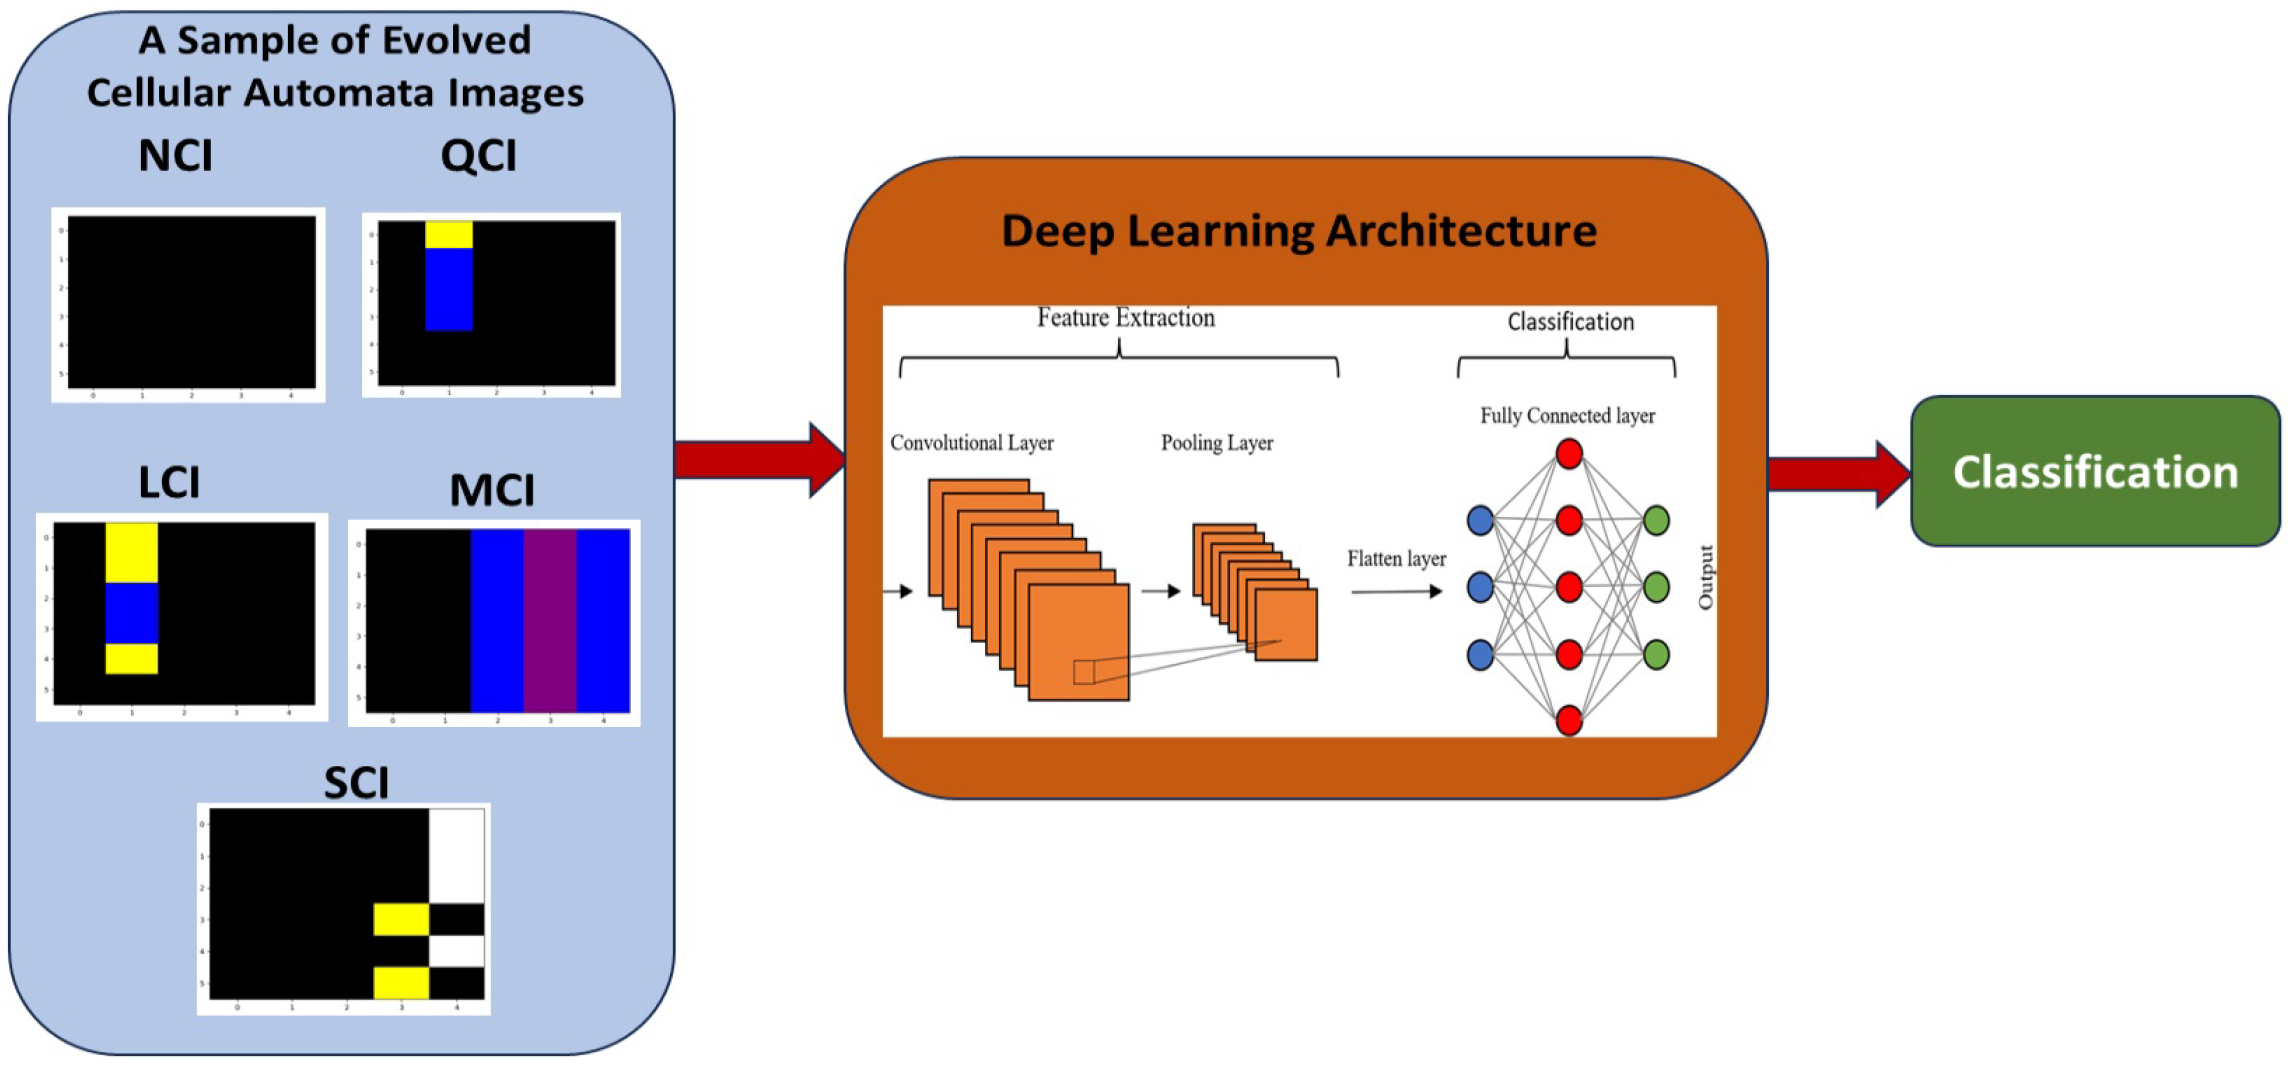
Figure 3 along with the steps involved in the diffusion process. The diffusion of the cell in each row has been transferred to the neighboring left and right cells till it reaches the end of the cell grid based on the diffusion rate. Hence, evolutionary CA images have been obtained for all the subjects and diffusion rates at the end of the procedure. The evolved CA images for healthy and unhealthy data have been classified using deep learning techniques.
The block diagram of the convolutional neural network (CNN) classification for the obtained CA patterns obtained from the ADNI dataset has been shown in
Figure 4. The redistributed CA images have been divided into 70% as training data (i.e., 350 healthy and 350 unhealthy) and 30% as testing data, i.e., 150 healthy and 150 unhealthy. The deep learning architecture constituting two layers of Conv2d has been modeled to classify the CA images with and without cognitive impairment and then connected to flattened and dense layers, which produces prediction and classification of the images. Hyperparameters, such as filters and kernel sizes, have been used to optimize a CNN model’s performance to learn relevant features from input data. The Adam optimizer with 35 epochs and sparse categorical cross entropy was used for hyper-tuning the parameters. The explainability and interpretability of features for the CA images have been obtained from GRAD-CAM and LIME explainers.
3. Results
The ADNI dataset with six features and healthy and unhealthy classes has been transformed into redistributed evolved CA images. These CA images have been classified using deep learning architecture. The classification accuracy for varying diffusion rates is shown in
Table 2. The classification accuracy is 99% without diffusion of the evolved CA images. Classification accuracy remains the same as 99% at a diffusion rate of 0.2, 0.3, 0.4, 0.5, and 0.6. The hyper-tuning of the filter and kernel sizes in the CNN model for the healthy and unhealthy cases for various diffusion parameters from 0 to 0.6 has given a better classification accuracy.
Memory, orientation, and judgment/problem-solving are cognition features in the image’s upper half. Community affairs, home/hobbies, and personal care features come under the lower half of the image [
2]. The severity of the cognitive impairment increases from left to right of the image, as does the color intensity. CA images have been divided into four regions. The right top represents moderate to severe dementia, and the left top represents questionable to low dementia for feature condition impairment. The right bottom represents low to moderate dementia, and the left bottom represents no to questionable dementia for feature functional impairment.
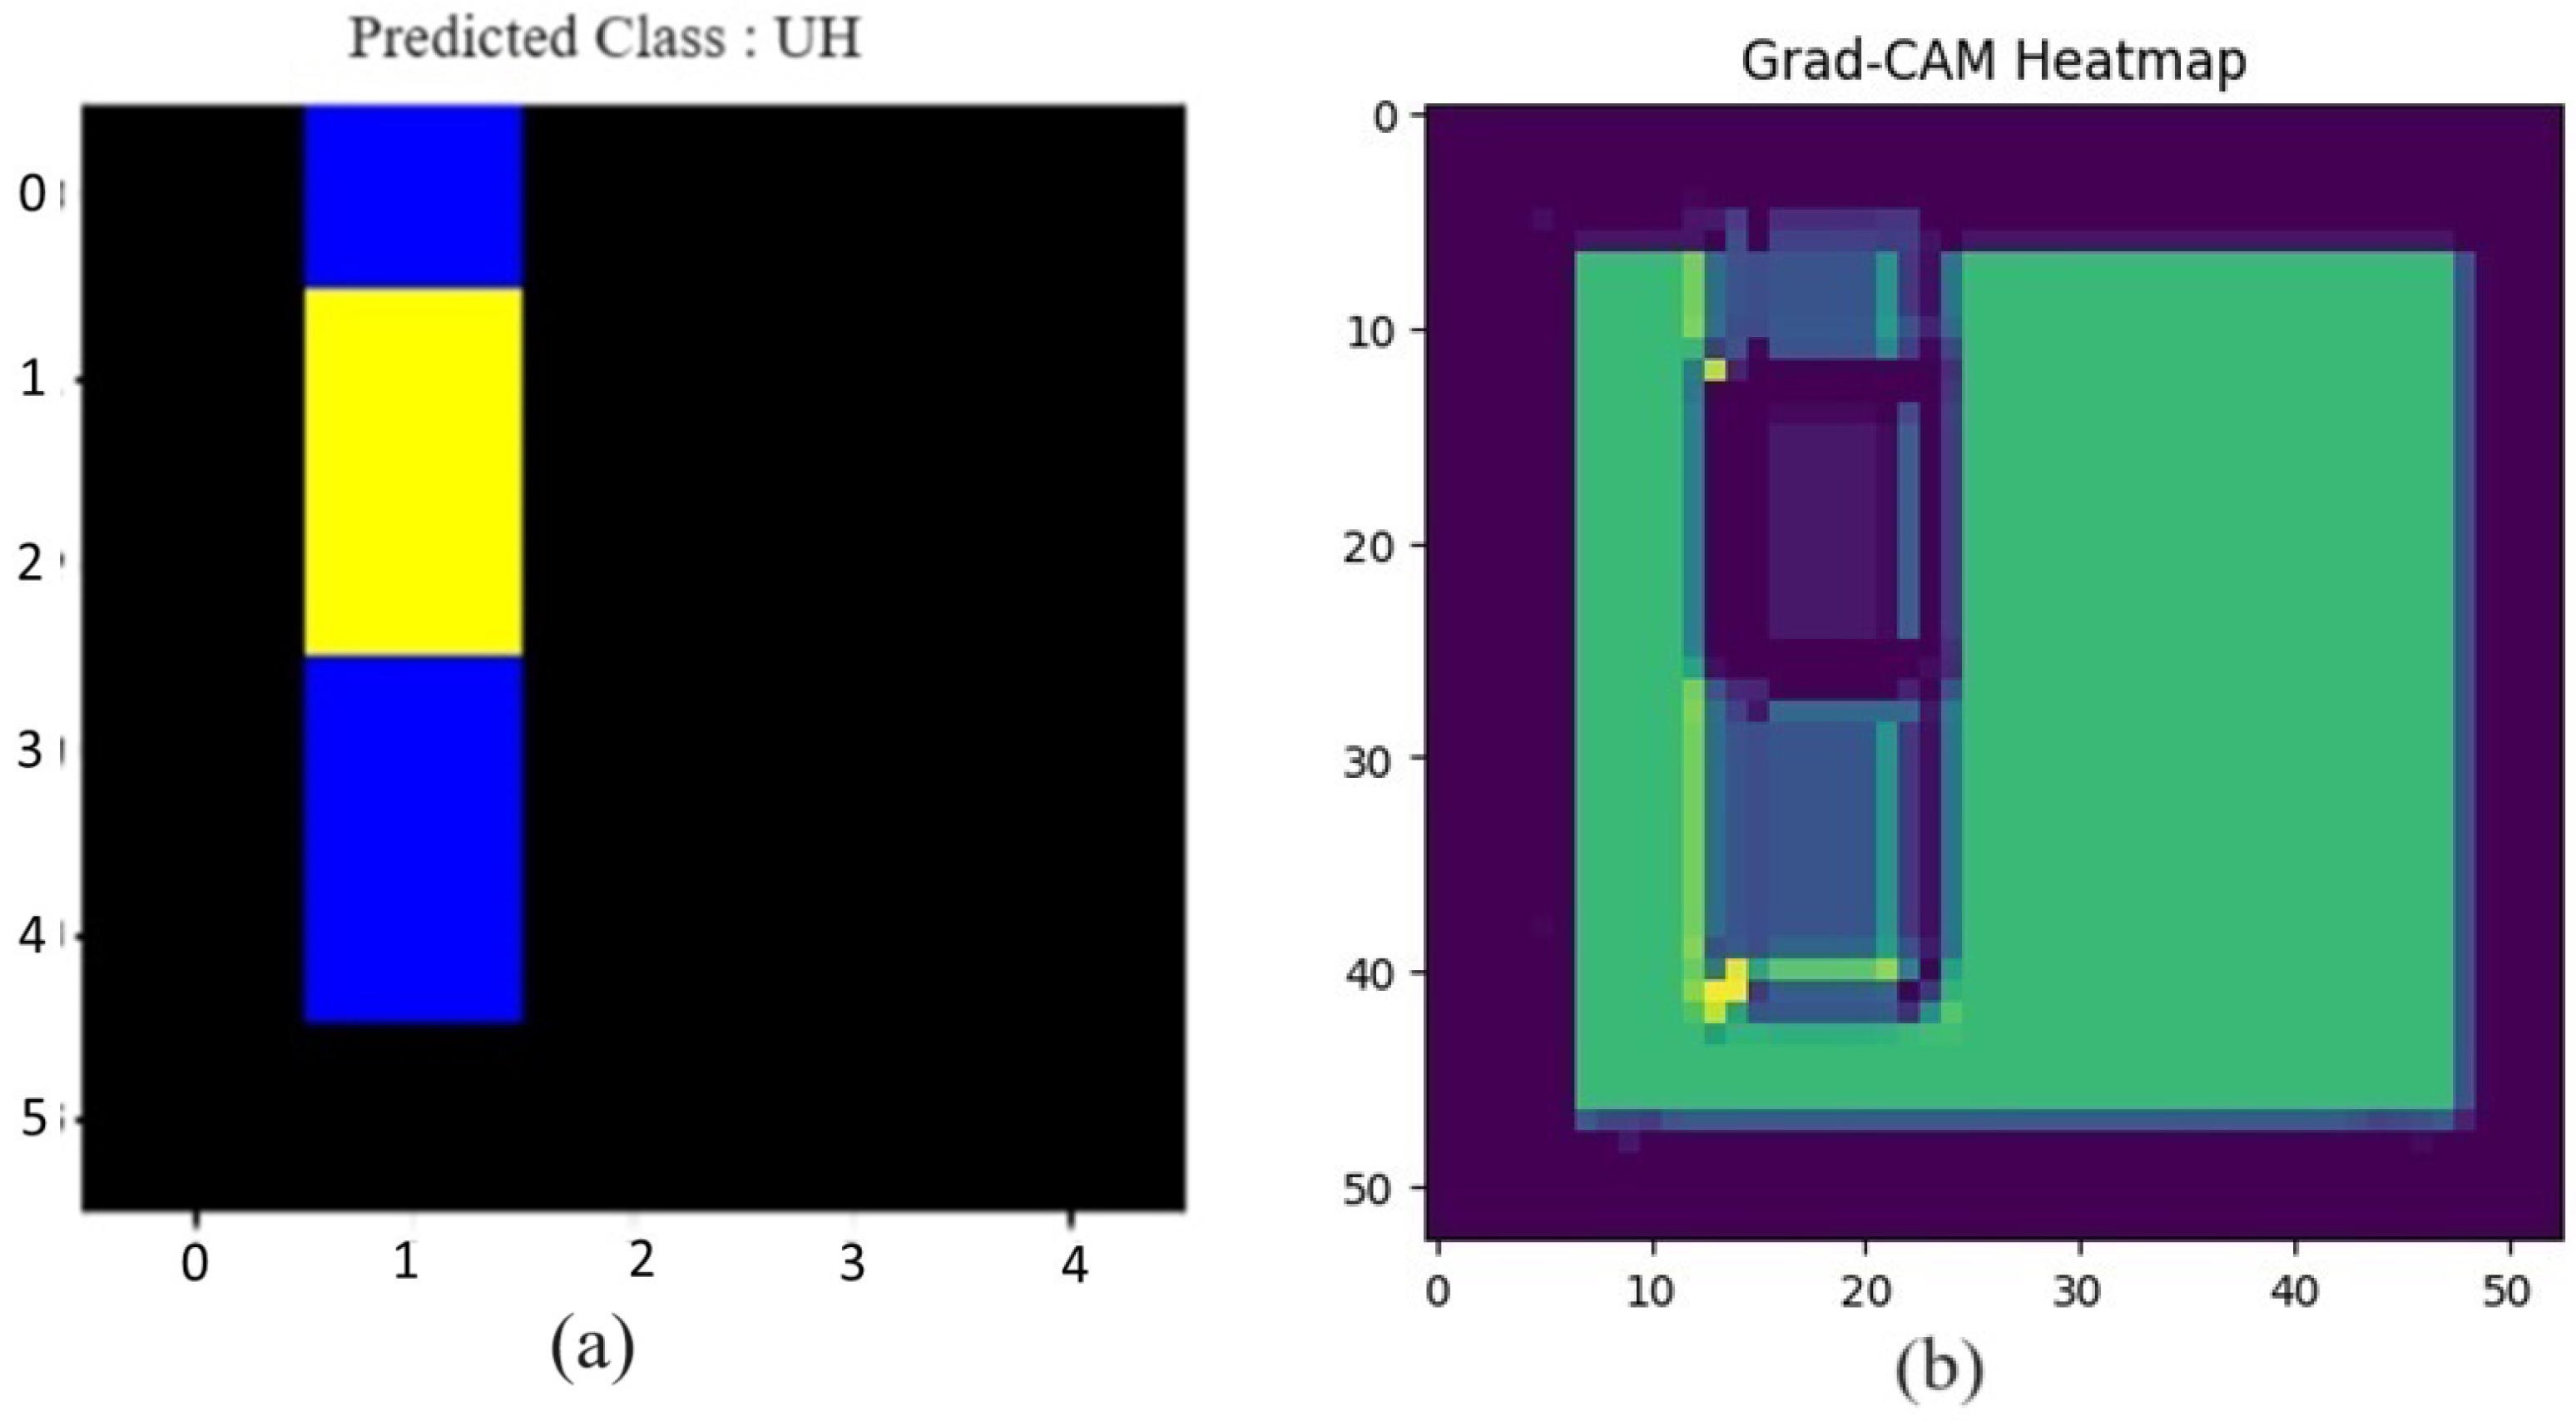
The CA image predicted as unhealthy, shown in
Figure 5a with 20% diffusion rate, has been considered, and its GRAD-CAM heat map has been depicted in
Figure 5b. The colors in the cells are towards the left side, which indicates a low dementia region. The upper half of the images shows cognition impairment (high priority), and the lower half represents functional impairment (low priority). The yellow cells in the GRAD-CAM image are of high importance. The left side of the image is yellow, which shows that the feature values are low, leading to low dementia.
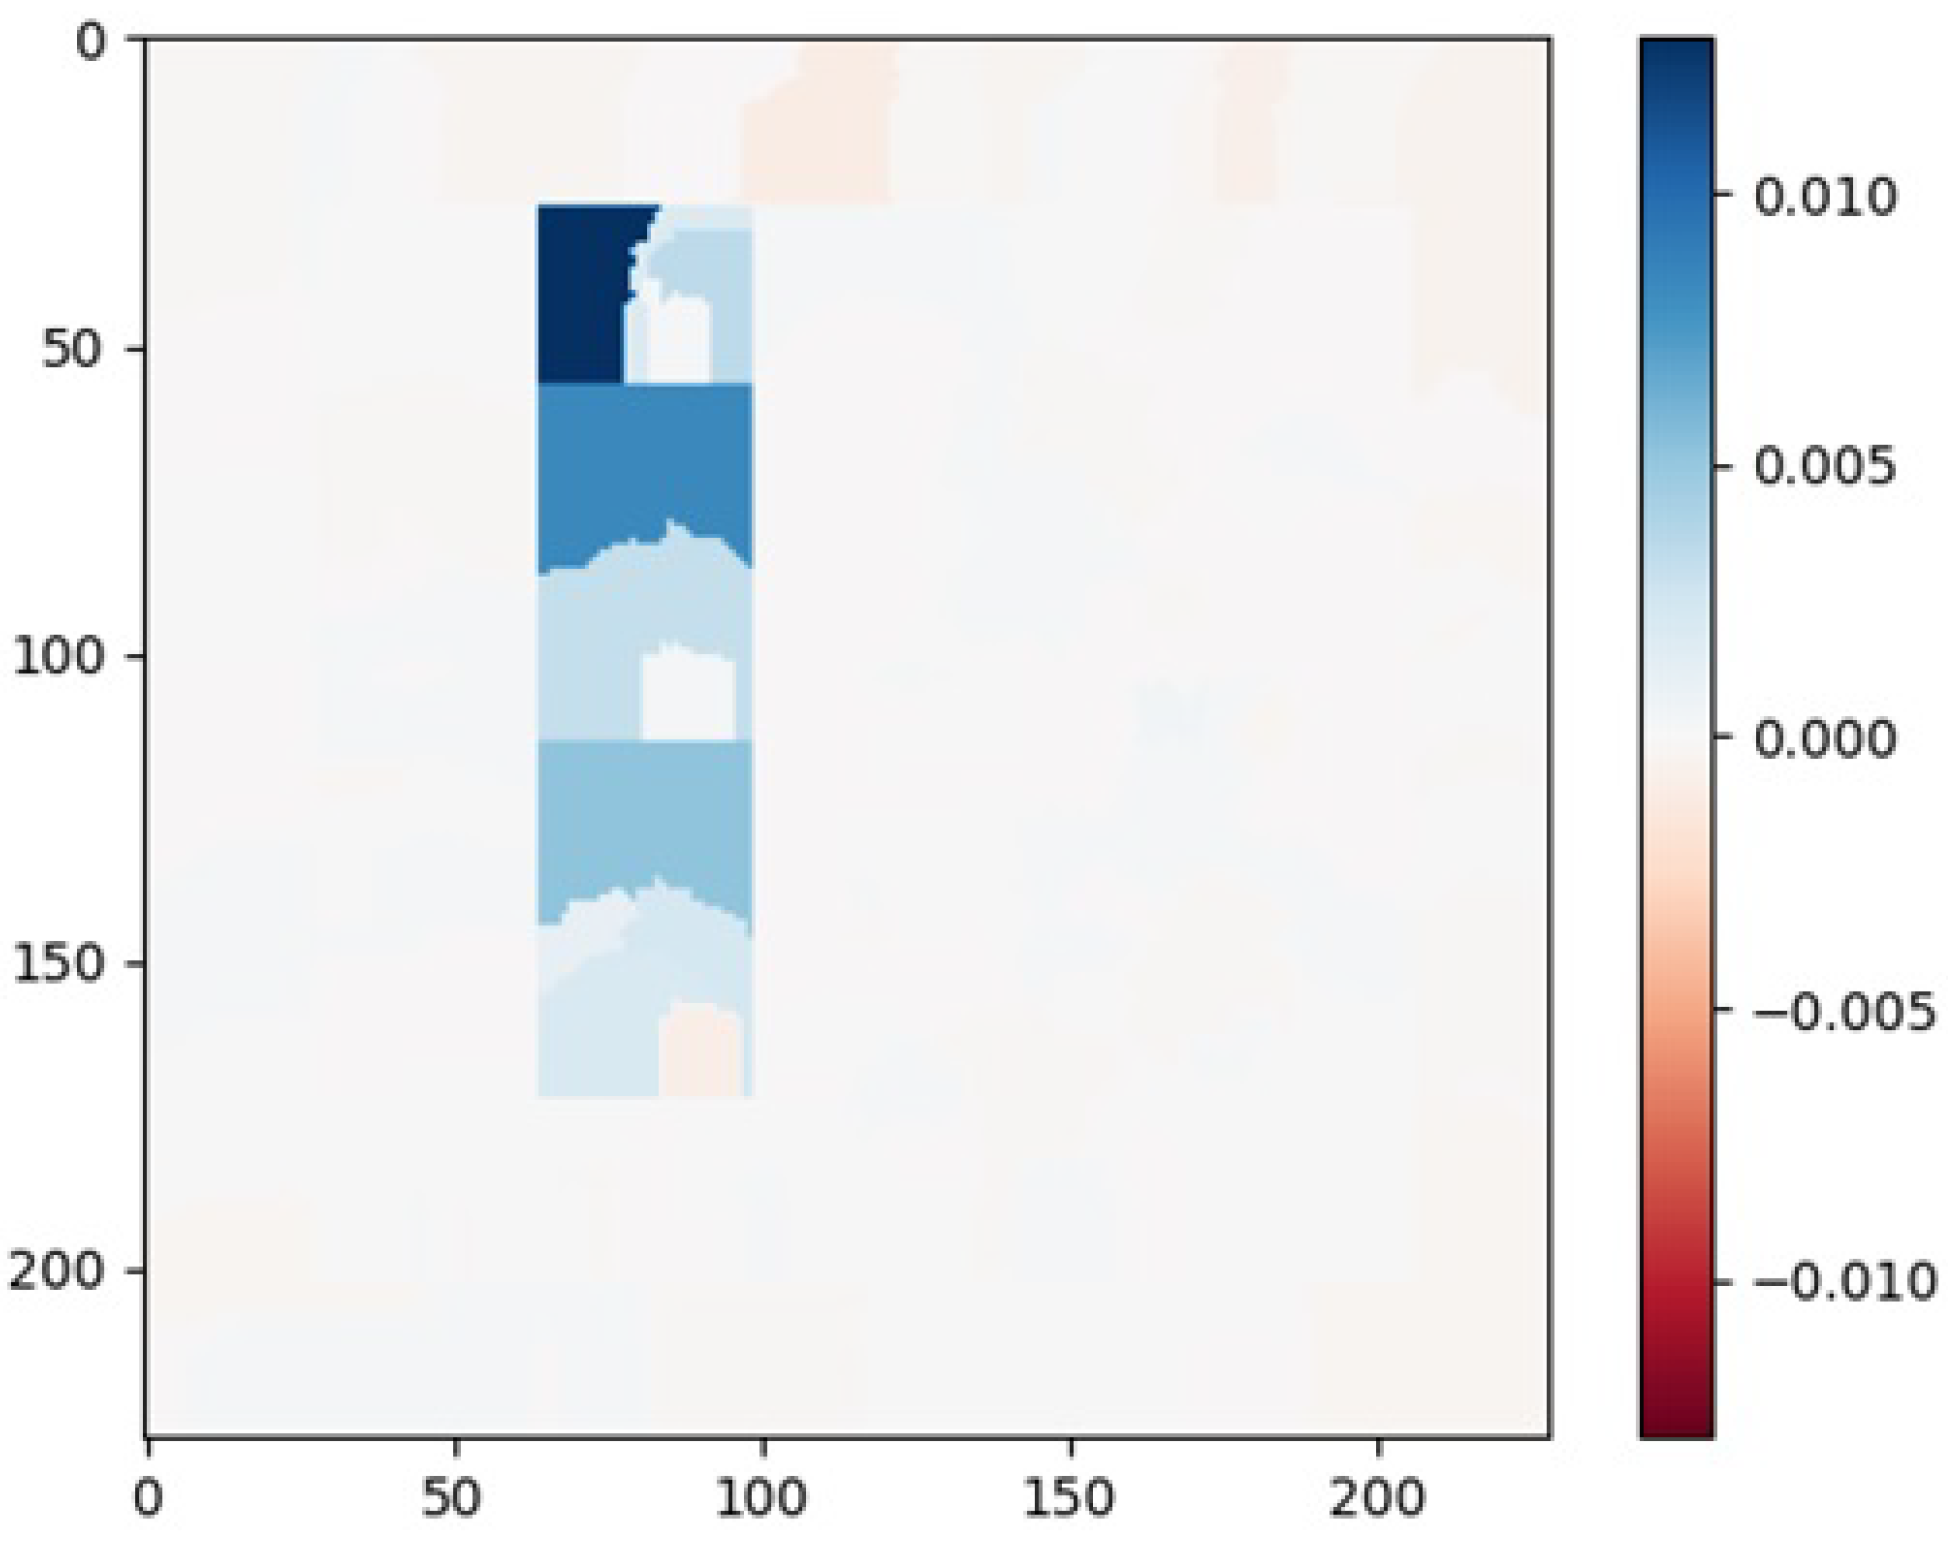
The LIME explanation is shown in
Figure 6. It has been observed that the left top of the LIME image gives high importance to the cognition features towards the left side, leading to low dementia. Orientation and judgment play a significant role in predicting low dementia and later memory; community affairs, hobbies, and personal care follow in order.
4. Discussion
Classifying healthy and unhealthy cognitive impairment for the 1000 subjects from the ADNI dataset has given promising accuracy for various diffusion rates. The accuracy is high at the diffusion rate between 0 and 0.6 diffusion rates in the CA cell grid of each subject. The redistribution of feature values in the 6 × 5 cell grid of each subject leads to classifying the dementia severity. The diffusion of the featured valued cell evolved in each row gives better accuracy and interpretability. The proposed algorithm has been shown to perform consistently when diffusion rates are varied. The classification accuracy of 99% has been achieved in all cases.
The feature importance from the LIME explainer demonstrated a superior ability to detect changes in measures of functional and cognitive ability. Comparisons of the feature importance of the CA image with GRAD-CAM and LIME yielded similar explanations. However, the unique contribution of the cellular automata framework is its ability to evolve an explainable CA image, with feature contribution indicated by color intensity and importance. This study underscores the greater importance of the evolved CA images and cognition in predicting cognitive impairment for many subjects. With its higher accuracy under various diffusion rates, the cellular automata framework is a novel and valuable tool for identifying individuals with healthy and unhealthy cognitive impairment.
The proposed classification algorithm and the LIME-based interpretation help clinicians to study the progressive nature of dementia.
5. Conclusions
This paper proposes a cellular automata framework for classifying cognitive impairment based on CA patterns. The conversion process from features of data instances to CA images has evolved by diffusion in nature. The approach is tested on the ADNI dataset with different diffusion rates, and promising results have been obtained with a consistency accuracy of 99% using deep learning architecture. The importance of the features for cognitive impairment has been explained and interpreted using GRAD-CAM and LIME.
Author Contributions
Conceptualization, S.M.R.K., N.S. and H.R.; methodology, S.M.R.K., N.S. and H.R.; software, S.M.R.K.; validation, S.M.R.K., N.S. and H.R.; writing—original draft preparation, S.M.R.K.; writing—review and editing, S.M.R.K., N.S. and H.R.; visualization, S.M.R.K., N.S. and H.R.; supervision, N.S. and H.R. All authors have read and agreed to the published version of the manuscript.
Funding
This research received no external funding.
Institutional Review Board Statement
Not applicable.
Informed Consent Statement
Not applicable.
Data Availability Statement
Acknowledgments
Data used in the preparation of this article were obtained from the Alzheimer’s Disease Neuroimaging Initiative (ADNI) database (adni.loni.usc.edu). As such, the investigators within the ADNI contributed to the design and implementation of ADNI and/or provided data but did not participate in the analysis or writing of this report. A complete listing of ADNI investigators can be found at:
http://adni.loni.usc.edu/wp-content/uploads/how_to_apply/ADNI_Acknowledgement_List.pdf (accessed on 4 January 2024).
Conflicts of Interest
Author Hariharan Ramasangu was employed by the company Relecura Technologies Pvt. Ltd. The remaining authors declare that the research was conducted in the absence of any commercial or financial relationships that could be construed as a potential conflict of interest.
References
- Ravaglia, G.; Forti, P.; Lucicesare, A.; Rietti, E.; Pisacane, N.; Mariani, E.; Dalmonte, E. Prevalent depressive symptoms as a risk factor for conversion to mild cognitive impairment in an elderly Italian cohort. Am. J. Geriatr. Psychiatry. 2008, 16, 834–843. [Google Scholar] [CrossRef] [PubMed]
- Woolf, C.; Slavin, M.J.; Draper, B.; Thomassen, F.; Kochan, N.A.; Reppermund, S.; Crawford, J.D.; Trollor, J.N.; Brodaty, H.; Sachdev, P.S. Can the clinical dementia rating scale identify mild cognitive impairment and predict cognitive and functional decline? Dement. Geriatr. Cogn. Disord. 2016, 41, 292–302. [Google Scholar] [CrossRef] [PubMed]
- Kleiman, M.J.; Barenholtz, E.; Galvin, J.E.; Alzheimer’s Disease Neuroimaging Initiative. Screening for early-stage Alzheimer’s disease using optimized feature sets and machine learning. J. Alzheimer’s Dis. 2021, 81, 355–366. [Google Scholar] [CrossRef] [PubMed]
- Khan, A.; Zubair, S.; Khan, S. A systematic analysis of assorted machine learning classifiers to assess their potential in accurate prediction of dementia. Arab. Gulf J. Sci. Res. 2022, 40, 2–24. [Google Scholar] [CrossRef]
- AlMansoori, M.E.; Jemimah, S.; Abuhantash, F.; AlShehhi, A. Predicting early Alzheimer’s with blood biomarkers and clinical features. Sci. Rep. 2024, 14, 6039. [Google Scholar] [CrossRef] [PubMed]
- AbdulAzeem, Y.; Bahgat, W.M.; Badawy, M. A CNN based framework for classification of Alzheimer’s disease. Neural Comput. Appl. 2021, 33, 10415–10428. [Google Scholar] [CrossRef]
- Graudenzi, A.; Maspero, D.; Damiani, C. Modeling spatio-temporal dynamics of metabolic networks with cellular automata and constraint-based methods. In Proceedings of the International Conference on Cellular Automata, ACRI 2018, Como, Italy, 17–21 September 2018; Springer: Berlin/Heidelberg, Germany, 2018; pp. 16–29. [Google Scholar]
- Jin, S.; Xu, L.; Xu, C.; Ma, D. Lane width-based cellular automata model for mixed bicycle traffic flow. Comput.-Aided Civ. Infrastruct. Eng. 2019, 34, 696–712. [Google Scholar] [CrossRef]
- Matsuya, K.; Murata, M. Spatial pattern of discrete and ultradiscrete Gray-Scott model. arXiv 2013, arXiv:1305.5343. [Google Scholar] [CrossRef]
- Ohmori, S.; Yamazaki, Y. Cellular Automata for Spatiotemporal Pattern Formation from Reaction–Diffusion Partial Differential Equations. J. Phys. Soc. Jpn. 2016, 85, 014003. [Google Scholar] [CrossRef]
- MARTinez, G.J.; Morita, K. Conservative Computing in a One-dimensional Cellular Automaton with Memory. J. Cell. Autom. 2018, 13, 325–346. [Google Scholar]
- Uzun, A.O.; Usta, T.; Dündar, E.B.; Korkmaz, E.E. A solution to the classification problem with cellular automata. Pattern Recognit. Lett. 2018, 116, 114–120. [Google Scholar] [CrossRef]
- Usta, T.; Dündar, E.B.; Korkmaz, E.E. A Cellular Automata based Classification Algorithm. In Proceedings of the ICPRAM, Prague, Czech Republic, 19–21 February 2019; pp. 155–162. [Google Scholar]
- Fraile, A.; Panagiotakis, E.; Christakis, N.; Acedo, L. Cellular automata and artificial brain dynamics. Math. Comput. Appl. 2018, 23, 75. [Google Scholar] [CrossRef]
- Adamatzky, A.; Wuensche, A. On creativity of elementary cellular automata. arXiv 2013, arXiv:1305.2537. [Google Scholar] [CrossRef]
- Jafari, N.; Sarbaz, Y.; Ebrahimi-kalan, A.; Golabi, F. Novel mathematical model based on cellular automata for study of Alzheimer’s disease progress. Netw. Model. Anal. Health Inform. Bioinform. 2022, 11, 26. [Google Scholar] [CrossRef]
- Bhattacharya, A. Applied Machine Learning Explainability Techniques: Make ML Models Explainable and Trustworthy for Practical Applications Using LIME, SHAP, and More; Packt Publishing Ltd.: Birmingham, UK, 2022. [Google Scholar]
- Zhang, X.; Chan, F.T.; Mahadevan, S. Explainable machine learning in image classification models: An uncertainty quantification perspective. Knowl.-Based Syst. 2022, 243, 108418. [Google Scholar] [CrossRef]
| Disclaimer/Publisher’s Note: The statements, opinions and data contained in all publications are solely those of the individual author(s) and contributor(s) and not of MDPI and/or the editor(s). MDPI and/or the editor(s) disclaim responsibility for any injury to people or property resulting from any ideas, methods, instructions or products referred to in the content. |
© 2024 by the authors. Licensee MDPI, Basel, Switzerland. This article is an open access article distributed under the terms and conditions of the Creative Commons Attribution (CC BY) license (https://creativecommons.org/licenses/by/4.0/).


