Abstract
This study explores the computational analysis of catalytic combustion in cylindrical reactors using the Finite Volume Method (FVM) within Ansys Fluent. Through the incorporation of a combustion channel to facilitate diesel combustion, Ansys Fluent is utilized to predict the fluid dynamics during catalytic combustion. An extensive reaction mechanism file containing all related reactions is added into Ansys Fluent to model the catalytic combustion of methane. In this study, the catalyzed combustion of a methane, hydrogen, and air mixture is simulated on a heated platinum wall within a cylindrical channel using a 2D axisymmetric solver. Two mechanism files are employed: one defining gaseous species and the other including surface species definitions and surface reactions. Volumetric reactions are excluded from this analysis. The cylindrical channel comprises three sections: inlet, catalytic, and outlet, with the catalyzed reactions occurring on the wall surface of the catalytic section. The simulation results exhibit a gradual decrease in the mass fraction of reactants as catalytic combustion proceeds within the chamber, accompanied by a simultaneous increase in product formation. In particular, the presence of a catalytic channel within the combustion chamber catalyzes the combustion reaction, resulting in a higher chamber temperature. This study also presents predicted mass fraction profiles for both reactants and combustion products, highlighting the efficiency of Computational Fluid Dynamics (CFD) simulations in predicting chemical processes, particularly catalytic combustion. This research contributes to the understanding of complex phenomena such as catalytic combustion and underscores the potential of CFD simulations in explaining complicated chemical processes.
1. Introduction
The soot unburnt carbonaceous material emission is a real fact from all IC engine processes due to high-temperature conditions. The assembly of those carbon nanoparticles entails a discount within the potency of combustion devices, also as the damaging impact on global climate change and human health [1]. Hence, a forceful reduction in the emissions is obligatory, strict in a deeper understanding of the formation method, which remains an associate degree open problem in combustion chemistry analysis. In recent years, ways for reducing soot emissions relied primarily on correlations, expertise, and trial-and-error tries. The progressive diffusion of the CFD permits research and optimization of combustion devices with satisfactory confidence [2]. The complexity of gas-phase chemistry and varied mechanisms concerned in the soot formation method, which includes commixture radioactive heat transfer and relies on the soot volume fraction itself, creates a prediction of soot emissions. This is still a difficult task, resulting in massive errors in exhaust concentration even by tiny mispredictions within formation rates [3]. Final concentrations of soot are determined through different mechanism steps such as initiation, coagulation, surface growth of nanoparticles, and oxidation. Although acceptable results are obtained on laminar diffusion flames, phenomena become too complicated when turbulent chemistry is involved in diesel engines, as the soot prediction models are applied to simple straight-chain hydrocarbons. In methane combustion, soot grows from small particles of carbon, while on most common roads, applicable fuel, such as diesel, that contains a large number of aromatics gives a large amount of soot [4]. This paper gives the details of different modeling techniques to predict soot formation involving turbulent chemistry during diesel combustion. CFD simulations are performed to analyze the combustion process to predict soot and compare it with different soot models.
2. CFD Modeling
The formation of soot and its reaction are complicated; the extraordinarily increased demand for the calculating time of elaborate models of soot makes it impossible to simulate the combustion of ICE. Later, many of the investigations were conducted in an exceedingly real configuration, like diesel engines using the procedure of coarse modeling schemes for the requirement of the benefit of straightforward application and the low machine value. With the new advances in engineering and the advances in different precise sub-models, it is currently attainable to obtain helpful assumptions and conceptions of advanced systems. Consequently, the arithmetic simulation of such advanced systems is considered in many fields. In the modeling of soot, many numerical approaches of simulations, CFD modeling, and phenomenological models are used. In phenomenological models, explain the formation of soot and reaction in terms that are beneficial for combustion simulations. The Moss-Brookes model used the equations and constants to compute soot concentration and formation dynamics in CFD simulations. The equations for the soot mass fraction transport and nuclei transport are given as [5]:
where is a soot mass fraction, is a soot mass concentration (kg/m3), is a normalized radical nuclei concentration = , is a soot particle number density , and = 1015 particles.
The formation of soot involves several key mechanisms. Nucleation marks the initial stage, where soot particles form primarily from acetylene (C2H2) as a precursor. Following this, surface growth occurs, during which soot particles grow larger by adsorbing gas-phase species such as acetylene and benzene. Subsequently, coagulation takes place, where soot particles collide and aggregate to form larger clusters. Finally, oxidation acts as a counterbalance, reducing soot mass by reacting with oxidizing agents like hydroxyl radicals (OH) or oxygen (O2), thereby breaking down the particles. Together, these mechanisms govern the dynamic behavior of soot formation and reduction in combustion processes.
The Moss-Brookes model was originally developed and validated for methane flames. To accommodate higher hydrocarbon fuels, an extended version known as the Moss-Brookes-Hall model has been integrated into the ANSYS FLUENT 2021 implementation. This extended model, as reported by Wen et al. [6], incorporates enhancements proposed by Hall et al. [7] and an oxidation model introduced by Lee et al. [8]. Hall’s work [7] focuses on a soot inception rate driven by the formation of two-ringed and three-ringed aromatic compounds, differing from the Moss-Brookes model, which assumes soot inception arises from acetylene or benzene for higher hydrocarbons. Hall et al. [7] proposed a soot inception rate based on the formation rates of aromatic compounds like naphthalene (C10H7) and (C14H10), derived from acetylene (C2H2), benzene (C6H6) and phenyl radical (C6H5), through the following mechanisms:
and
2C2H2 + C6H5 ⇌ C10H7 + H2
C2H2 + C6H6 + C6H5 ⇌ C14H10 + H + H2
Based on their laminar methane flame data, the inception rate of soot particles was given to be eight times the formation rate of species C10H7 and C14H10. Further details concerning the modeling of the formation mechanisms can be found in the ANSYS Fluent Theory Guide [9].
3. Simulation Setup
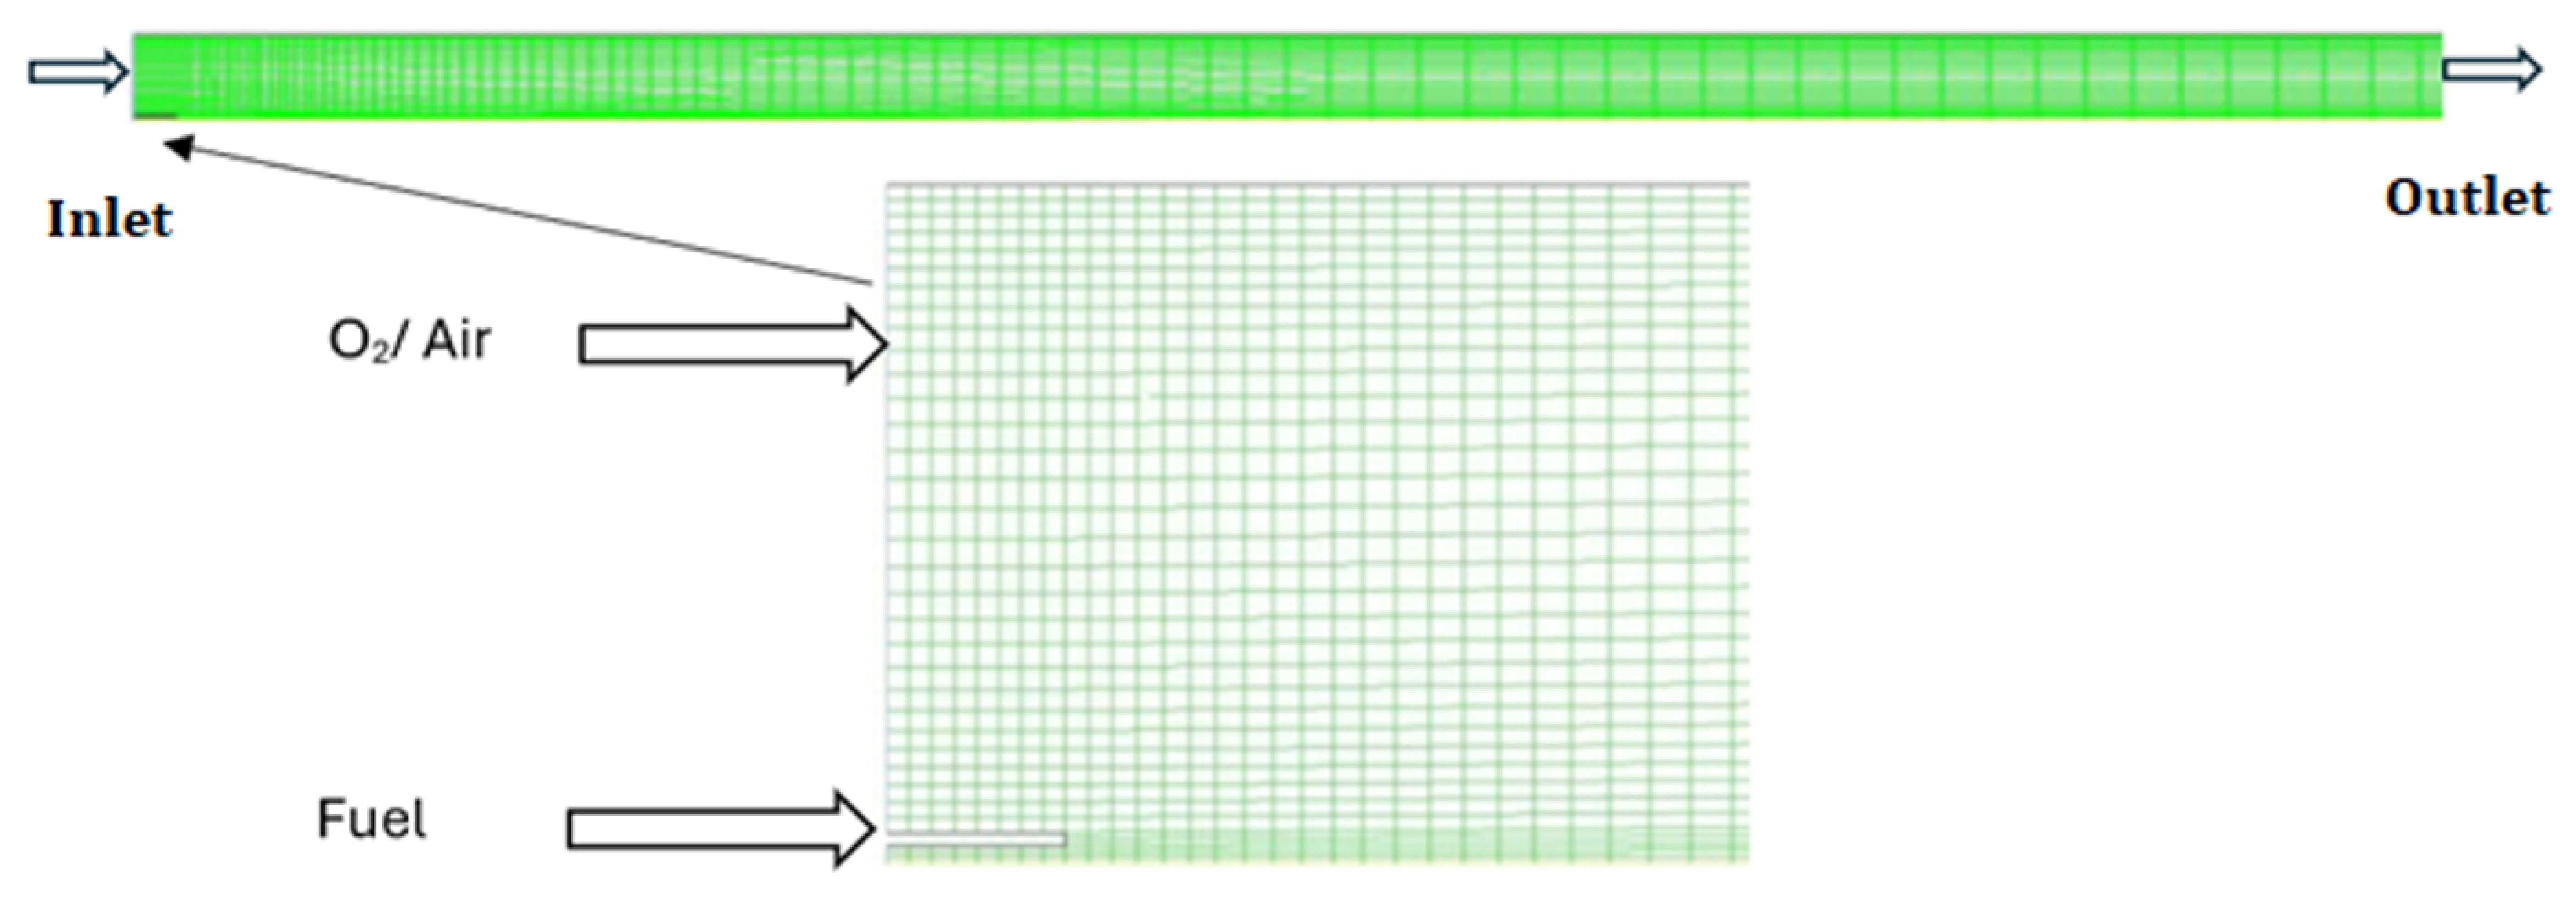
In this study, a simulation is performed of the combustion flame, and input values of different parameters are shown in Table 1. The diesel is represented by C10H22, having a C/H ratio very close to the investigational data. In the geometry of the model, the pre-evaporated is injected along the air through the inlet nozzle with the fuel inlet nozzle diameter of 5 mm, and the air enters the combustion zone by means of the nozzle (inlet air nozzle) having a diameter of 225 mm. Figure 1 illustrates the geometric schematic and highlights the locations of the air and fuel inlets.

Table 1.
The values of parameters used in CFD simulation.
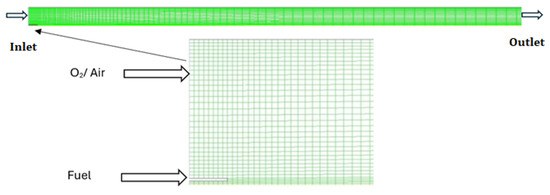
Figure 1.
Schematic of geometry.
Following the grid independence analysis, the mesh with the optimal properties was selected for the simulations. The orthogonal quality of the mesh was found to be a minimum of 1.0, with an ortho skew of 0.0, ensuring a well-structured grid. The maximum aspect ratio was 109.6, and the grid consisted of 1705 nodes with 1615 quadrilateral cells. The mesh also included 58 symmetry faces, 58 wall faces in Zone 7, and 9 wall faces in Zone 2. There were 20 velocity-inlet faces in Zone 8 and 5 velocity-inlet faces in Zone 6. The interior faces numbered 3141, while the pressure outlet faces amounted to 28. This grid was chosen for its ability to provide accurate results while maintaining computational efficiency. It was further validated by comparing the output against finer grids, ensuring that no significant changes in key simulation parameters occurred. These details will be included in the revised manuscript. The model CFD geometry is a 1.8 m long combustion chamber with a circular hold and on two sides having axis symmetry conditions [6]. To focus on the process of simulation where the formation of soot takes place, the combustor length is decreased to 900 mm in contrast with the experiment. In order to study the soot formation, the length of the combustion is reduced to 900 mm in specific regions where the soot is formed. The effect of the physical dimensions of the inlet nozzles has been studied in the results, which estimate that a small fuel nozzle, due to its small size, has no considerable consequence on the flow field [10]. A grid that is non-uniform and measures 0.225 m and 1.8 m was placed in the X and Y directions in the combustor. The standard k-ε model is used to model turbulence chemistry during combustion, whose initial analysis gives the best interaction for mixing. A laminar flamelet model is used to model the reactive combustion process by applying the Jet Surf Version 1.0 mechanism and producing non-adiabatic diffusive flamelets [11]. This research focused on the Moss-Brookes soot model in ANSYS FLUENT. This model is particularly designed for soot prediction in methane flames, although it can also be applied to other hydrocarbon species by adjusting the soot precursor and surface growth species. It is required to define the precursor species (acetylene, in this case) and the surface growth species within the Species Definition section. The model uses methane (CH4) as the fuel and acetylene as the precursor species. The precursor mass fraction is calculated based on the mixture fraction, with the user defining the molecular weight of acetylene and using a piecewise polynomial function for the precursor correlation. Additionally, the process parameters, such as the mass of a developing soot particle and the mean density of soot particles, are set. The soot oxidation is modeled using the Fenimore–Jones model, with an instantaneous method for calculating the concentration of hydroxyl radicals (OH). The setup concludes by enabling the soot–radiation interaction option, ensuring the effects of soot radiation are considered in the simulation.
The standard k-ε model was employed for turbulence due to its efficiency and accuracy in predicting mixing and reaction interactions. A 2D axisymmetric model was used to simplify computations while preserving accuracy, given the axial symmetry of the system. Additionally, constant inlet conditions for fuel and air were assumed to focus on the effects of turbulent mixing and reactions.
The residuals for continuity, momentum, energy, and species equations were monitored, and the convergence was ensured when all residuals dropped below 10−6.
4. Results and Discussion
The structure of flame during a non-laminar flow field gives input to the soot model. As a result, the accuracy of the soot model depends upon the good interaction of turbulent flow variables with measurements obtained from experiments. In this part, the contours of numerous important physical parameters in the non-laminar combustion field are presented first.
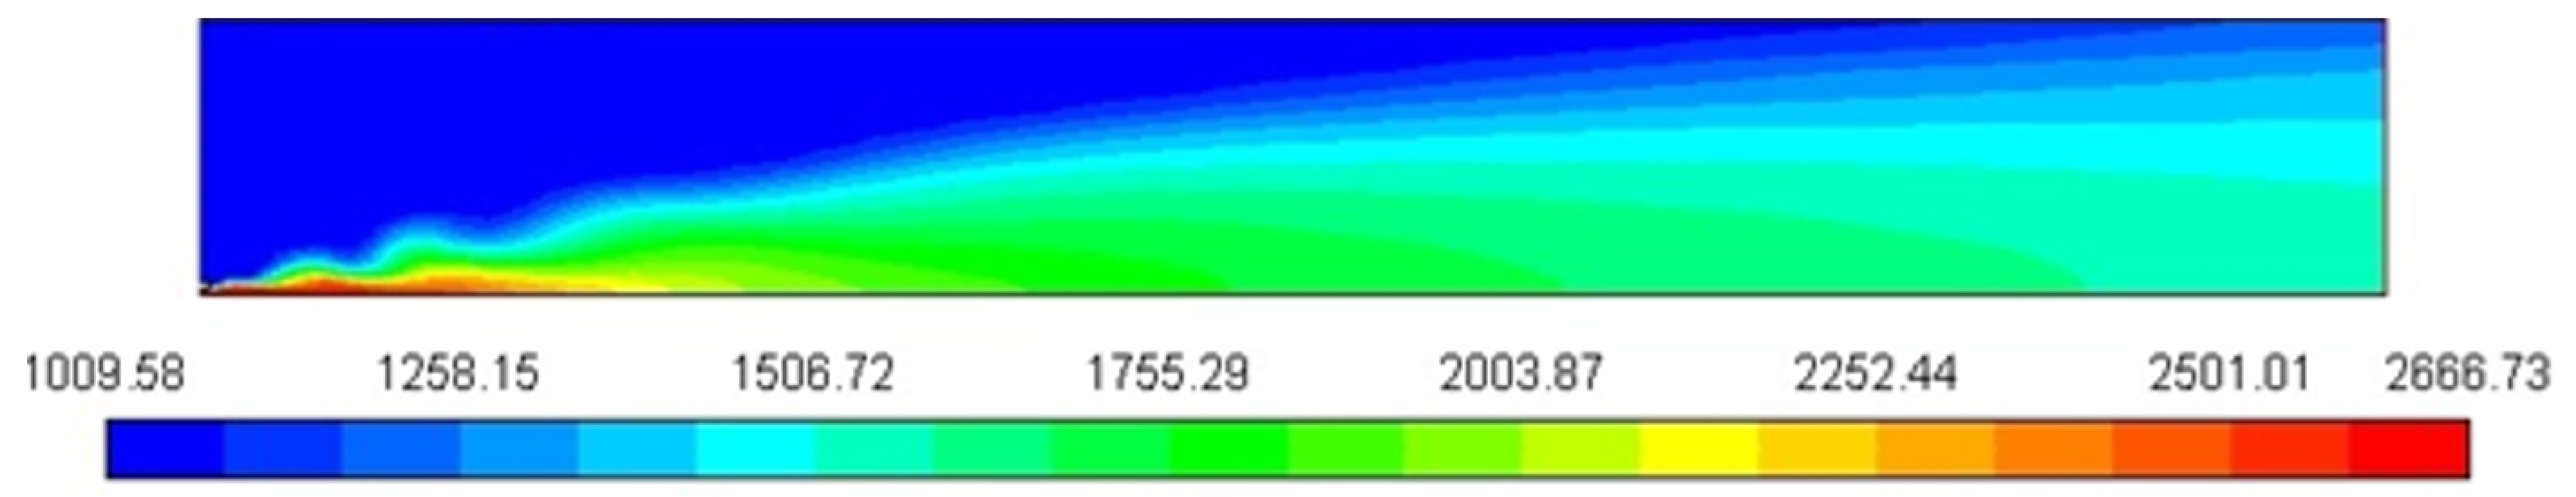
Figure 2 shows the peak temperature, predicted using a constant heat capacity of 1000 J/Kg-K, is about 2744 K from 300 K. The temperature is increased due to high pressure during the compression stroke; overprediction of the flame temperature can be reduced by a more reality-based, accurate model for the temperature and composition dependence of the heat capacity [12].
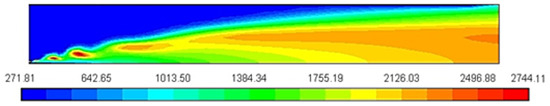
Figure 2.
Temperature profile [K].
Figure 3 represents the Cp profile of the combustion chamber. The mixture heat is largest where the C10H22 is concentrated, close to the nozzle of the fuel inlet in the zone where combustion product concentrations and temperature are increased. The increase in heat capacity to 2644 J/Kg-K, relative to the constant value used before, substantially lowers the peak flame temperature.
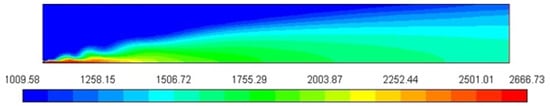
Figure 3.
Specific heat profile/Cp [J/Kg-K].
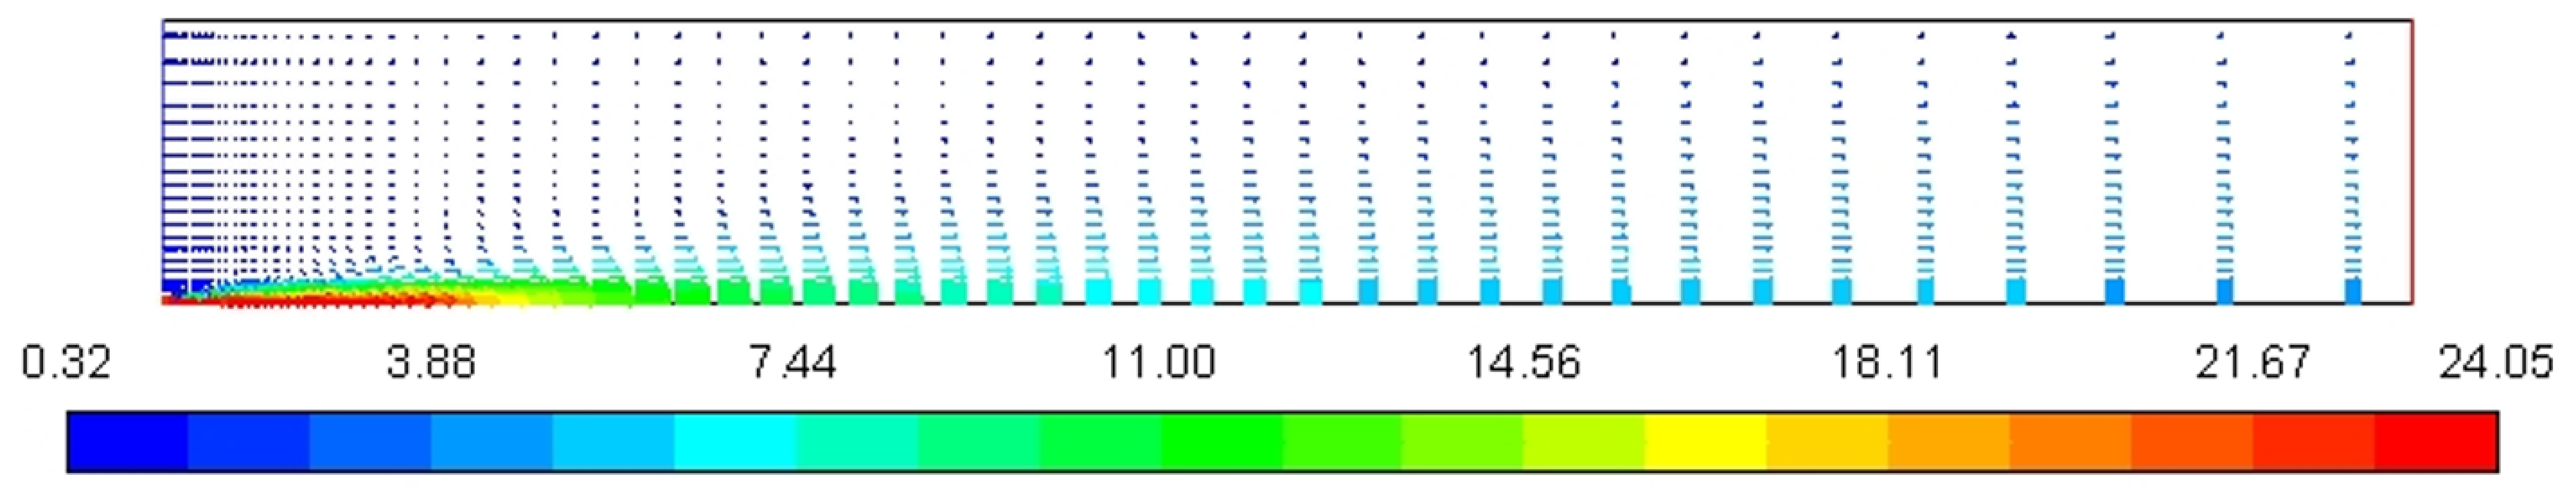
Figure 4 represents the velocity profile of the combustion chamber. In the annulus region, velocity increases sharply from around 0.3 m/s to 24 m/s due to a decrease in the cross-sectional area while entering the nozzle combustion chamber through the inlet nozzle to provide sufficient kinetic energy to increase temperature and pressure for ignition stoke.
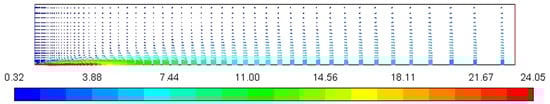
Figure 4.
Velocity magnitude profile [m/s].
Figure 5 shows the profile of the stream function whose value is increased up to 0.02, which clearly represents the entrainment of air into the high-velocity diesel jet, which is clearly visible in the streamline display.

Figure 5.
Stream function profile [Kg/s].
Figure 6, Figure 7, Figure 8 and Figure 9 represent the variation in mass fraction of diesel (C10H22), oxygen, CO2, and H2O, respectively. Diesel conversion takes place through combustion, so its mass fraction is reduced to zero. Similarly, the mass fraction of oxygen is also reduced to almost zero from 0.24. On the other hand, CO2 is formed by combustion reaction, so its mass fraction increases up to 0.24 as water is also formed in combustion, so the mass fraction H2O is also observed up to 0.08. A small amount of soot is also observed because of combustion reactions during diesel combustion.
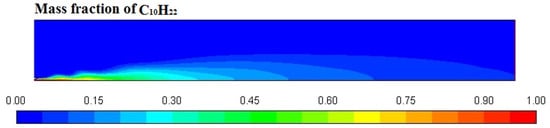
Figure 6.
Diesel (C10H22) mass fraction profile.
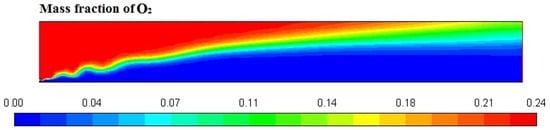
Figure 7.
O2 mass fraction profile.
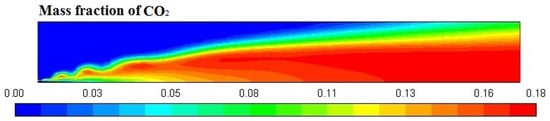
Figure 8.
CO2 mass fraction profile.
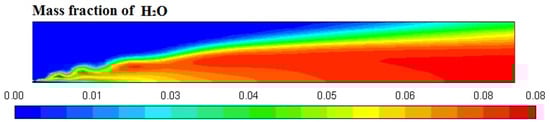
Figure 9.
H2O mass fraction profile.
Figure 10 shows the soot formation during the combustion of diesel in a turbulent diffusion flame furnace, and the soot amount predicted through the Moss-Brooks model is 0.03. The shape of the soot mass fraction profile, as shown in Figure 10, is affected by the temperature and fuel concentration gradients within the combustion zone. The higher soot mass fraction near the center of the domain corresponds to regions of high temperature, where fuel pyrolysis and soot formation are most active. As the gas flows outward, the temperature decreases, which leads to a reduction in soot production, and hence, the soot mass fraction decreases. This behavior is characteristic of diffusion-controlled combustion, where soot formation is strongly coupled with local temperature and fuel concentration. The rapid drop in soot mass fraction at the periphery can also be attributed to the lower temperatures and reduced fuel availability in those regions, resulting in minimal soot formation.
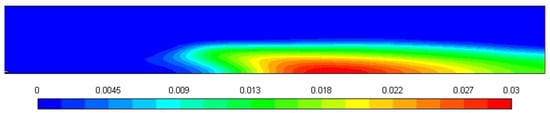
Figure 10.
Soot mass fraction profile.
Table 2 shows the comparison between the literature and the model values. The error in peak temperature (2.33%) is small, indicating accurate temperature prediction by the CFD model. However, the larger error in soot volume fraction (29.63%) suggests uncertainties in soot formation influenced by precursor concentrations and growth rates. The highest error in soot mass density (42.56%) reflects significant discrepancies, likely due to approximations in soot aggregation and oxidation processes. These higher errors in soot parameters are typical in combustion modeling, where soot formation is sensitive to many variables. Overall, while the temperature prediction is reliable, the soot-related predictions exhibit larger uncertainties due to the complexity of soot formation.
Table 2.
Comparison of CFD model results with literature data.
5. Conclusions
A two-dimensional reactor has been made by using Ansys Fluent, comprising a combustion channel inside it for diesel combustion. Ansys Fluent was used to predict the behavior of the fluid regimes involved in the process of catalytic combustion. Incorporation of the reaction mechanism for the catalytic combustion of methane in the software is performed by creating a reaction mechanism file, which consists of all the reactions involved in the methane combustion mechanism. The reaction file was imported into the software to conclude the reaction mechanism. The simulation was performed on input data, and it was concluded that the mass fraction of reactants decreased as the reaction proceeded through the catalytic channel of the combustion chamber. As a result, an increase in product formation was observed. It was noticed that the presence of a catalytic channel inside the combustion chamber ignited the combustion reaction. The catalytic activity was the reason to raise the temperature of the combustion chamber. The mass fraction profiles of the reactants and the products of the combustion reaction were predicted in this study. This study recommended that the CFD simulation is the best software to predict the behavior of chemical processes, mainly catalytic combustion. It is concluded through this research that CFD is the best software available for the prediction of surface reactions and related processes.
Author Contributions
Conceptualization, M.A.; methodology and visualization, M.F.R.; investigation, M.F.R.; resources and validation, M.A. and M.F.R.; writing—original draft preparation, M.F.R.; writing—review and editing and supervision, M.A. All authors have read and agreed to the published version of the manuscript.
Funding
This research received no external funding.
Institutional Review Board Statement
Not applicable.
Informed Consent Statement
Not applicable.
Data Availability Statement
Data are contained within the article.
Conflicts of Interest
The authors declare no conflicts of interest.
References
- Mazzei, L.; Puggelli, S.; Bertini, D.; Pampaloni, D.; Andreini, A. Modelling soot production and thermal radiation for turbulent diffusion flames. Energy Procedia 2017, 126, 826–833. [Google Scholar] [CrossRef]
- Strokach, E.; Zhukov, V.; Borovik, I.; Sternin, A.; Haidn, O.J. Simulation of a GOx-GCH4 rocket combustor and the effect of the GEKO turbulence model coefficients. Aerospace 2021, 8, 341. [Google Scholar] [CrossRef]
- Machado, I.M.; Pagot, P.; Pereira, F.M. Experimental study of radiative heat transfer from laminar non-premixed methane flames diluted with CO2 and N2. Int. J. Heat Mass Transf. 2020, 158, 119984. [Google Scholar] [CrossRef]
- Ruiz, S.; Celis, C.; Figueira da Silva, L.F. Computational assessment of soot models in ethylene/air laminar diffusion flames. Combust. Theory Model. 2024, 28, 623–648. [Google Scholar] [CrossRef]
- Brookes, S.; Moss, J. Predictions of soot and thermal radiation properties in confined turbulent jet diffusion flames. Combust. Flame 1999, 116, 486–503. [Google Scholar] [CrossRef]
- Wen, Z.; Yun, S.; Thomson, M.; Lightstone, M. Modeling soot formation in turbulent kerosene/air jet diffusion flames. Combust. Flame 2003, 135, 323–340. [Google Scholar] [CrossRef]
- Hall, R.; Smooke, M.; Colket, M. Physical and Chemical Aspects of Combustion. A Tribute to Irvine Glassman; CRC Press: Boca Raton, FL, USA, 1997; p. 189. [Google Scholar]
- Lee, K.; Thring, M.; Beer, J. On the rate of combustion of soot in a laminar soot flame. Combust. Flame 1962, 6, 137–145. [Google Scholar] [CrossRef]
- Fluent, A. Ansys Fluent Theory Guide; Ansys Inc.: Canonsburg, PA, USA, 2011; pp. 724–746. [Google Scholar]
- Valencia, S.; Ruiz, S.; Manrique, J.; Celis, C.; Figueira da Silva, L.F. Soot modeling in turbulent diffusion flames: Review and prospects. J. Braz. Soc. Mech. Sci. Eng. 2021, 43, 219. [Google Scholar] [CrossRef]
- Hadadiyan, M.; Arjmandi, H.; Deme, O.A.; Eghbali, M.J. Integrated optimization of geometrical parameters and flow variables for industrial incinerator performance improvement. Results Eng. 2023, 20, 101577. [Google Scholar] [CrossRef]
- Hamzah, D.A. Theory comparison between propane and methane combustion inside the furnace. Int. J. Curr. Eng. Technol. 2015, 5, 2429–2434. [Google Scholar]


Disclaimer/Publisher’s Note: The statements, opinions and data contained in all publications are solely those of the individual author(s) and contributor(s) and not of MDPI and/or the editor(s). MDPI and/or the editor(s) disclaim responsibility for any injury to people or property resulting from any ideas, methods, instructions or products referred to in the content. |
© 2025 by the authors. Licensee MDPI, Basel, Switzerland. This article is an open access article distributed under the terms and conditions of the Creative Commons Attribution (CC BY) license (https://creativecommons.org/licenses/by/4.0/).