1. Introduction
The viability of the K and K
I freshness indices based on the determination of the relative content of adenosine triphosphate (ATP) post-mortem degradation products as an effective tool for evaluation of the freshness status of raw fish and seafood products has been confirmed by numerous studies [
1,
2,
3]. It has been found that prolonged storage of raw fish results in lower levels of ATP, adenosine diphosphate (ADP), adenosine monophosphate (AMP), inosine monophosphate (IMP) and higher levels of hypoxanthine (Hx) and inosine (Ino) [
2,
3,
4]. Much less attention has been given to the possibility of using this approach to assess the quality of ready-to-eat thermally processed fish products, particularly canned fish, which are considered as a more affordable and shelf-stable option for consumers compared to fresh or frozen raw fish [
4,
5,
6].
To produce valid results for ready-to-eat food using nucleotide-based quality factors, it is crucial to know how concentrations of ATP metabolites change during the thermal processing of fish at different storage times. An increase in the
K index has been reported during high-temperature processing of relatively short-term-stored raw fish [
4]. The temperature of thermal processing also plays a role: high-temperature sterilization during canning deactivates enzymes responsible for nucleotide degradation (ATP, ADP, AMP, IMP, Ino, Hx), preserving these nucleotide concentrations in canned products and allowing for the assessment of the original freshness of the raw material [
7,
8]. The research [
5] identified differences in IMP, Ino, and Hx content between raw fish and fish processed under two different thermal regimes. Raw fish showed the lowest K index values, the lowest hypoxanthine content, and the highest IMP content. Thermal processing at 125 °C for 9 min reduced the IMP content and increased the Ino and Hx content. Processing for 90 min at 120 °C resulted in the highest Ino and Hx content and the lowest IMP content. Additionally, attempts were made to use high pressure liquid chromatography (HPLC) to determine the K freshness index and equivalent biochemical age under storage conditions at 0 °C, yielding values from 9 to 15 days for canned sardines from three brands [
6].
Thus, it is important to consider the changes in ATP metabolite concentrations in raw fish during storage prior to canning, as well as the effects arising from high-temperature thermal processing during canning, for the accurate interpretation of results. These effects include thermal degradation of ATP metabolites and the stabilizing of their concentrations after heat treatment due to enzyme deactivation. Additionally, the so-called nucleotide salvage effect, previously revealed by the authors of this research, where ATP, ADP, AMP, and IMP concentrations increase during the thermal processing of raw fish at later stages of storage [
9], should be taken into account.
It has been shown previously that the freshness status of fish can be assessed using FPMLC [
9,
10]. This technique is more affordable and less time consuming compared to high-performance liquid chromatography (HPLC) and nuclear magnetic resonance (NMR) spectroscopy, which are usually used for nucleotide quantitative determination. The aim of this study is to evaluate the applicability of FPMLC to evaluate the quality of canned fish.
2. Materials and Methods
The testing method based on the FPMLC technique was implemented in the custom designed optical chemical sensor with the PD-10 gel column (Code No. 17-0851-01) from GE Healthcare
® Bio-Sciences AB (Uppsala, Sweden) as a medium for the separation of proteins and ATP metabolites contained in fish muscle tissue. A photometric detector based on a deep UV LED emitting in the wavelength range of 255–265 nm near the characteristic absorption peak of ATP metabolites and visible-blind UV photodiode was used in the sensor. The sensor design and operational principles are presented in more detail in works [
10,
11].
Eighteen samples of various canned fish (Tuna—three samples, Pink Salmon—four samples, Mediterranean Sardine—one sample, Rainbow Trout—three samples, Sockeye—one sample, Mackerel—one sample, Salmon—one sample, Chum Salmon—one sample, Coho Salmon—one sample, Iwashi—one sample, Atlantic Salmon—one sample) from different manufacturers were acquired from local supermarkets for this research. Each sample varied in either manufacturer or fish species; some species were from two or three different manufacturers depending on the availability. For the verification of the FPMLC results, four samples chosen as the most representative were analyzed by HPLC and NMR spectroscopy.
Sample preparation. Two grams of muscle tissue were taken from the large pieces of canned fish, minced with a knife, and transferred to a disposable plastic tube. Then, approximately 6 mL of TRIS buffer (pH = 8.0) was added to the tube. The sample was shaken with a rotary mixer (MX-RL-E from DLAB Scientific, Beijing, China) for 5 min, then centrifuged at 4000 rpm for 10 min to separate the liquid extract from hard elements and oil. Subsequently, about 3 mL of the liquid was withdrawn from the tube using a syringe with a Luer-lock connection and filtered through glass fiber syringe filters (Whatman® GF/B, Product No. Z242195) from Merck KGaA (Darmstadt, Germany), which retain particles down to 1 µm.
Chromatogram processing. The purified extract (250 µL) was then dispensed with a pipette onto the absorbent surface of the chromatographic column of the sensor. After the extract is completely absorbed, the buffer reservoir is filled with 25 mL of TRIS buffer and the chromatogram registration is started on the computer. After each measurement, the chromatographic column is additionally washed with TRIS buffer. A more detailed description of the procedure can be found elsewhere [
10,
11].
High-Performance Liquid Chromatography HPLC. Measurements were carried out using a reverse-phase high-performance liquid chromatograph (HPLC) (Shimadzu LC-20 Prominence, Kyoto, Japan). The samples were filtered through a 0.22 µm membrane, and analysis was performed by injecting 10 µL of each sample, with detection monitored at 254 nm using the SPD-20A (UV-VIS) detector of the chromatograph. A thermostat compartment was equipped with a Discovery@C18 HPLC Column (4.6 mm × 250 mm, 5 µm), and the temperature was set to 30 °C. The mobile phase consisted of solvent A (0.1 mol/L phosphate buffer, pH 6.95) and solvent B (acetonitrile). The gradient program was as follows: 100% A at 0 min, 98% B at 6.5 min, 95% B at 10 min, 90% B at 12 min, 75% B at 14 min, and 100% B at 23 min, with a flow rate of 1 mL/min.
In the range of 3–740 μg/mL, the correlation coefficient R2 values of the six analytes were greater than 0.999, shown by an excellent linear relationship. The standard solutions were diluted gradually and analyzed to ascertain the limit of detection (LOD), and the limit of quantification (LOQ), defined as signal-to-noise ratios (S/N) of 3:1 and 10:1, respectively. The LOD for the six metabolites were 0.05, 0.05, 0.03, 0.05, 0.02, 0.01 μg/mL for ATP, ADP, AMP, IMP, Ino and Hx, respectively. The LOQ for the six metabolites were 0.17, 0.17, 0.10, 0.17, 0.07, 0.03 μg/mL for ATP, ADP, AMP, IMP, Ino and Hx, respectively. The result of the repeatability CV (coefficient of variation) was 2.5%, CV was <2%, and reproducibility CV was <4%. A known concentration (10 uM) of ATP, ADP, AMP, IMP, Ino, Hx was added to a fish extract with a known concentration and then analyzed. The method’s recovery after the addition of known amounts of analytes to fish samples ranged from 96.8% to 104.5%.
The relative standard deviation (RSD) values of the retention times were smaller than 1% (the sample fish was replicated three times and gained RSD by calculating), indicating that the developed separation method was stable enough.
NMR spectroscopy. The 1H NMR spectra were measured at 298 K using the 600 MHz Bruker Avance III NMR spectrometer (Bruker Biospin GmbH, Rheinstetten, Germany) with solvent suppression using the noesygppr1d pulse sequence. The obtained spectra were processed in Bruker TopSpin v. 3.6.1 with phase correction and baseline correction. Chemical shift calibration was performed using the TSP signal (δ 0.0 ppm) as a reference. Identification of ATP-bound compounds was performed in Chenomx NMR Suite v. 10.0 software using the metabolite library. Before Fourier transformation, the free induction decays (FIDs) were multiplied by a line-broadening function of 0.3 Hz.
The extraction of water-soluble polar metabolites from fish samples was performed by mixing 25 g of fish muscle tissue with 50 mL of a 7.5% trichloroacetic acid (TCA) solution followed by homogenization. The resulting homogenate was filtered through a paper filter. The filtrate was neutralized with a 9 M KOH solution to a pH of 7.4, followed by re-filtration and centrifugation at 4 °C and 12,000× g for 10 min. A standard NMR ampoule with a diameter of 5 mm was filled with 500 µL of the solution and 50 µL of a TSP (3-(trimethylsilyl)propionic acid-2,2,3,3-d4 sodium salt) solution in D2O at a concentration of 11 mmol/L (as an internal standard).
3. Results and Discussion
Determining the degree of freshness is based on the relative content of ATP breakdown products: the longer the fish is stored before canning, the lower the content of ATP, ADP, IMP and the higher the content of hypoxanthine and inosine [
3,
8]. During sterilization, enzymes are deactivated and the content of ATP related substances is stabilized [
7,
8]. Accordingly, the longer the fish was stored before canning, the longer the elution of ATP metabolites will take, due to a decrease in their molecular weight. On FPMLC chromatograms, it is manifested as a shift in the second combined peak responsible for ATP metabolites to the right relative to the protein peak, which elutes first (
Figure 1).
The delay time between peaks (the Time index) for 18 samples varied in a range from 138 s to 193 s, which leads to the suggestion that the freshness of raw fish material at the moment of canning could vary considerably. It is supposed that the higher the Time index, the less fresh raw fish was used.
Some samples on the chromatograms have a broader shape of the second peak and are characterized by the appearance of a hypoxanthine “hump” in the right side of the combined peak associated with ATP metabolites, which could possibly indicate that the fish has been stored for several days or more before canning (
Figure 1b). This is consistent with the high value of Time index obtained from the chromatogram. The lowest Time index value was recorded for “Connétable” sardines. Considering our earlier data [
9], we can assume that the canned food is made from very fresh raw materials.
Four selected samples were tested by HPLC and NMR methods, and the values of the K
I and K indices were calculated for them. The sample selection process was based on the values of the Time index obtained by FPLMC—according to which the samples were assumed to belong to different freshness categories (a strong correlation between the Time index and product freshness indexes determined by alternative established techniques was confirmed earlier for raw fish and meat, see [
10]). We took samples with the lowest, highest and closest to average Time indexes, which were of the greatest interest for evaluation using HPLC and NMR.
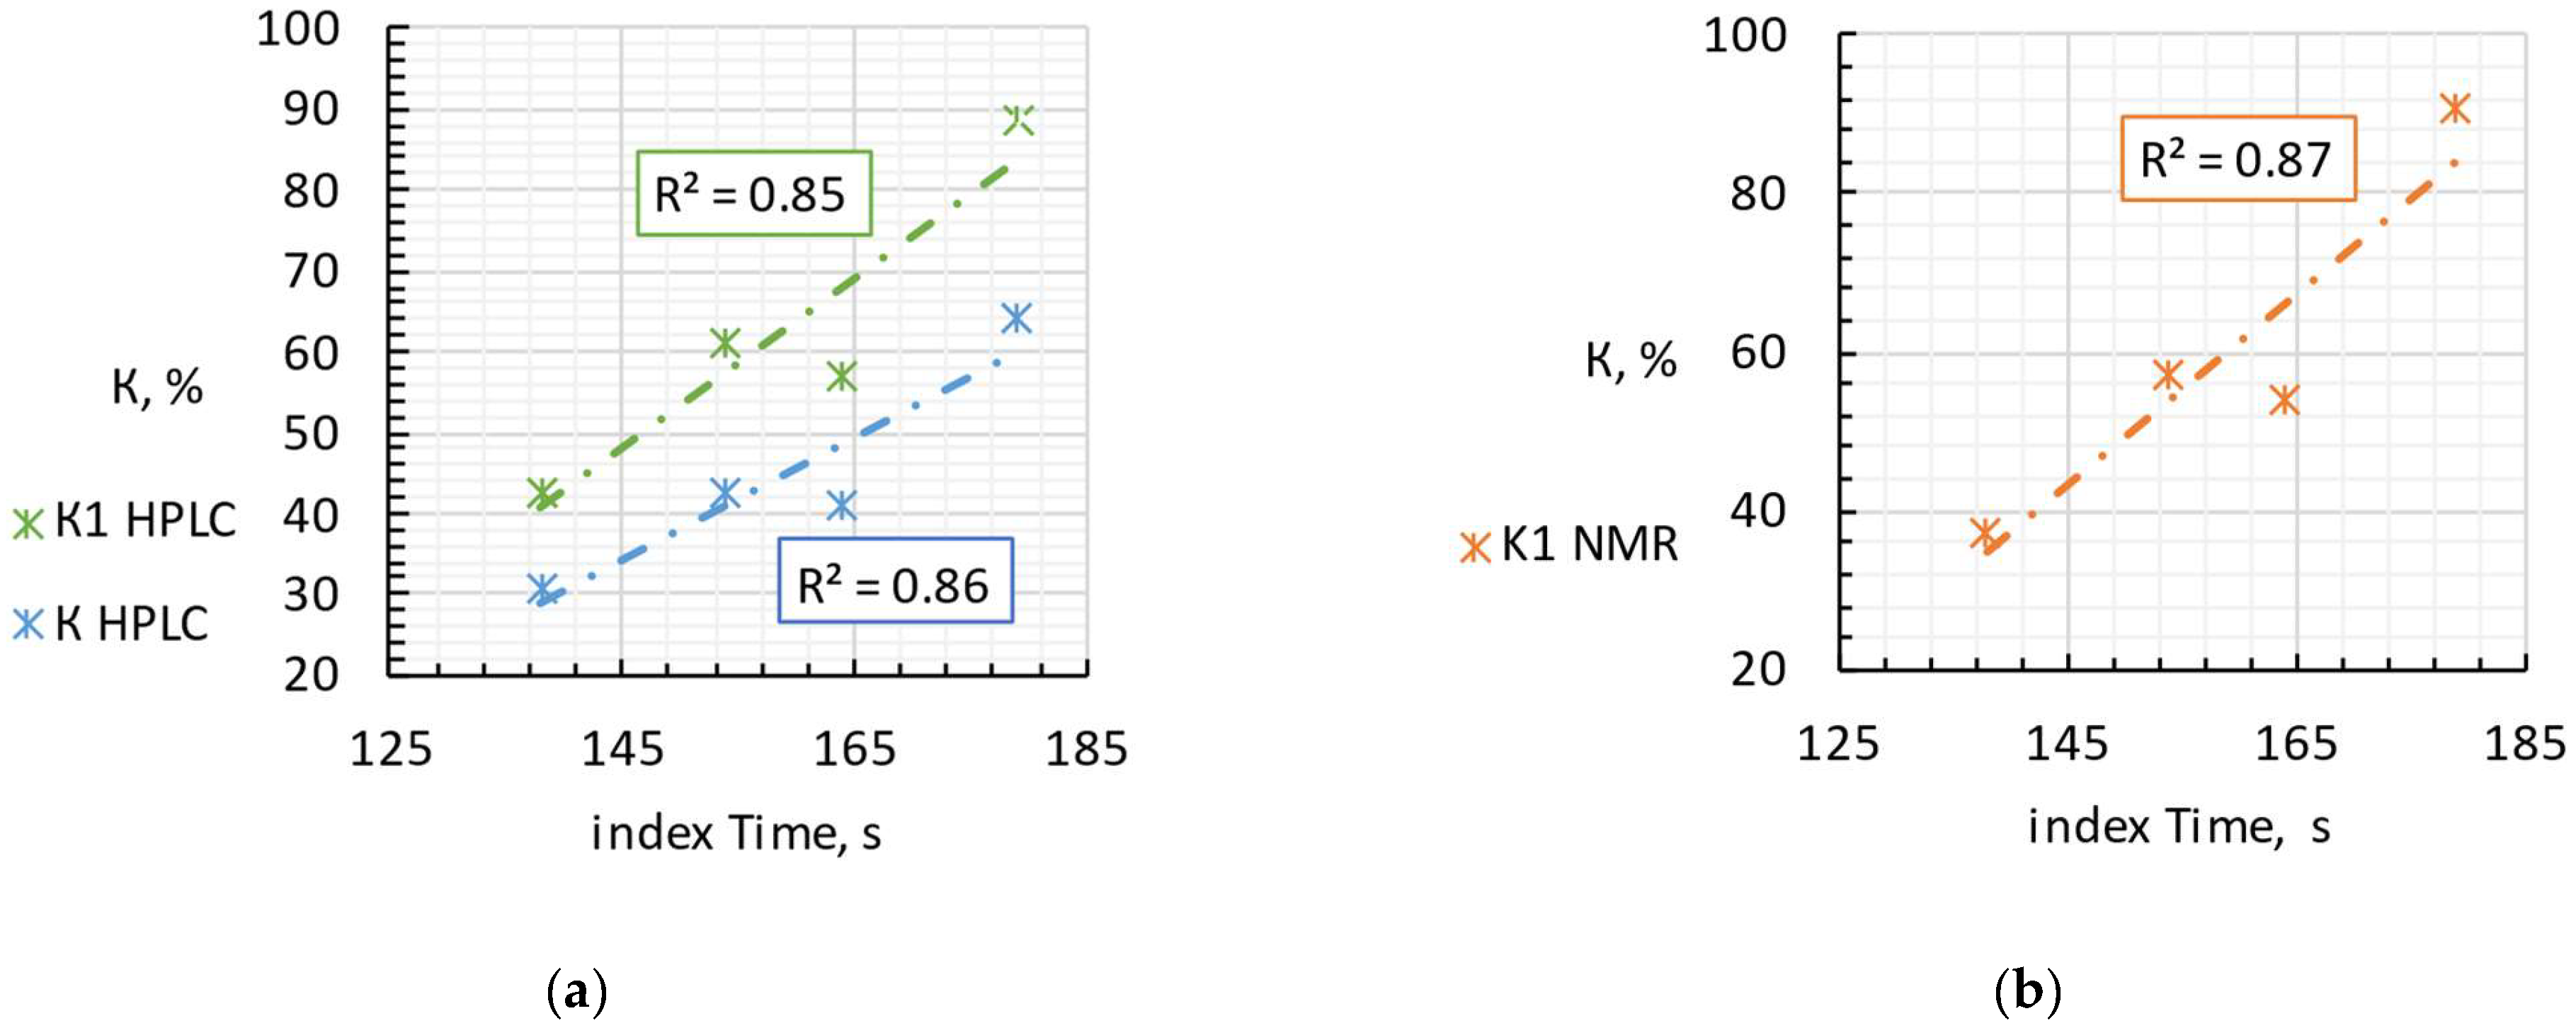
Table 1 and
Figure 2 shows a comparison of the results of the FPMLC method (the Time index), NMR spectroscopy (freshness index K
I), HPLC (freshness indices K
I and K), and estimated storage time of raw fish before production, taking into account inevitable thermal degradation of nutritional nucleotides and nucleosides during high-temperature sterilization.
Mediterranean sardine “Connétable” has the lowest values of the KI and K indices assessed by both methods, which is in good agreement with the obtained Time index. Iwashi “Moreslav” and rainbow trout “Ecofood” have close values of the KI and K indices according to the HPLC method and close KI according to NMR, but higher than the Mediterranean sardine “Connétable”, which indicates the storage of fish raw materials for several days before the canning process (estimated 3–7 days). The Time index is also consistent with this result. Pink salmon “Moreslav” has the highest Time index of the four samples. The HPLC and NMR results confirm this result, since the KI and K indices also have the highest values.

 ,
, 
