
Levels of Arsenic in Soil, Irrigation Water, and Vegetables in Sites of Delhi Nearby Yamuna Region †


Abstract
1. Introduction
2. Material and Methodology
2.1. Study Area
2.2. Sampling Sites and Sample Collection
2.3. Vegetable Sampling
2.4. Soil Sampling
2.5. Irrigated Water Sampling
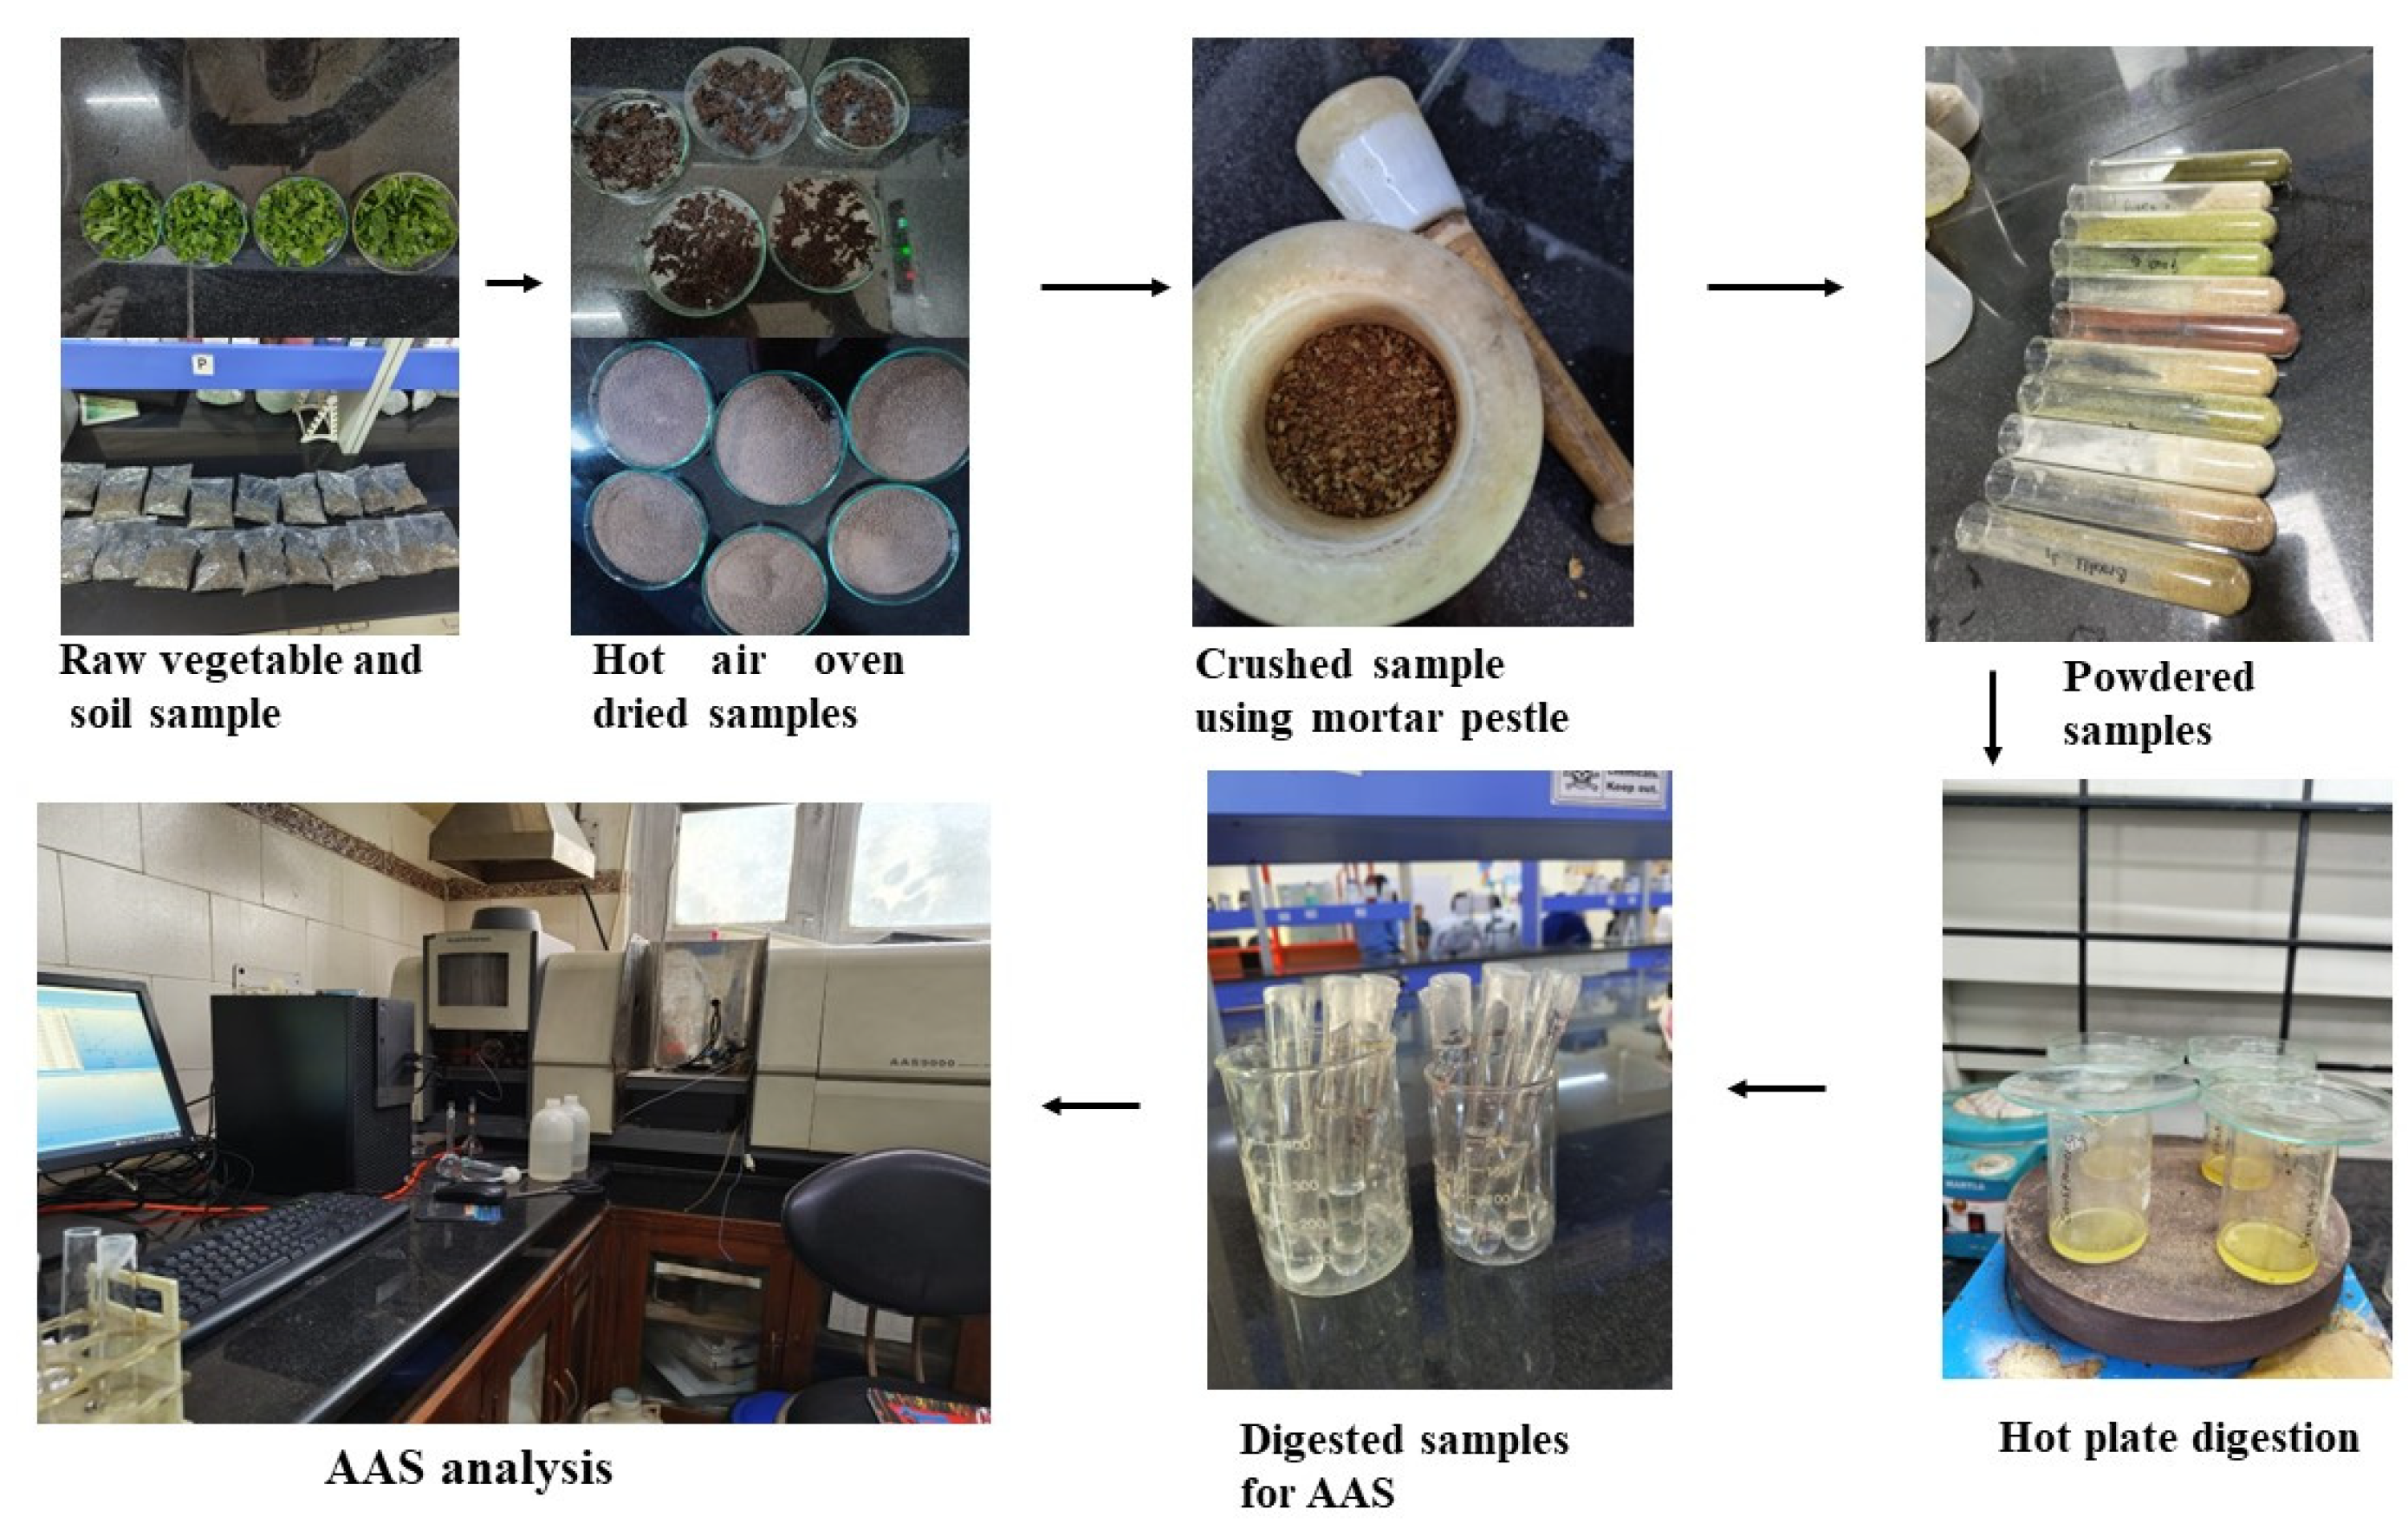
2.6. Analysis of Heavy Metal (Arsenic)
2.7. Statistical Analysis (Arsenic)
3. Results
3.1. Site-Wise Distribution of Soil and Water Samples
3.2. Season-Wise Distribution of Soil and Water Samples
3.3. Sub-Site-Wise Distribution of Soil and Water Samples
3.4. Site-Wise Distribution of Vegetables
3.5. Season-Wise Distribution of Vegetable Samples
3.6. Sub-Site-Wise Distribution of Soil and Vegetable Samples
4. Discussion
5. Conclusions
Author Contributions
Funding
Institutional Review Board Statement
Informed Consent Statement
Data Availability Statement
Acknowledgments
Conflicts of Interest
References
- Chabukdhara, M.; Gupta, S.K.; Nema, A.K. Assessment of Seasonal Variation of Surface Water Quality Using Environmetric and Indexing Approach. Special Issue “Water, Air and Soil Pollution: Monitoring and Remediation”. IIOAB J. 2016, 7, 16–24. [Google Scholar]
- Makokha, V.A.; Qi, Y.; Shen, Y.; Wang, J. Concentrations, Distribution, and Ecological Risk Assessment of Heavy Metals in the East Dongting and Honghu Lake, China. Expo Health 2016, 8, 31–41. [Google Scholar] [CrossRef]
- Njuguna, S.M.; Yan, X.; Gituru, R.W.; Wang, Q.; Wang, J. Assessment of Macrophyte, Heavy Metal, and Nutrient Concentrations in the Water of the Nairobi River, Kenya. Environ. Monit. Assess. 2017, 189, 454. [Google Scholar] [CrossRef] [PubMed]
- Ali, M.H.; Al-Qahtani, K.M. Assessment of Some Heavy Metals in Vegetables, Cereals and Fruits in Saudi Arabian Markets. Egypt. J. Aquat. Res. 2012, 38, 31–37. [Google Scholar] [CrossRef]
- Feng, W.; Guo, Z.; Peng, C.; Xiao, X.; Shi, L.; Zeng, P.; Ran, H.; Xue, Q. Atmospheric Bulk Deposition of Heavy Metal(Loid)s in Central South China: Fluxes, Influencing Factors and Implication for Paddy Soils. J. Hazard. Mater. 2019, 371, 634–642. [Google Scholar] [CrossRef]
- Balkhair, K.S.; Ashraf, M.A. Field Accumulation Risks of Heavy Metals in Soil and Vegetable Crop Irrigated with Sewage Water in Western Region of Saudi Arabia. Saudi J. Biol. Sci. 2016, 23, S32–S44. [Google Scholar] [CrossRef]
- Shah, M.T.; Begum, S.; Khan, S. Pedo and Biogeochemical Studies of Mafic and Ultramfic Rocks in the Mingora and Kabal Areas, Swat, Pakistan. Environ. Earth Sci. 2010, 60, 1091–1102. [Google Scholar] [CrossRef]
- Ahmad, J.U.; Goni, M.A. Heavy Metal Contamination in Water, Soil, and Vegetables of the Industrial Areas in Dhaka, Bangladesh. Environ. Monit. Assess. 2010, 166, 347–357. [Google Scholar] [CrossRef]
- Manzoor, J.; Sharma, M.; Wani, K.A. Heavy Metals in Vegetables and Their Impact on the Nutrient Quality of Vegetables: A Review. J. Plant Nutr. 2018, 41, 1744–1763. [Google Scholar] [CrossRef]
- Yargholi, B.; Azimi, A.A.; Baghvand, A.; Liaghat, A.M.; Fardi, G.A. Investigation of Cadmium Absorption and Accumulation in Different Parts of Some Vegetables. Am. Eurasian J. Agric. Environ. Sci. 2008, 3, 357–364. [Google Scholar]
- National Research Council. Arsenic in Drinking Water; National Academies Press: Washington, DC, USA, 1999. [Google Scholar]
- Shakoor, M.B.; Riaz, M.; Niazi, N.K.; Ali, S.; Rizwan, M.; Arif, M.S.; Arif, M. Recent Advances in Arsenic Accumulation in Rice. In Advances in Rice Research for Abiotic Stress Tolerance; Woodhead Publishing: Cambridge, UK, 2019; pp. 385–398. [Google Scholar]
- Foley, N.K.; Ayuso, R.A. Mineral Sources and Transport Pathways for Arsenic Release in a Coastal Watershed, USA. Geochem. Explor. Environ. Anal. 2008, 8, 59–75. [Google Scholar] [CrossRef] [PubMed]
- Heithmar, E.; Momplaisir, G.M.; Rosal, C. Arsenic Speciation Methods for Studying the Environmental Fate of Organoarsenic Animal-Feed Additives. Abstr. Pap. Am. Chem. Soc. 2000, 220, U341. [Google Scholar]
- Rahaman, S.; Sinha, A.C.; Pati, R.; Mukhopadhyay, D. Arsenic Contamination: A Potential Hazard to the Affected Areas of West Bengal, India. Environ. Geochem. Health 2013, 35, 119–132. [Google Scholar] [CrossRef] [PubMed]
- Gebeyehu, H.R.; Bayissa, L.D. Levels of Heavy Metals in Soil and Vegetables and Associated Health Risks in Mojo Area, Ethiopia. PLoS ONE 2020, 15, e0227883. [Google Scholar] [CrossRef]
- Chary, N.S.; Kamala, C.T.; Raj, D.S.S. Assessing Risk of Heavy Metals from Consuming Food Grown on Sewage Irrigated Soils and Food Chain Transfer. Ecotoxicol. Environ. Saf. 2008, 69, 513–524. [Google Scholar] [CrossRef]
- Rajan, S.; Nandimandalam, J.R. Environmental Health Risk Assessment and Source Apportion of Heavy Metals Using Chemometrics and Pollution Indices in the Upper Yamuna River Basin, India. Chemosphere 2024, 346, 140570. [Google Scholar] [CrossRef]
- Suthar, S.; Nema, A.K.; Chabukdhara, M.; Gupta, S.K. Assessment of Metals in Water and Sediments of Hindon River, India: Impact of Industrial and Urban Discharges. J. Hazard. Mater. 2009, 171, 1088–1095. [Google Scholar] [CrossRef]
- Gupta, S.K.; Chabukdhara, M.; Kumar, P.; Singh, J.; Bux, F. Evaluation of Ecological Risk of Metal Contamination in River Gomti, India: A Biomonitoring Approach. Ecotoxicol. Environ. Saf. 2014, 110, 49–55. [Google Scholar] [CrossRef]
- Li, R.; Zou, Z.; An, Y. Water Quality Assessment in Qu River Based on Fuzzy Water Pollution Index Method. J. Environ. Sci. 2016, 50, 87–92. [Google Scholar] [CrossRef]
- Githaiga, K.B.; Njuguna, S.M.; Gituru, R.W.; Yan, X. Water Quality Assessment, Multivariate Analysis and Human Health Risks of Heavy Metals in Eight Major Lakes in Kenya. J. Environ. Manag. 2021, 297, 113410. [Google Scholar] [CrossRef]
- Bhattacharyya, K.; Sengupta, S.; Pari, A.; Halder, S.; Bhattacharya, P.; Pandian, B.J.; Chinchmalatpure, A.R. Characterization and Risk Assessment of Arsenic Contamination in Soil–Plant (Vegetable) System and Its Mitigation through Water Harvesting and Organic Amendment. Environ. Geochem. Health 2021, 43, 2819–2834. [Google Scholar] [CrossRef] [PubMed]
- Islam, M.N.; Das, B.K.; Huque, M.E. Arsenic Accumulation in Common Vegetables from Irrigation. J. Sci. Res. 2012, 4, 675–688. [Google Scholar] [CrossRef]
- Mishra, B.K.; Dubey, C.S.; Shukla, D.P.; Bhattacharya, P.; Usham, A.L. Concentration of Arsenic by Selected Vegetables Cultivated in the Yamuna Flood Plains (YFP) of Delhi, India. Environ. Earth Sci. 2014, 72, 3281–3291. [Google Scholar] [CrossRef]

| Sites | Arsenic (As) Level in Irrigated Water (mg/L) | Arsenic (As) Level in Agriculture Soil (mg/kg) | |
|---|---|---|---|
| Najafgarh (N = 48) | Mean | 0.0502 | 0.9285 |
| Std. Deviation | 0.02726 | 0.78178 | |
| Minimum | 0.02 | 0.00 | |
| Maximum | 0.09 | 2.20 | |
| Std. Error of Mean | 0.00393 | 0.11284 | |
| Okhla (N = 48) | Mean | 0.0280 | 1.0621 |
| Std. Deviation | 0.013624 | 1.05382 | |
| Minimum | 0.01 | 0.00 | |
| Maximum | 0.10 | 1.90 | |
| Std. Error of Mean | 0.00189 | 0.10088 | |
| Yamuna Pushta (N = 48) | Mean | 0.0172 | 0.6771 |
| Std. Deviation | 0.01311 | 0.69890 | |
| Minimum | 0.01 | 0.00 | |
| Maximum | 0.10 | 1.90 | |
| Std. Error of Mean | 0.00196 | 0.1088 | |
| Total (N = 148) | Mean | 0.0318 | 0.8892 |
| Std. Deviation | 0.02348 | 0.86723 | |
| Minimum | 0.01 | 0.00 | |
| Maximum | 0.10 | 2.60 | |
| Std. Error of Mean | 0.00196 | 0.7227 | |
| Season | Arsenic (As) Level in Irrigated Water (mg/L) | Arsenic (As) Level in Agriculture Soil (mg/kg) | |
|---|---|---|---|
| Pre-Monsoon Season (N = 72) | Mean | 0.0452 | 1.6653 |
| Minimum | 0.01 | 1.00 | |
| Maximum | 0.09 | 2.60 | |
| Std. Deviation | 0.2485 | 0.46909 | |
| Std. Error of Mean | 0.00293 | 0.05528 | |
| Post-Monsoon Season (N = 72) | Mean | 0.0184 | 0.1132 |
| Minimum | 0.10 | 0.00 | |
| Maximum | 0.01 | 1.00 | |
| Std. Deviation | 0.01131 | 027067 | |
| Std. Error of Mean | 0.00133 | 0.03190 | |
| Total (N = 144) | Mean | 0.0318 | 0.8892 |
| Minimum | 0.01 | 0.00 | |
| Maximum | 0.10 | 2.60 | |
| Std. Deviation | 0.02348 | 0.86723 | |
| Std. Error of Mean | 0.00196 | 0.07227 | |
| Sub-Sites | Arsenic Water Level (mg/L) | Soil Arsenic Level (mg/kg) | |
|---|---|---|---|
| Aligaon (N = 16) | Mean | 0.0264 | 1.0612 |
| Minimum | 0.01 | 0.00 | |
| Maximum | 0.04 | 2.40 | |
| Std. deviation | 0.01420 | 1.07857 | |
| Std. error of mean | 0.00355 | 0.26964 | |
| Bahapur (N = 16) | Mean | 0.0289 | 1.0169 |
| Minimum | 0.01 | 0.00 | |
| Maximum | 0.05 | 2.60 | |
| Std. deviation | 0.01368 | 1.03111 | |
| Std. error of mean | 0.00342 | 0.25778 | |
| Bakar Wala (N = 16) | Mean | 0.0489 | 0.8112 |
| Minimum | 0.02 | 0.00 | |
| Maximum | 0.09 | 2.20 | |
| Std. deviation | 0.02669 | 0.79497 | |
| Std. error of mean | 0.00667 | 0.19874 | |
| Dichaukala (N = 16) | Mean | 0.0518 | 1.000 |
| Minimum | 1.34 | 0.00 | |
| Maximum | 12.56 | 0.08 | |
| Std. deviation | 0.02919 | 0.81698 | |
| Std. error of mean | 0.00730 | 0.20424 | |
| Madanpur Khaddar (N = 16) | Mean | 0.0288 | 1.1081 |
| Minimum | 0.67 | 0.00 | |
| Maximum | 11.50 | 0.07 | |
| Std. deviation | 0.1378 | 1.11748 | |
| Std. error of mean | 0.00345 | 0.27937 | |
| Pala village (N = 16) | Mean | 0.178 | 0.6894 |
| Minimum | 0.02 | 0.03 | |
| Maximum | 0.03 | 1.90 | |
| Std. deviation | 0.00651 | 0.72893 | |
| Std. error of mean | 0.00163 | 0.18223 | |
| Ranhola (N = 16) | Mean | 0.0499 | 0.9744 |
| Minimum | 0.02 | 0.03 | |
| Maximum | 0.09 | 2.20 | |
| Std. deviation | 0.2756 | 0.77893 | |
| Std. error of mean | 0.00689 | 0.19255 | |
| Rani garden (N = 16) | Mean | 0.0151 | 0.7219 |
| Minimum | 0.01 | 0.00 | |
| Maximum | 0.02 | 1.90 | |
| Std. deviation | 0.00351 | 0.76103 | |
| Std. error of mean | 0.00088 | 0.19026 | |
| Shakarpur (N = 16) | Mean | 0.0189 | 0.6200 |
| Minimum | 0.03 | 1.90 | |
| Maximum | 0.00651 | 0.72893 | |
| Std. deviation | 0.00163 | 0.18223 | |
| Std. error of mean | 0.03 | 1.90 | |
| Site | Arsenic (As) Level in (mg/kg) | |
|---|---|---|
| Najafgarh site (N = 48) | Mean | 2.1937 |
| Minimum | 1.00 | |
| Maximum | 4.20 | |
| Std. Deviation | 0.90375 | |
| Std. Error of Mean | 0.13045 | |
| Okhla site (N = 48) | Mean | 2.9875 |
| Minimum | 1.80 | |
| Maximum | 6.00 | |
| Std. Deviation | 1.04426 | |
| Std. Error of Mean | 0.15073 | |
| Yamuna pushta (N = 48) | Mean | 1.2563 |
| Minimum | 0.50 | |
| Maximum | 2.20 | |
| Std. Deviation | 0.43706 | |
| Std. Error of Mean | 0.6308 | |
| Total (N = 144) | Mean | 2.1458 |
| Minimum | 0.50 | |
| Maximum | 6.00 | |
| Std. Deviation | 1.09262 | |
| Std. Error of Mean | 0.09105 | |
| Season | Arsenic (As) Level in (mg/kg) | |
|---|---|---|
| Pre-Monsoon Season (N = 72) | Mean | 2.6778 |
| Minimum | 1 | |
| Maximum | 6 | |
| Std. Deviation | 1.14255 | |
| Std. Error of Mean | 0.13465 | |
| Post-Monsoon Season (N = 72) | Mean | 1.6139 |
| Minimum | 0.5 | |
| Maximum | 3.2 | |
| Std. Deviation | 0.72468 | |
| Std. Error of Mean | 0.0854 | |
| Total (N = 144) | Mean | 2.1458 |
| Minimum | 0.5 | |
| Maximum | 6 | |
| Std. Deviation | 1.09262 | |
| Std. Error of Mean | 0.09105 | |
| S. No. | Mean | No. of Samples | Vegetable | Std. Deviation | Minimum | Maximum | Std. Error of Mean |
|---|---|---|---|---|---|---|---|
| 1 | 2.0778 | 9 | Beans | 0.79180 | 1.00 | 3.00 | 0.26393 |
| 2 | 1.5222 | 9 | Beetroot | 0.65149 | 1.00 | 2.80 | 0.21716 |
| 3 | 2.2889 | 9 | Brinjal | 0.55101 | 1.40 | 3.00 | 0.18367 |
| 4 | 1.4222 | 9 | Cabbage | 0.65912 | 0.70 | 2.40 | 0.21971 |
| 5 | 1.9611 | 18 | Cauliflower | 0.96414 | 0.70 | 3.80 | 0.22725 |
| 6 | 2.6944 | 18 | Dhania | 1.39430 | 0.90 | 5.50 | 0.32864 |
| 7 | 2.2778 | 9 | Garlic | 0.83782 | 1.10 | 3.10 | 0.27927 |
| 8 | 2.5333 | 9 | Lump cabbage | 0.91241 | 1.20 | 3.40 | 0.30414 |
| 9 | 1.8722 | 18 | Radish | 0.92914 | 0.50 | 3.80 | 0.21900 |
| 10 | 1.9556 | 9 | Sarso leaf | 0.75019 | 1.00 | 3.00 | 0.25006 |
| 11 | 2.8611 | 18 | Spinach | 1.56849 | 1.00 | 6.00 | 0.36970 |
| 12 | 1.4778 | 9 | Spring onion | 0.65149 | 0.80 | 2.50 | 0.21716 |
| Total | 2.1458 | 144 | ------- | 1.09262 | 0.50 | 6.00 | 0.09105 |
Disclaimer/Publisher’s Note: The statements, opinions and data contained in all publications are solely those of the individual author(s) and contributor(s) and not of MDPI and/or the editor(s). MDPI and/or the editor(s) disclaim responsibility for any injury to people or property resulting from any ideas, methods, instructions or products referred to in the content. |
© 2024 by the authors. Licensee MDPI, Basel, Switzerland. This article is an open access article distributed under the terms and conditions of the Creative Commons Attribution (CC BY) license (https://creativecommons.org/licenses/by/4.0/).
Share and Cite
Singhania, S.; Agrawal, P.; Dwivedi, A. Levels of Arsenic in Soil, Irrigation Water, and Vegetables in Sites of Delhi Nearby Yamuna Region. Eng. Proc. 2024, 67, 67. https://doi.org/10.3390/engproc2024067067
Singhania S, Agrawal P, Dwivedi A. Levels of Arsenic in Soil, Irrigation Water, and Vegetables in Sites of Delhi Nearby Yamuna Region. Engineering Proceedings. 2024; 67(1):67. https://doi.org/10.3390/engproc2024067067
Chicago/Turabian StyleSinghania, Shrisha, Prashant Agrawal, and Achala Dwivedi. 2024. "Levels of Arsenic in Soil, Irrigation Water, and Vegetables in Sites of Delhi Nearby Yamuna Region" Engineering Proceedings 67, no. 1: 67. https://doi.org/10.3390/engproc2024067067
APA StyleSinghania, S., Agrawal, P., & Dwivedi, A. (2024). Levels of Arsenic in Soil, Irrigation Water, and Vegetables in Sites of Delhi Nearby Yamuna Region. Engineering Proceedings, 67(1), 67. https://doi.org/10.3390/engproc2024067067