Proceeding Paper

Enhancing Microfluidic Systems’ Mixing Efficiency Using Design Models with Convergent–Divergent Sinusoidal Microchannel Walls: Experimental Investigations Based on Entropy Minimization Flow Structures †

Department of Chemical and Petrochemicals Engineering, Egypt-Japan University of Science and Technology, New Borg Al-Arab City, Alexandria 21934, Egypt
*
Author to whom correspondence should be addressed.
Presented at the 3rd International Electronic Conference on Processes—Green and Sustainable Process Engineering and Process Systems Engineering (ECP 2024), 29–31 May 2024; Available online: https://sciforum.net/event/ECP2024.
Eng. Proc. 2024, 67(1), 54; https://doi.org/10.3390/engproc2024067054
Published: 26 September 2024
(This article belongs to the Proceedings of The 3rd International Electronic Conference on Processes)

Abstract

:
This study presents an innovative passive micromixer design featuring convergent–divergent sinusoidal walls, evaluated using the Villermaux–Dushman protocol. Five distinct designs were fabricated and tested, demonstrating superior mixing efficiency without additional obstructions. Testing of flow rates from 1000 to 50 mL/h revealed that the square-wave micromixer had the highest efficiency due to repeated fluid perturbations from its 90-degree angles. The loop-wave mixer performed the worst due to its lack of angles. The circular and box-wave mixers outperformed the loop-wave and backward arrow mixers due to their split and recombination effects. These designs, especially the circular and box-wave designs, offer optimal mixing for short-length applications, improving the efficiency and manufacturing simplicity for biomedical and biochemical analyses.

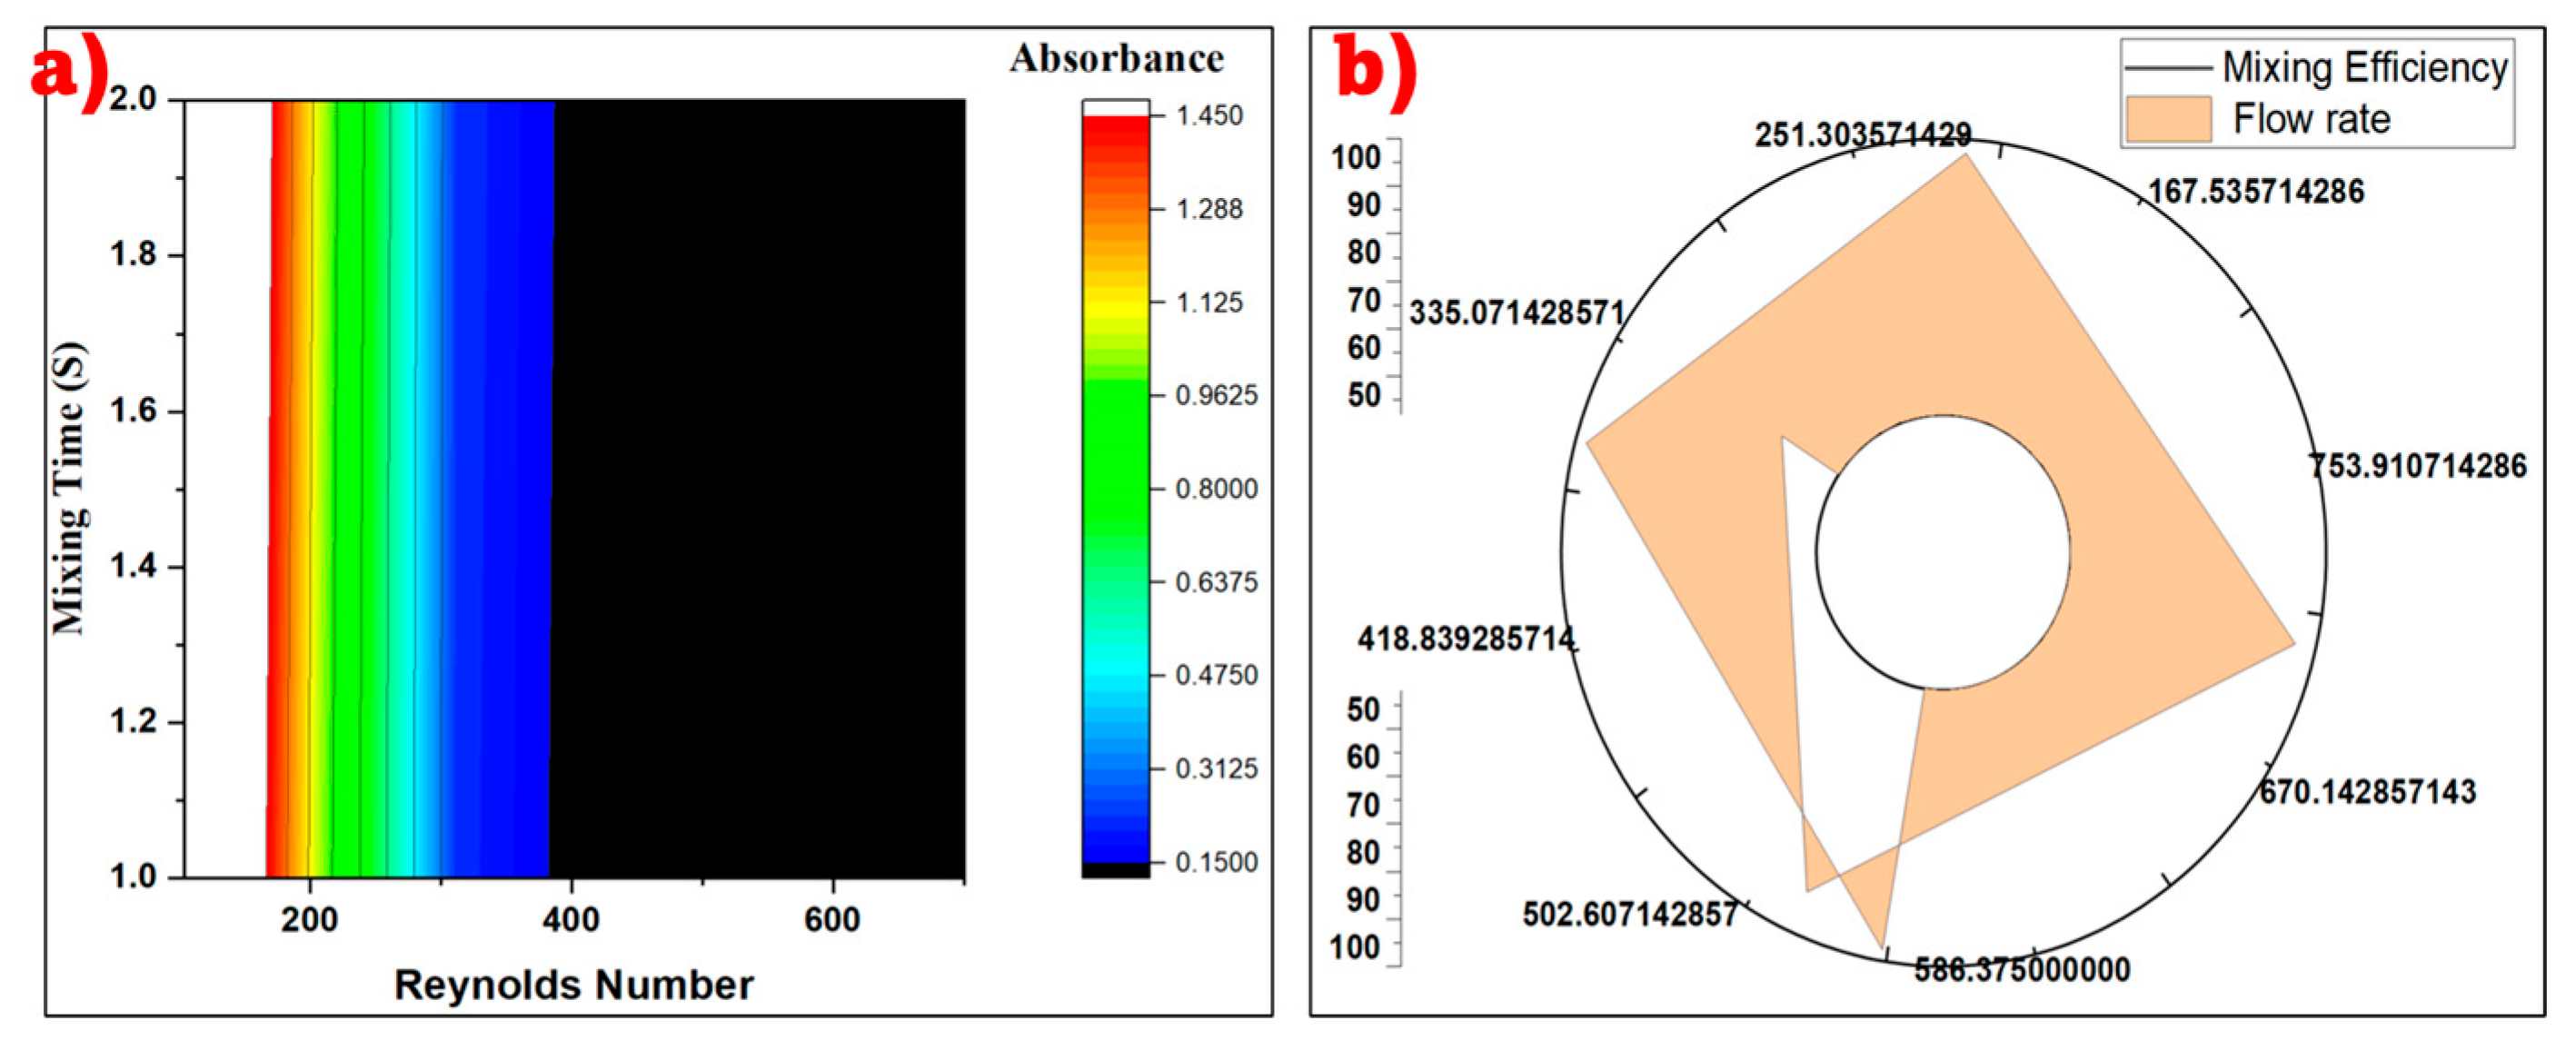
Graphical Abstract

1. Introduction

As science and technology advance, human life is becoming more intelligent and reliant on electronic devices. The most significant challenge arising from the increased use of these tools is the problem of energy supply [1]. In microfluidic applications like micro-total analysis systems and lab-on-a-chip, the mixing of fluids is essential for tasks such as facilitating chemical and biological synthesis, conducting analyses, and preparing new samples [2]. Due to the small sizes of the channels and the slow flow velocities characteristic of microfluidic systems, the Reynolds numbers are low. This low Reynolds number indicates that the typical turbulent mixing seen at larger scales is absent in microfluidic environments. As a result, alternative mechanisms, such as diffusion and controlled fluid dynamics, play a more significant role in achieving efficient mixing at the microscale [3].
Micromixers are commonly classified into two main types: passive and active. Passive micromixers utilize the geometry of the system to create complex flow patterns that enhance mixing without the need for external energy sources [4]. These passive micromixers do not contain moving parts and can be constructed in both planar, three-dimensional configurations and chaotic advection [5]. On the other hand, active micromixers rely on external stimuli such as electrical energy, magnetic fields, temperature variations, and pressure changes to improve fluid mixing. While active micromixers offer high mixing efficiency, they often face challenges in terms of fabrication and integration into complete micro-analysis systems [3,5]. To address this, researchers have investigated multiple strategies, such as altering the flow actuation parameters for active mixing and modifying the fluidic pathways for passive mixing [6].
The use of micromixers has become increasingly important in microfluidic applications due to their ability to quickly and efficiently blend fluids in small volumes [7]. To achieve high efficiency in mixing, various parameters need to be carefully adjusted, including the flow regime, flow rate, mixing time, external sources of energy, and the geometric design of the micromixer. The mixing process in micromixers is typically controlled by dimensionless parameters such as the Knudsen number, Fourier number, Peclet number, and Reynolds number [8]. The efficiency of micromixers can range from optimal to sub-optimal depending on their Reynolds number, which is influenced by factors like the nature of the fluid being used, the external environmental conditions, and the specific geometries of the microchannels within the substrate [5]. Different dimensionless parameters play crucial roles under different operating conditions. For instance, the Peclet number becomes particularly relevant when there is competition between diffusion and convection within the flow of fluids through microchannels [9]. By understanding and manipulating these parameters effectively, these parameters can enhance the performance and efficiency of micromixers in microreactors, ultimately leading to improved mixing processes and overall system effectiveness [10]. The most efficient means of addressing the challenge of achieving efficient mixing in microfluidic applications, which is crucial for tasks such as chemical and biological synthesis, analysis, and sample preparation, is to introduce structures with walls that minimize entropy [7].
This study introduces an innovative passive micromixer design that incorporates convergent–divergent walls with sinusoidal variations using the Villermaux–Dushman protocol, which has been proven to be a reliable tool for both qualitative and quantitative evaluations of mixing behavior, flow patterns, and species concentration in micromixers. Compared to previous designs, this novel micromixer offers several advantages. It enables effective vortex mixing within the microchannel, without the necessity of additional elements such as obstructions, baffles, and ridges to enhance the mixing. Furthermore, the absence of intricate three-dimensional internal structures simplifies the fabrication process, which aids in understanding how the design characteristics impact the mixing efficiency of the micromixer.

2. Materials and Methods

Five distinct micromixer designs were created utilizing the SolidWorks 2020 software (version 28), featuring a channel diameter of 700 μm, as shown in Figure 1. The primary structure of these micromixers is characterized by a backward arrow shape at the head, exhibiting a contact angle of 60°. Each of the five designs, namely backwards arrow (BWA), loop-wave (LW), square-wave (SW), circular-wave (CW), and box-wave (BW), shared common dimensions, with a length of 56 mm and a height of 20 mm. These designs were meticulously crafted to explore various geometries and configurations that could influence the mixing efficiency within the micromixers. The specific shapes and dimensions were chosen strategically to assess how different channel structures impacted the mixing performance and fluid dynamics within the system. By maintaining consistent dimensions across the designs, the focus was primarily on evaluating the influence of shape variations on the mixing characteristics, rather than size-related factors. In addition, a laser machine was set in motion and each design was fabricated with a channel depth of 1000 µm on the acrylic sheet with a diameter of 2000 µm. The fabricated designs with their covers were cleaned with ethanol to remove all particles that were found in the channels and left overnight to ensure proper drying. Each fabricated design with its covers was bound together using a thermal binding technique. The micromixers were covered with their respective covers. Glass with an approximate thickness of 3 mm was used to cover both sides of the micromixer and held together with clips. They were then placed in an oven at 150 °C for 15 min and were allowed to cool for 30 min. Three tubes with a length of 20 mm and diameter of 2.3 mm were fixed, with two at the inlets of each of the fabricated microchannels and one at the outlet, and bonded together with the help of polyepoxides. The acid and buffer solution were prepared from various chemicals. All chemicals were pure and were obtained from the Fisher Scientific Company, Bishop Meadow Road Loughborough Leicestershire, UK. Then, 2.47 mL of HCl was added to 997 mL of distilled water. The resulting solution was stirred continuously to obtain 0.03 M aqueous HCl. The solution was then allowed to settle. Furthermore, 11.13 g of H3BO3 was added to distilled water and the solution was stirred using a magnetic stirrer for 10 min. A NaOH (aq) solution was also prepared by adding 7.2 g of NaOH to distilled water, and the solution was stirred using a magnetic stirrer for 10 min. Then, 2.57 g of KIO3 was added to distilled water and the solution was stirred using a magnetic stirrer for 10 min. Finally, 10.62 g KI was also added to distilled water and the solution was stirred using a magnetic stirrer for 10 min. The four solutions were mixed to obtain a buffer of one liter. An additional one liter of distilled water was added to the buffer and they were shaken together to obtain a buffer solution of 2 L and concentrations of 0.09 M H3BO3 (aq), 0.09 M NaOH (aq), 0.006 M KIO3 (aq), and 0.032 M KI (aq).
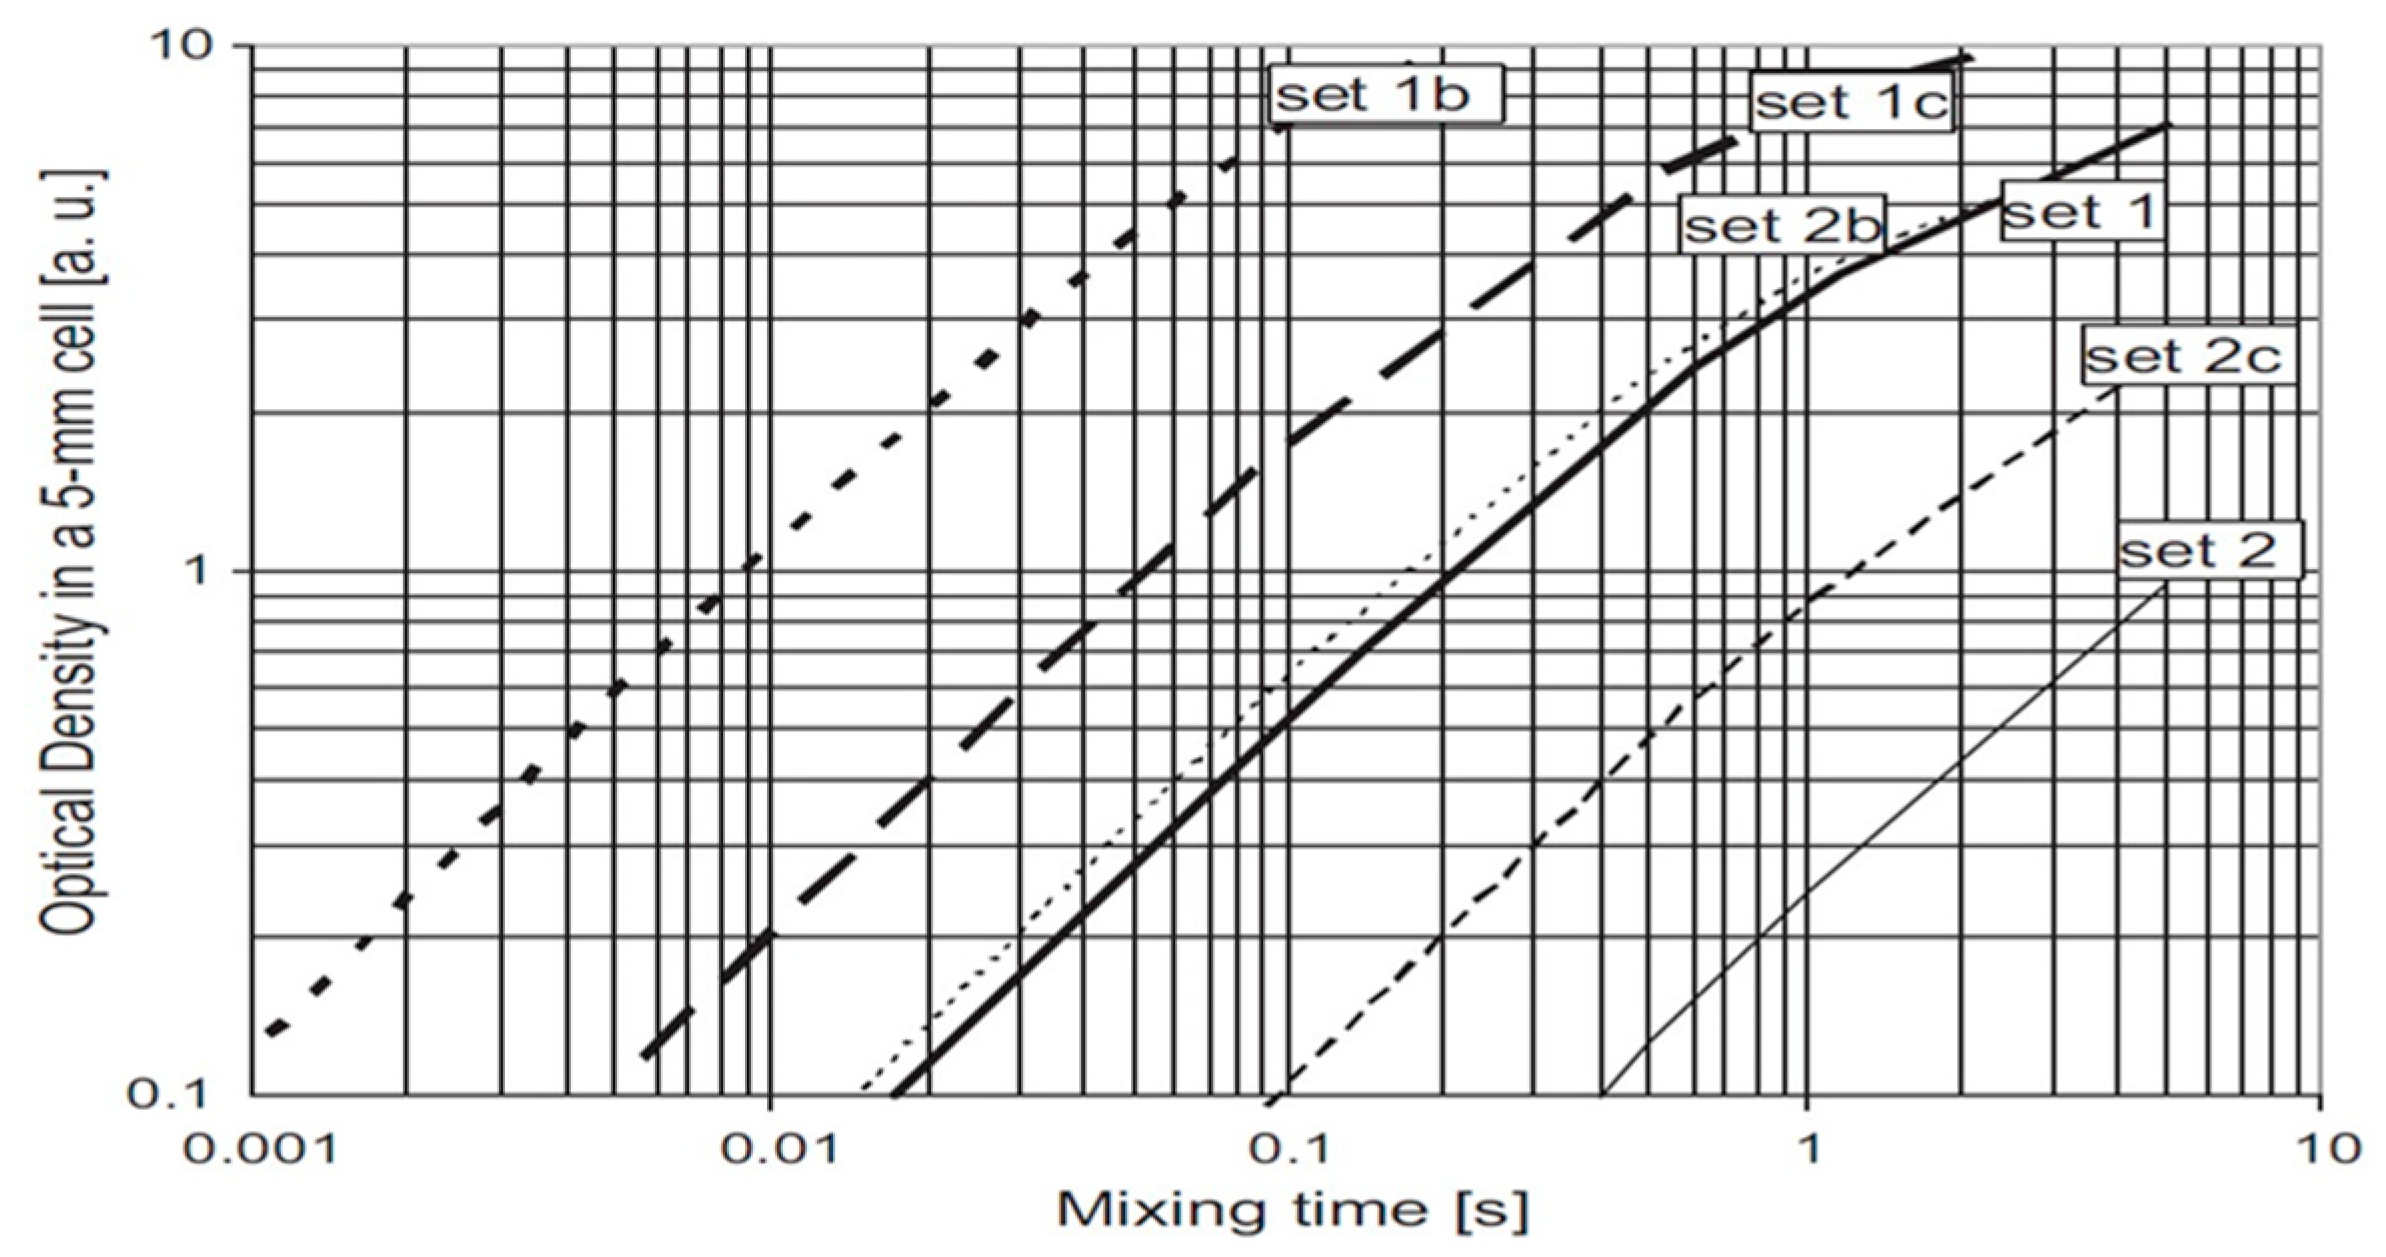
To determine the mixing performance of each of the micromixers, the iodine absorbance of the product of each of the flow rates in every micromixer was measured using a wavelength of 344 nm to 354 nm in a UV spectrophotometer. Each product from the micromixers was poured into a cuvette and placed into the UV spectrum for the absorbance reading of each sample. Clear distilled water was used as the zero point of the UV spectrophotometer reading. Each product of a given flow rate was measured repeatedly four times and the averages of the best two readings were calculated. The time required for the mixing of the acid and buffer reagents to fully mix was termed the mixing time. In order to determine the mixing time for each of the flow rates in each sample, we first measured the absorbance in each of the products obtained from the mixing. We then obtained the optical density. Then, with the chosen concentration of the acid and buffer solution, as stated by Commenge et al., 2011 [11], the mixing time was obtained from Figure 2, using the concentrations shown in Table 1.
A factor that we considered when choosing our concentration set was the validity of the spectrophotometry measurement using the Beer–Lambert law, which was used to measure the optical density and how it relates to the triiodide concentration in the solution [12].
In order to validate our result from the graph, we then performed a numerical calculation using the formula
tm = 0.33(OD)[H+]−4.55[KI]−1.5[KIO3]5.8[NaOH]−2[H3BO3]−2
where tm is the mixing time in which the reagent solution flowing through the channel will mix, OD is the optical density of the absorbance, [H+] is the concentration of the acid, [KI] is the concentration of the potassium iodide, [KIO3] is the concentration of the potassium iodate, [NaOH] is the concentration of the sodium hydroxide used, and [H3BO3] is the concentration of the boric acid used.

3. Results and Discussion

3.1. Micromixer Design and Effect of Reynolds Number on Flow Rate in Each Micromixer

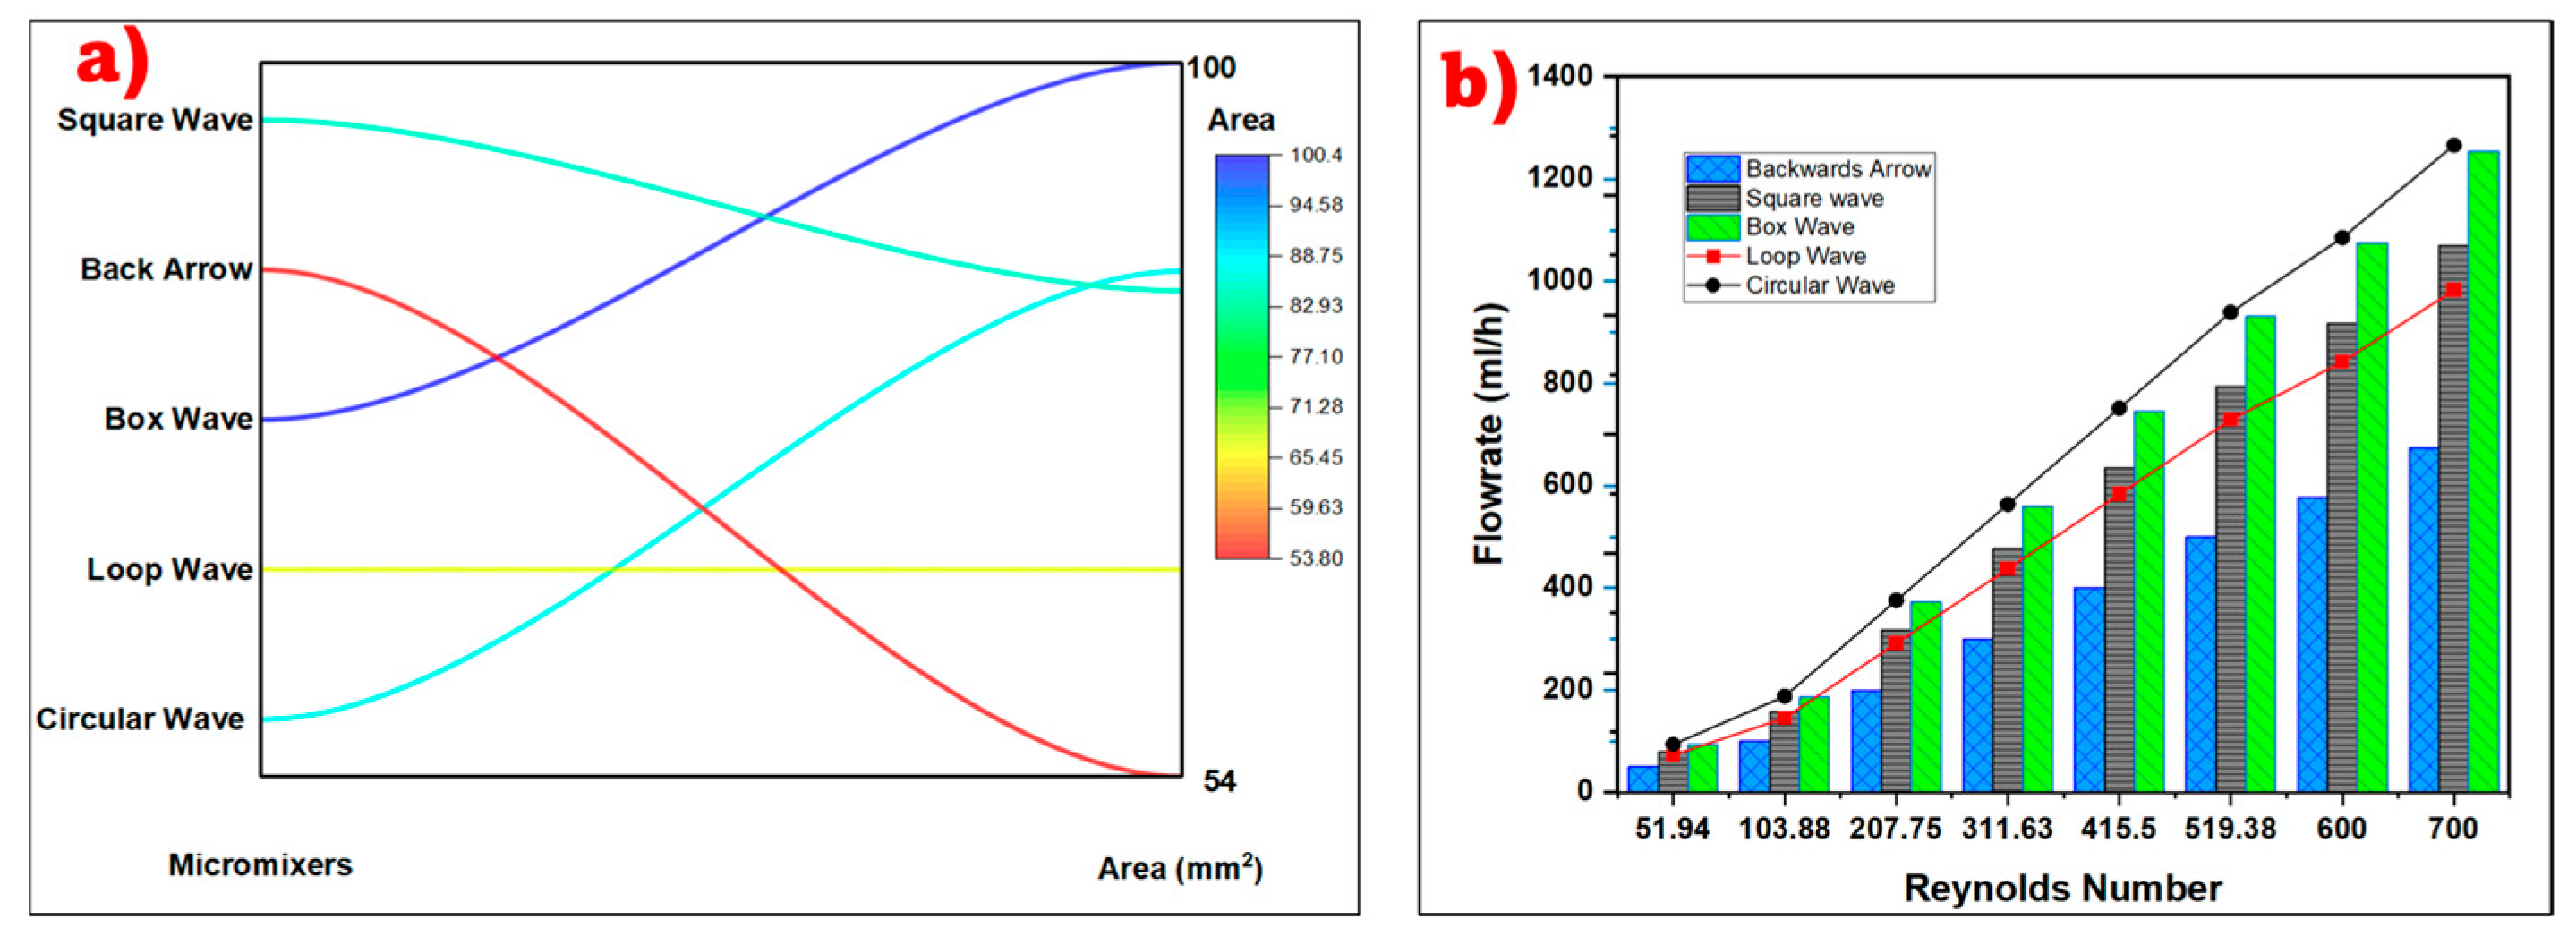
After designing the micromixers, it was observed that each micromixer had a different surface area but the same length and diameter, as shown in Figure 3a. The variations in the surface area among the different micromixer designs can be attributed to their unique structural configurations. An analysis of Figure 3 reveals that the backward arrow micromixer exhibits the smallest area, a consequence of its simplistic design that extends in a straight rectangular form without any subsequent modifications beyond the initial arrowhead motif. In contrast, the box-wave design boasts the largest area, attributed to its composition of two repeating square boxes interconnected by a slender rectangle. This is closely followed by the circular-wave micromixer, which features a design of two repeating circles, each linked by a narrow rectangle. The square-wave design occupies the middle ground in terms of area, being larger than the loop-wave but smaller than the circular-wave design. This is due to the distinctive 90-degree angles present within each sinusoidal segment of its design, which contribute to its intermediate spatial footprint [7]. Within the range of Reynolds numbers from 50 to 700, distinct flow rates for each type of fabricated micromixer were observed, as illustrated in Figure 3b. The variability in the flow rates is attributed to the diverse configurations and surface areas of the micromixers.
The result indicates that the box-wave micromixer achieved the highest flow rate across all selected Reynolds numbers in the experiments, following the descending order of box-wave > circular-wave > square-wave > loop-wave > backward arrow. This hierarchy is primarily due to the box-wave design’s superior area, which is the largest among the designs, with the circular-wave appearing next. The specific structural dimensions of these micromixers directly influence their capacity to handle different flow rates, with larger areas facilitating higher flows.

3.2. Evaluating Mixing Efficiency for Backward Arrow and Loop-Wave Micromixers

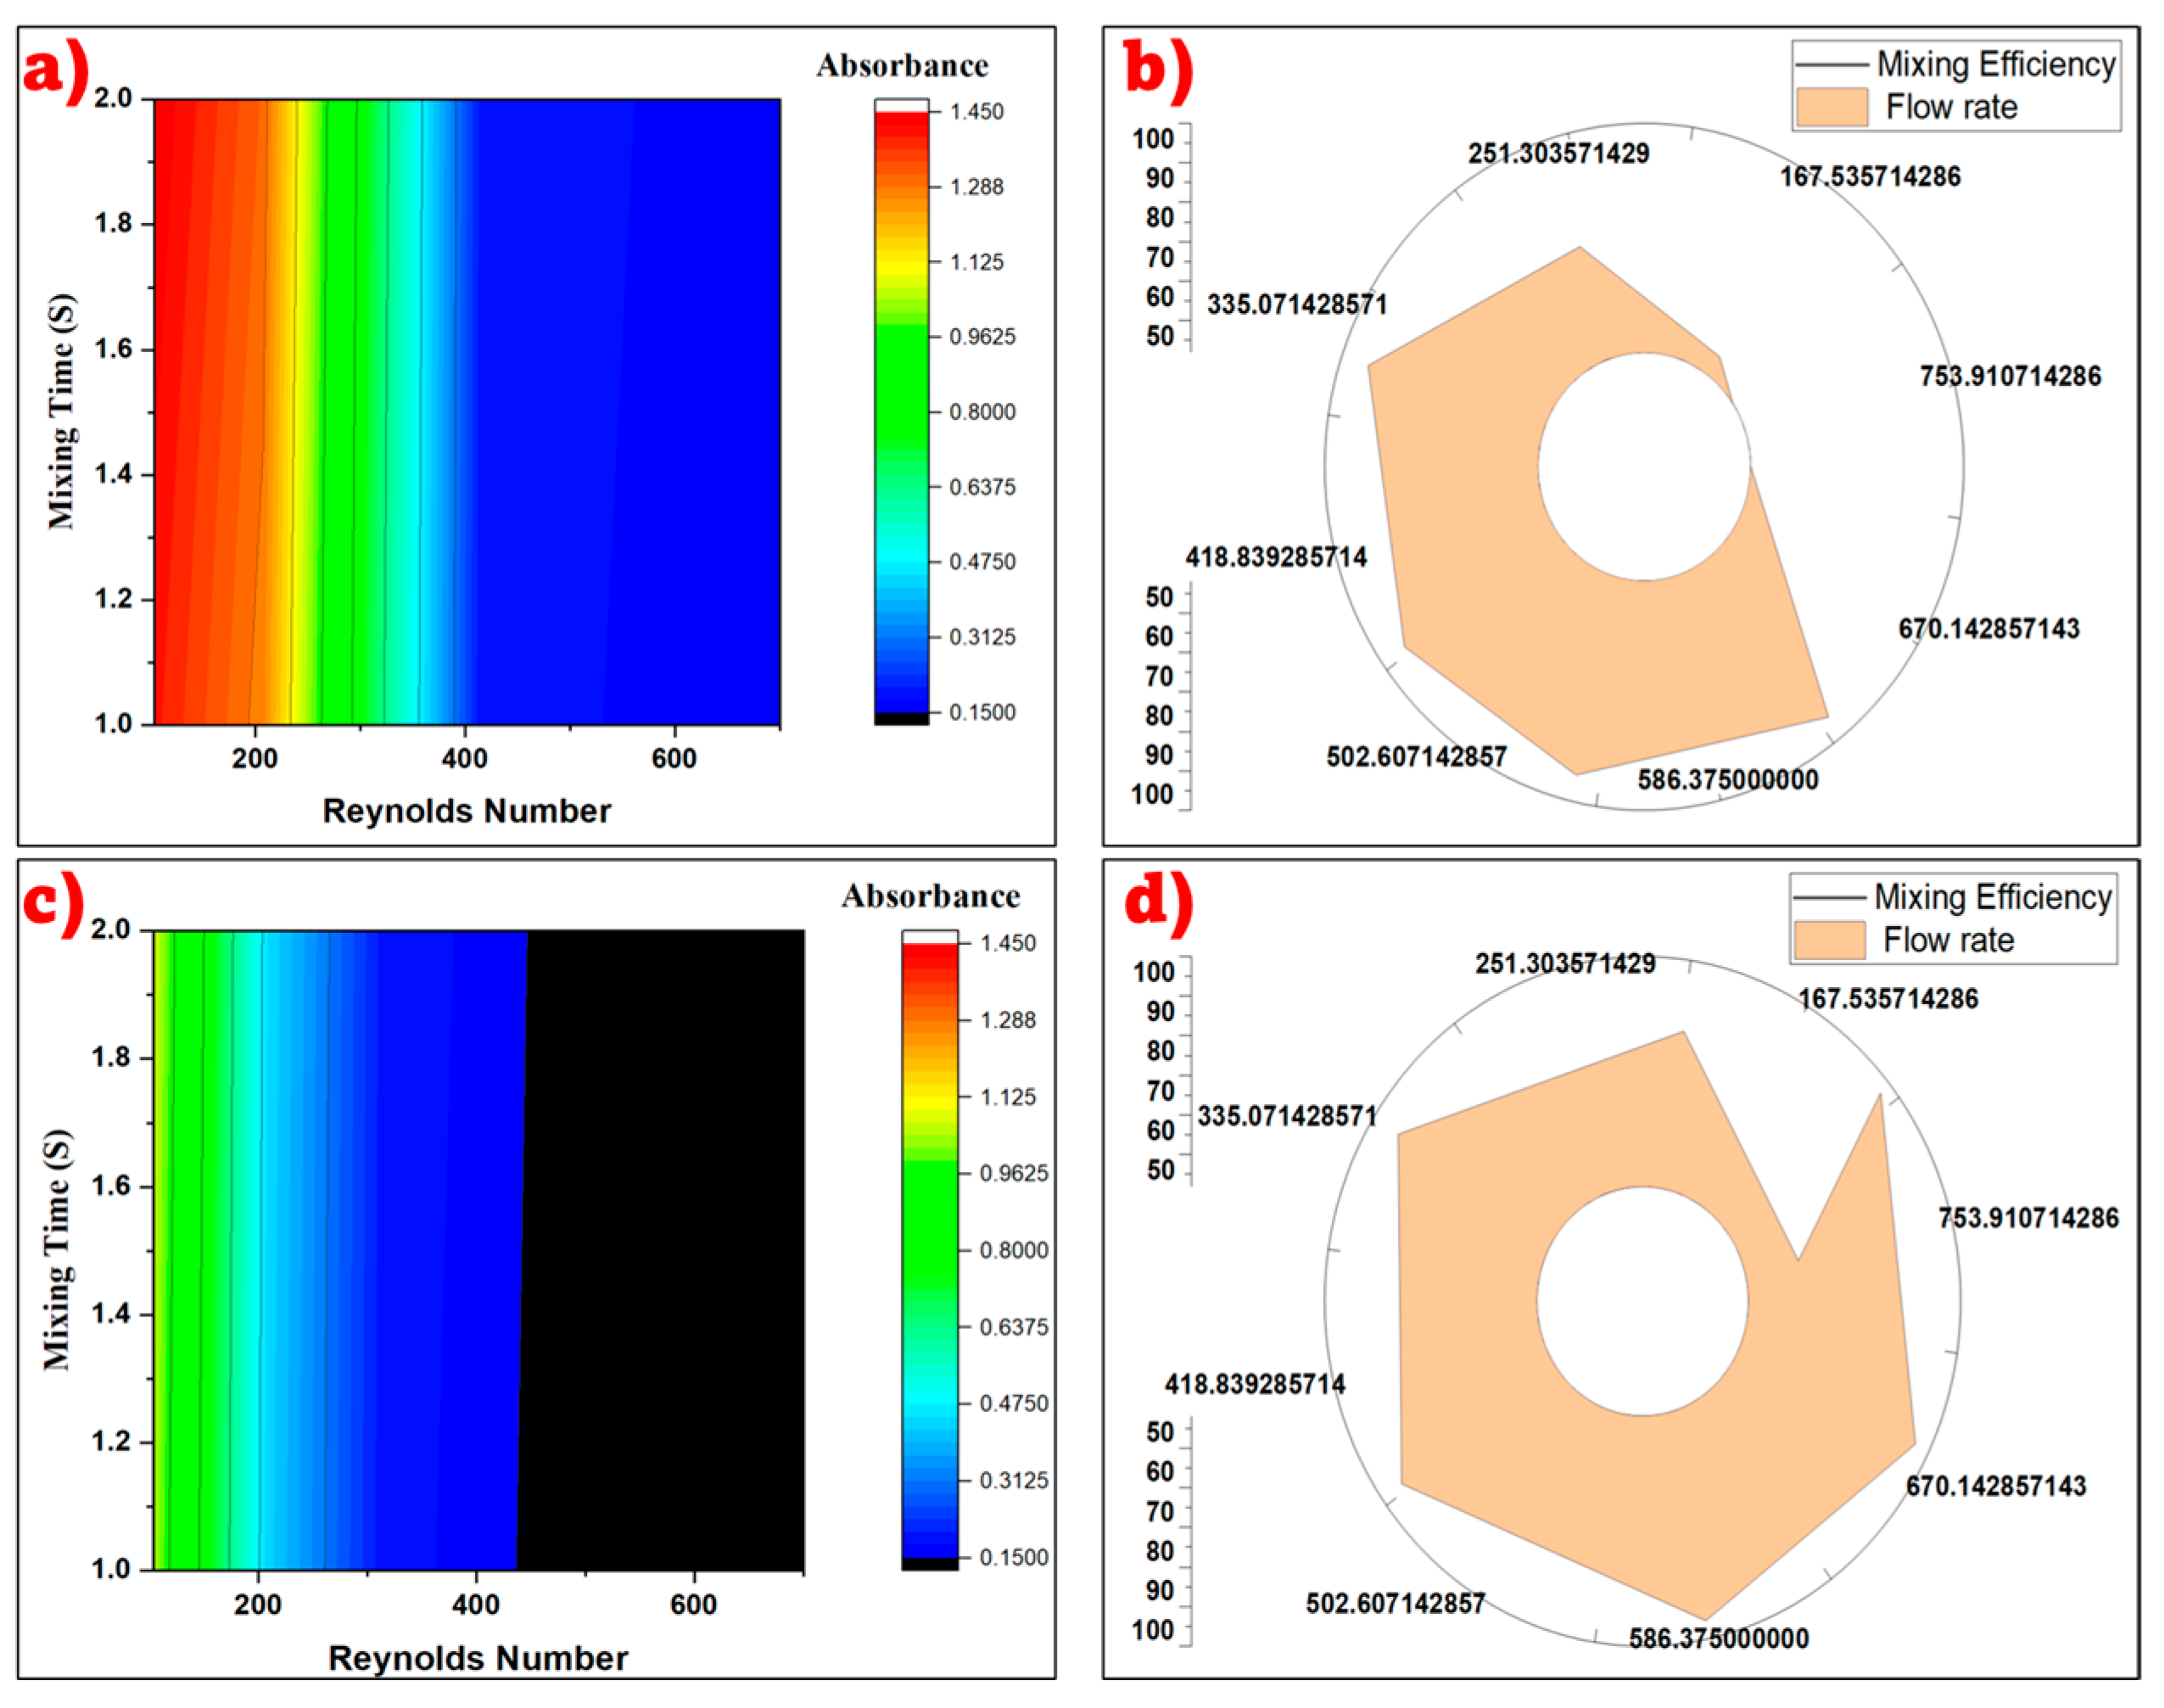
The backward arrow micromixer features an arrow-shaped inlet and a micro-rectangular-shaped outlet. The arrow shape has a contact angle of 60 degrees. The initial contact of the inlet fluid occurs at a 60-degree angle, generating collision and commingling forces at the contact point walls. An increase in the Reynolds number of the flowing fluid enhances the flow rate within the channel, thereby augmenting the collision and commingling activities. This improvement in the mixing performance reduces the aging effects, which could compromise the mixing efficiency, as illustrated in Figure 4a,b.
The loop-wave micromixer incorporates a backward arrow inlet and a unimodal crest and trough. The initial contact of the inlet fluid, comprising an acid and buffer, occurs at the arrow point with a 60-degree angle, resulting in collision and commingling. The fluid subsequently traverses the sinusoidal crest, colliding with the walls and commingling. It then proceeds to the trough in a repeated perturbation, enhancing the mixing performance compared to the backward arrow design. As depicted in Figure 4c,d, an increase in the Reynolds number correlates with a decrease in absorbance and mixing time, indicating the superior mixing performance of the loop-wave design. Furthermore, an increase in the Reynolds number elevates the flow rate, thereby improving the mixing efficiency in the loop-wave design from 98.92% to 99.915%.

3.3. Evaluating Mixing Efficiency for Square-Wave and Circular-Wave Micromixers

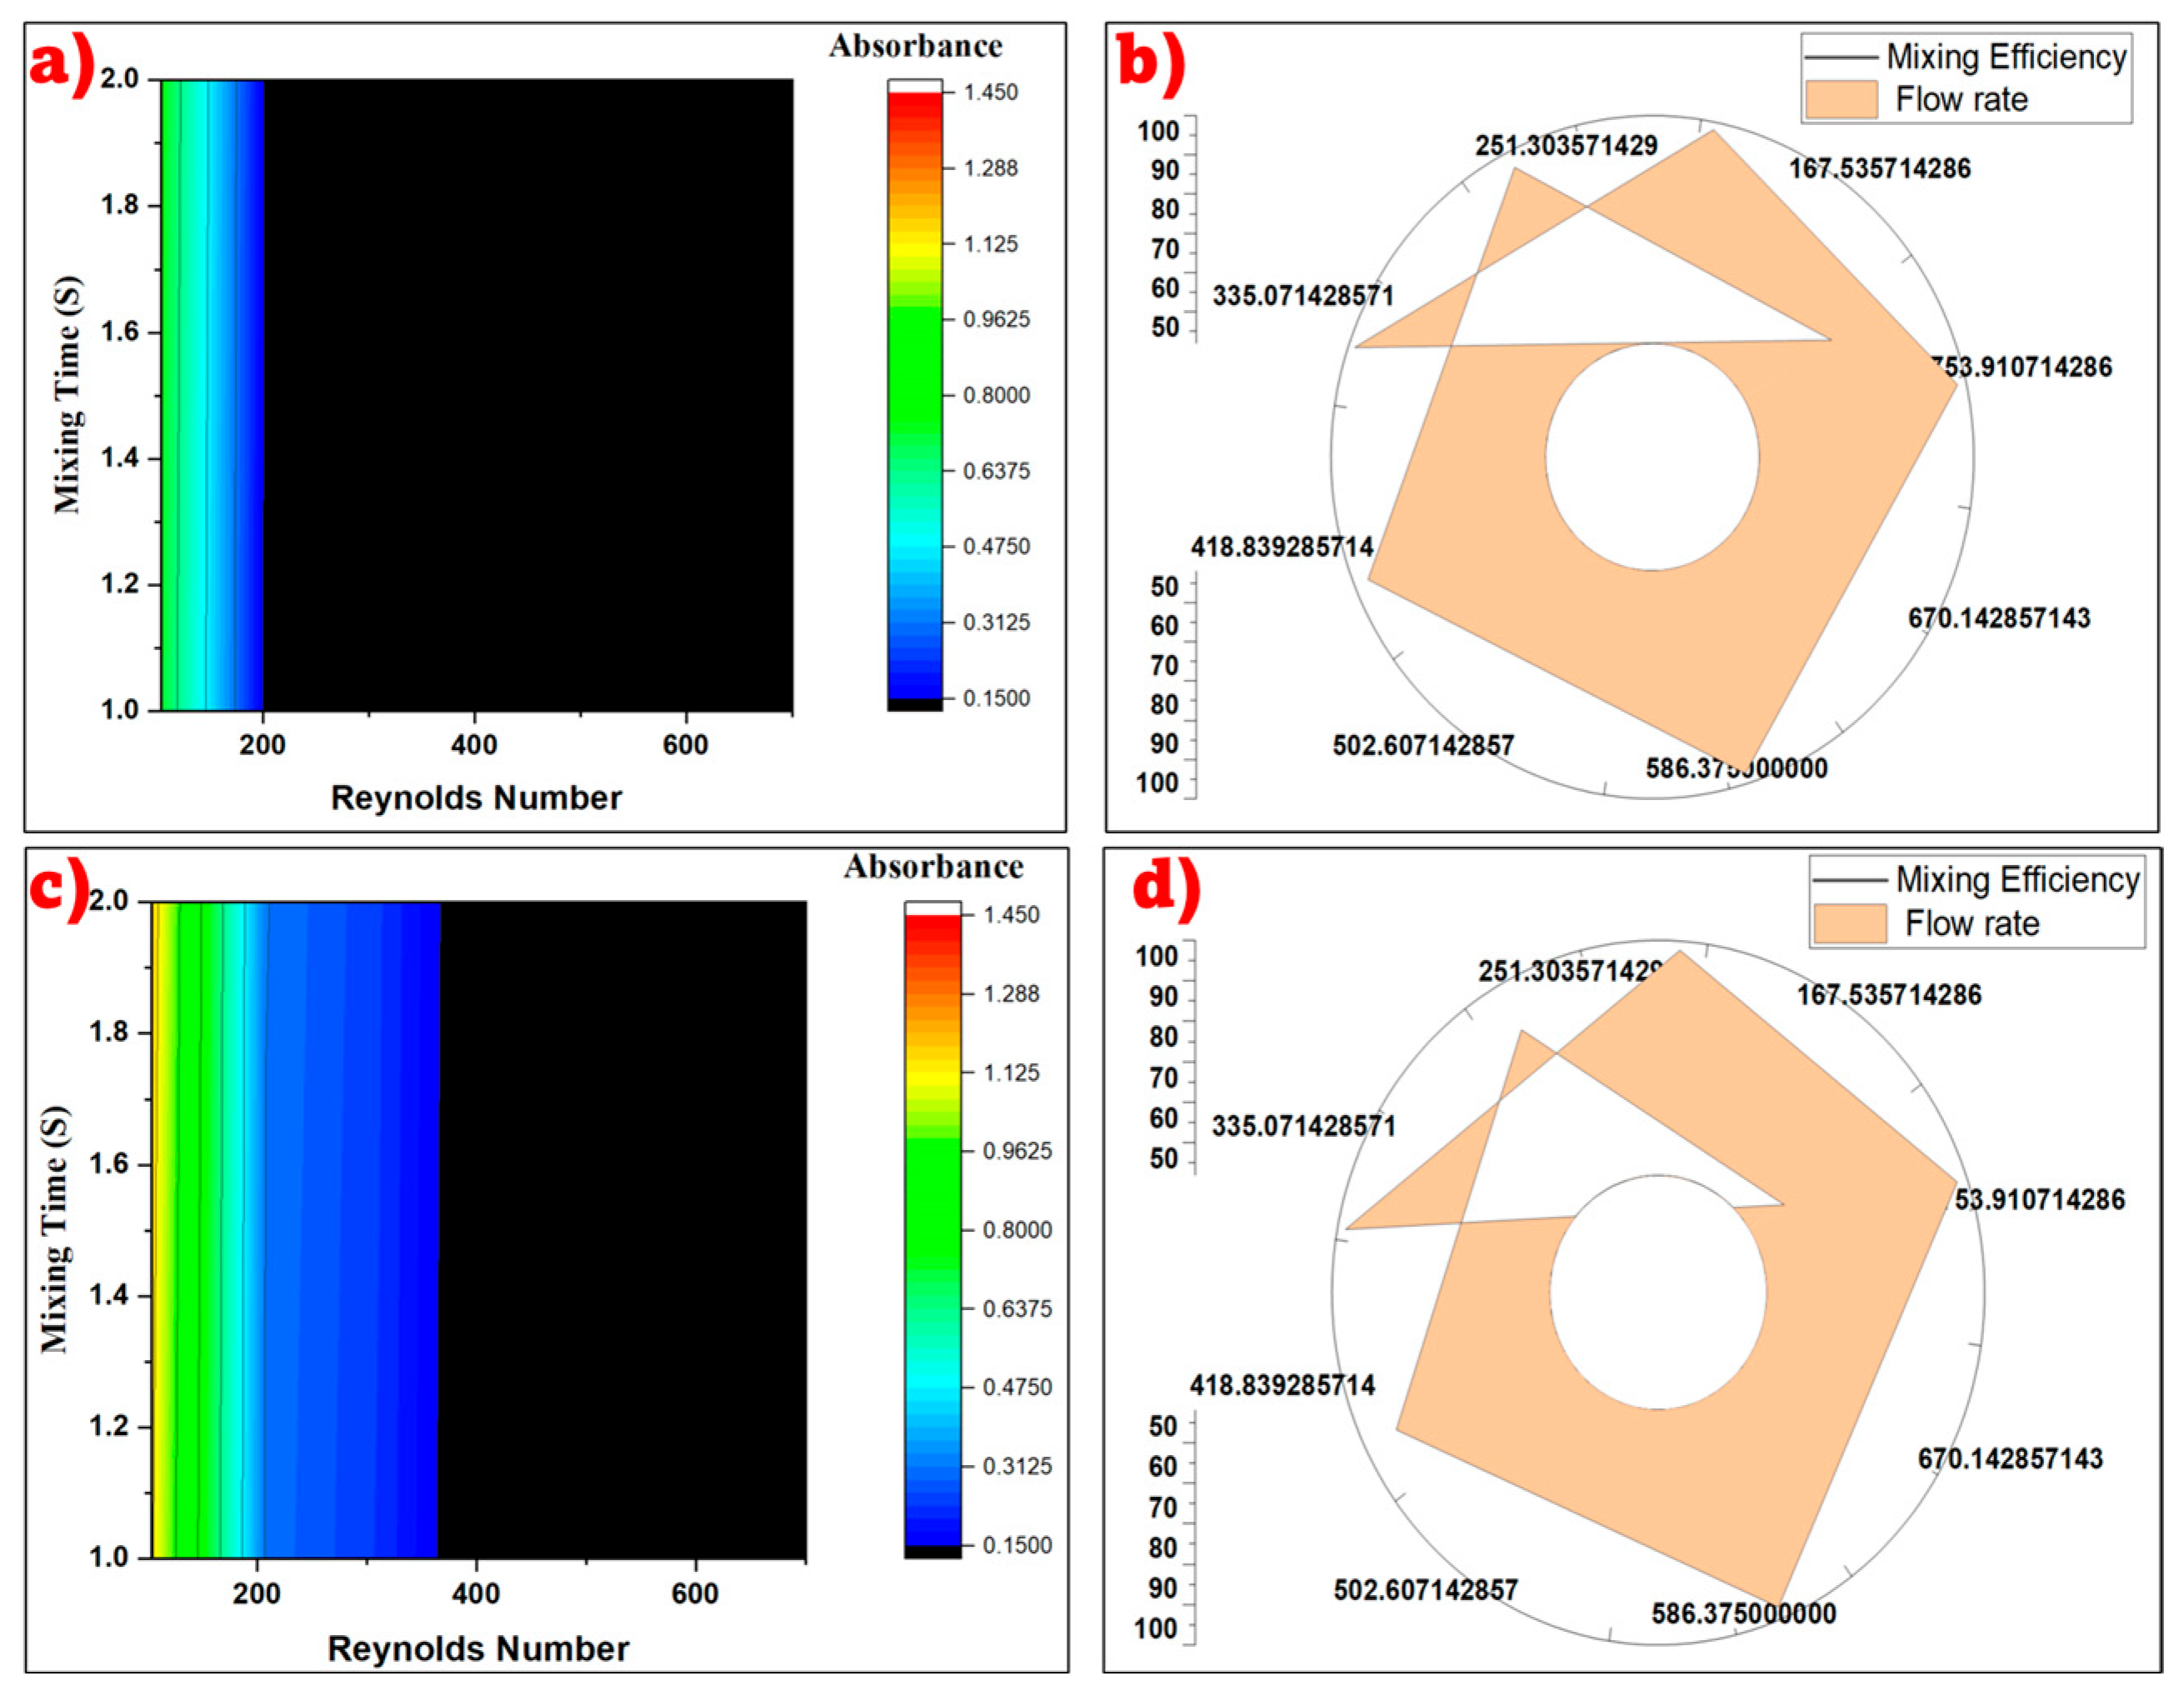
In this type of micromixer, the inlet is arrow-shaped, and the channel features sinusoidal movements with 90-degree corners at the crests and troughs. There are 11 contact points along the walls as the fluid traverses the channel. The initial contact point has an angle of 60 degrees, while the subsequent points have angles of 90 degrees, creating repeated perturbations, as illustrated in Figure 5. As the fluid progresses through the mixer, collision and commingling activities occur at the initial contact point and are subsequently repeated at the remaining corners, promoting efficient mixing compared to the backward arrow and loop-wave designs.
As the Reynolds number increases, as shown in Figure 5a, both the absorbance and mixing time decrease, indicating enhanced mixing performance due to continuous turbulence within the mixer. Additionally, Figure 5b demonstrates that as the flow rate increases, there is a sharp rise in the mixing efficiency from 99.25% to 99.9%. This improvement is attributed to the aging effect, which typically occurs at lower flow rates in micromixers. Despite this, the results are superior to those of the loop-wave configuration, which lacks angles. At the highest flow rate of 1069 mL/h, the mixer achieves mixing efficiency of 99.96%, which is approximately 100%, as shown in Figure 5a,b. This finding aligns with other research indicating that geometric designs with sharp angles and repeated perturbations enhance the mixing efficiency [13].
The circular-wave micromixer features repeating circular structures connected to a backward arrow, as illustrated in Figure 5c. Initial fluid mixing occurs at the arrow corner, which has an angle of 60 degrees. This is followed by a split and recombination in the first circular configuration, and another split and recombination in the second circular configuration. The split and recombination effect induces head-on collisions with engulfment flow as the fluid moves through the mixer, thereby promoting efficient mixing, as shown in Figure 5d. As the Reynolds number increases from 100 to 700, there is a corresponding decrease in the absorbance and mixing time, indicating improved mixing performance. Furthermore, as the flow rate increases, the mixing efficiency also rises from 98.8% to 99.945%, demonstrating superior mixing performance. This performance is consistent with other published works in this area [14].

3.4. Evaluating Mixing Efficiency for Box-Wave Micromixer

In this type of micromixer, the backward arrow shape is connected to a repeating square configuration with 90-degree corner angles. The fluid first encounters the arrow corner at a 60-degree angle, followed by split and recombination processes as it moves towards the 90-degree corners in the square shape. This flow process is repeated throughout the channel until the mixed fluids exit. This activity within the channel promotes efficient mixing at high flow rates in a box-wave micromixer. However, it was observed that the 90-degree corners in the split and recombination process affected the mixing time (aging), thereby reducing the mixing efficiency at low Reynolds numbers, as shown in Figure 6a,b. As the Reynolds number increases from 100 to 700, there is a progressive decrease in the absorbance and mixing time, indicating the good mixing ability of the micromixer. Furthermore, as the flow rate increases, there is an increase in mixing efficiency. The mixing efficiency increases sharply from a flow rate of 186 mL/h to 600 mL/h, followed by a gradual increase, demonstrating the good mixing performance of the box-wave micromixer. This is consistent with the findings from Jian et al. (2024) [15], which indicate that larger surface areas in micromixers facilitate higher flow rates.

4. Conclusions

This study evaluated the mixing efficiency of five distinct micromixer designs, namely backward arrow, loop-wave, square-wave, circular-wave, and box-wave, using the Villermaux–Dushman protocol, across various Reynolds numbers (Re) ranging from 50 to 700. This comprehensive evaluation incorporated UV absorbance data, calculated mixing times, and experimental analyses, including the fabrication and design of the micromixers. The findings reveal that the square-wave micromixer outperforms the other designs in terms of mixing efficiency at higher Reynolds numbers, while the backward arrow design ranks lowest in efficiency. Notably, between Reynolds numbers 200 and 700, all micromixers exhibited a consistent improvement in mixing efficiency, indicating a stable performance enhancement within this range. The research also highlights that the micromixer efficiency is particularly sensitive to variations at lower Reynolds numbers, where stability in mixing performance is less assured. Moreover, the study suggests that strategic design elements, such as shape confluence, can significantly bolster the mixing efficiency as the Reynolds numbers increase. To mitigate the impact of time delays on the mixing outcome, the implementation of in situ UV spectrophotometry for absorbance measurement is recommended, offering a more immediate evaluation of the mixing effectiveness.

Author Contributions

Conceptualization, K.S. and J.A.; methodology, K.S. and J.A.; validation, K.S. and J.A.; formal analysis, K.S. and J.A.; investigation, K.S. and J.A.; writing—original draft, K.S. and J.A.; writing—review and editing, K.S., J.A. and A.H.E.-S.; supervision, A.H.E.-S. All authors have read and agreed to the published version of the manuscript.

Funding

This research received no external funding.

Institutional Review Board Statement

Not applicable.

Informed Consent Statement

Not applicable.

Data Availability Statement

Not applicable.

Acknowledgments

The authors want to express their appreciation to the Chemical and Petrochemical Engineering Department (CPE) and Egypt-Japan University of Science and Technology (E-JUST) for providing technical support.

Conflicts of Interest

The authors declare no conflicts of interest.

References

  1. Dartoomi, H.; Khatibi, M.; Ashrafizadeh, S.N. Importance of nanochannels shape on blue energy generation in soft nanochannels. Electrochim. Acta 2022, 431, 141175. [Google Scholar] [CrossRef]
  2. Amit, K.; Datta, A.; Biswas, N.; Das, S.; Das, P. Designing of microsink to maximize the thermal performance and minimize the Entropy generation with the role of flow structures. Int. J. Heat Mass Transf. 2021, 176, 121421. [Google Scholar] [CrossRef]
  3. Gayen, B.; Manna, N.K.; Biswas, N. Enhanced mixing quality of ring-type electroosmotic micromixer using baffles. Chem. Eng. Process.-Process Intensif. 2023, 189, 109381. [Google Scholar] [CrossRef]
  4. Ahmed, D.; Mao, X.; Shi, J.; Juluri, B.K.; Huang, T.J. A millisecond micromixer via single-bubble-based acoustic streaming. Lab Chip. 2009, 9, 2738–2741. [Google Scholar] [CrossRef] [PubMed]
  5. Bayareh, M.; Ashani, M.N.; Usefian, A. Active and passive micromixers: A comprehensive review. Chem. Eng. Process.-Process Intensif. 2019, 147, 107771. [Google Scholar] [CrossRef]
  6. Khatibi, M.; Mehta, S.K.; Ashrafizadeh, S.N.; Mondal, P.K. Surface charge-dependent slip length modulates electroosmotic mixing in a wavy micromixer. Phys. Fluids 2024, 36, 073105. [Google Scholar] [CrossRef]
  7. Safo, K. Investigations of the mixing e ffi ciency of fi ve novel micromixer designs with backward arrow inlet using the Villermaux Dushman protocol. Int. J. Chem. React. Eng. 2024, 22, 1–11. [Google Scholar] [CrossRef]
  8. Cai, G.; Xue, L.; Zhang, H.; Lin, J. A review on micromixers. Micromachines 2017, 8, 274. [Google Scholar] [CrossRef] [PubMed]
  9. Zschieschang, E.; Pfeifer, P.; Schebek, L. Environmentally optimized microreactor design through Life Cycle Assessment. Green Process. Synth. 2012, 1, 375–384. [Google Scholar] [CrossRef]
  10. Watts, P.; Wiles, C. Recent advances in synthetic micro reaction technology. Chem. Commun. 2007, 5, 443–467. [Google Scholar] [CrossRef] [PubMed]
  11. Commenge, J.M.; Falk, L. Villermaux-Dushman protocol for experimental characterization of micromixers. Chem. Eng. Process. Process Intensif. 2011, 50, 979–990. [Google Scholar] [CrossRef]
  12. Okwundu, O.S.; Fuseini, M.; El-Shazly, A.H.; Elkady, M.F. Comparison of mixing performances of T, Y and arrow-shaped micromixers using Villermaux–Dushman protocol at low Reynolds number. J. Serbian Chem. Soc. 2020, 85, 381–394. [Google Scholar] [CrossRef]
  13. Gande, V.V.; Podupu, P.K.R.; Berry, B.; Nere, N.K.; Pushpavanam, S.; Singh, M.R. Engineering advancements in microfluidic systems for enhanced mixing at low Reynolds numbers. Biomicrofluidics 2024, 18, 011502. [Google Scholar] [CrossRef] [PubMed]
  14. Kumar, A.; Manna, N.K.; Sarkar, S.; Biswas, N. Enhancing mixing efficiency of a circular electroosmotic micromixer with cross-reciprocal electrodes. Phys. Fluids 2024, 36, 083626. [Google Scholar] [CrossRef]
  15. Bodies, S. Numerical Study on the Hydraulic and Mixing Performance of Fluid Flow within a Channel with Different Numbers of Sector Bodies. Water 2024, 16, 2451. [Google Scholar] [CrossRef]
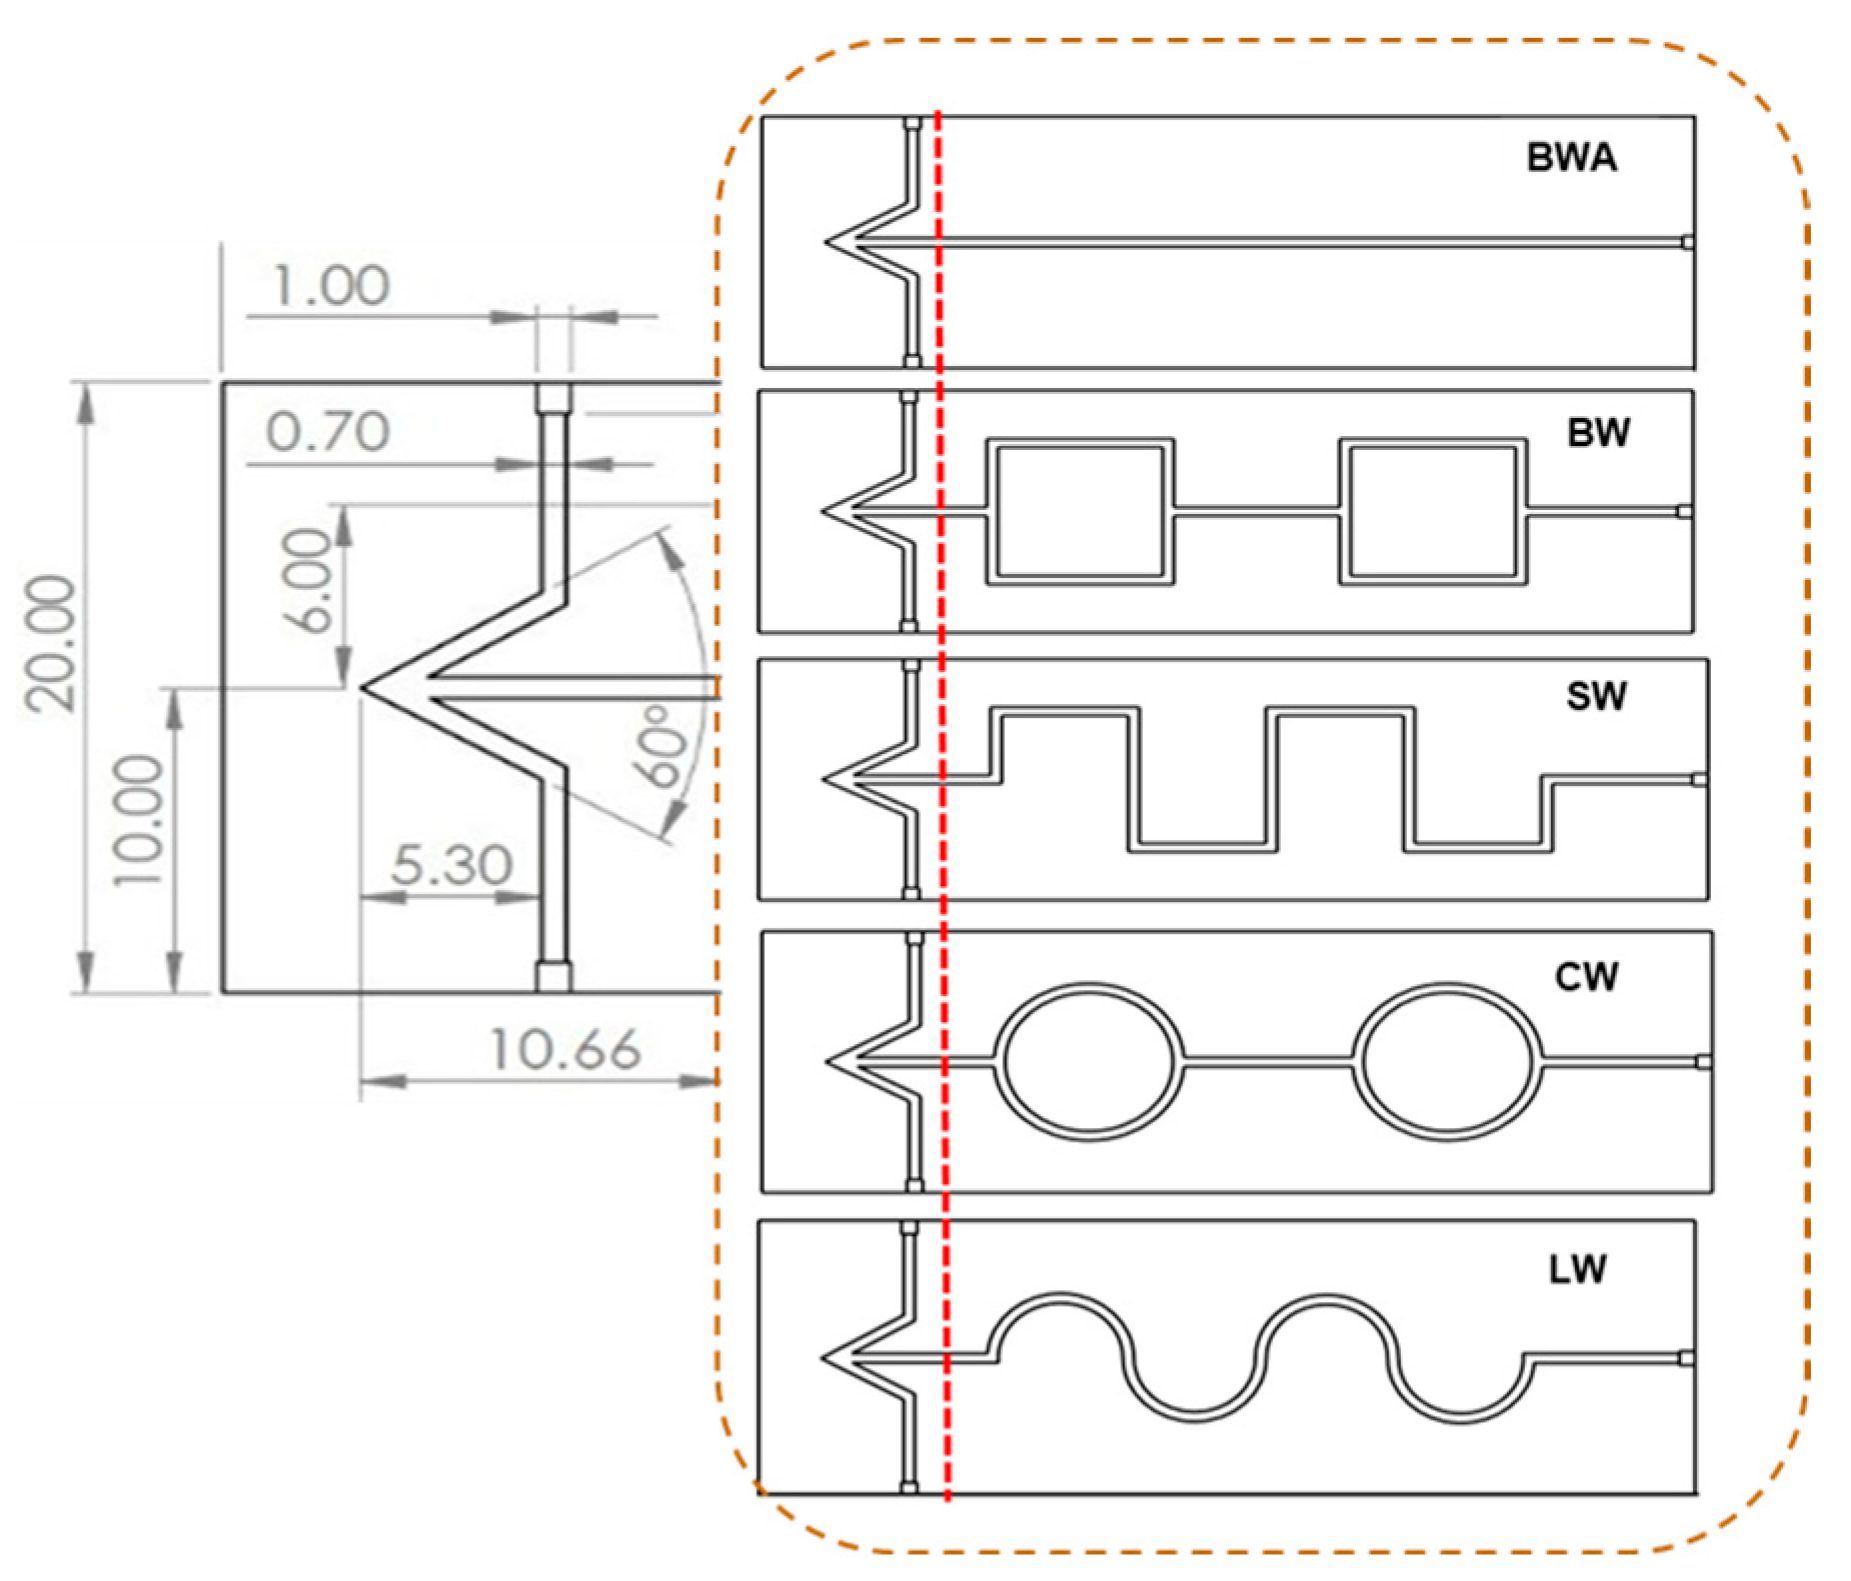
Figure 1. Geometry of backwards arrow front shape with five different configurations: backwards arrow (BWA) and box-wave (BW), square-wave (SW), circular-wave (CW) and loop-wave (LW).
Engproc 67 00054 g001
Figure 2. Graph of optical density against mixing time measured in seconds [11].
Engproc 67 00054 g002
Figure 3. (a) Graph of each micromixer against its area and (b) graph of Reynolds number against flow rate for each micromixer fabricated.
Engproc 67 00054 g003
Figure 4. (a,b) Backward arrow and (c,d) loop-wave microchannel mixing efficiency at varying Reynolds numbers, absorbance flow rates, and mixing times.
Engproc 67 00054 g004
Figure 5. (a,b) Square-wave and (c,d) circular-wave microchannel mixing efficiency at varying Reynolds numbers, absorbance flow rates, and mixing times.
Engproc 67 00054 g005
Figure 6. (a,b) Box-wave microchannel mixing efficiency at varying Reynolds numbers, absorbance flow rates, and mixing times.
Engproc 67 00054 g006
Table 1. Concentrations that can be used in a micromixer with an equal inlet flow rate.
C [mol/L]11b1c22b2c
[H+]0.030.060.040.0150.030.02
[KI]0.0320.0320.0320.0160.0160.016
[KIO3]0.0060.0060.0060.0030.0030.003
[NaOH]0.090.090.090.0450.0450.045
[H3BO3]0.090.090.090.0450.0450.045
Disclaimer/Publisher’s Note: The statements, opinions and data contained in all publications are solely those of the individual author(s) and contributor(s) and not of MDPI and/or the editor(s). MDPI and/or the editor(s) disclaim responsibility for any injury to people or property resulting from any ideas, methods, instructions or products referred to in the content.