
Performance Assessment of a Photovoltaic Cell Coupled with a Thermoelectric Generator †


Abstract
1. Introduction
2. Experimental Methods
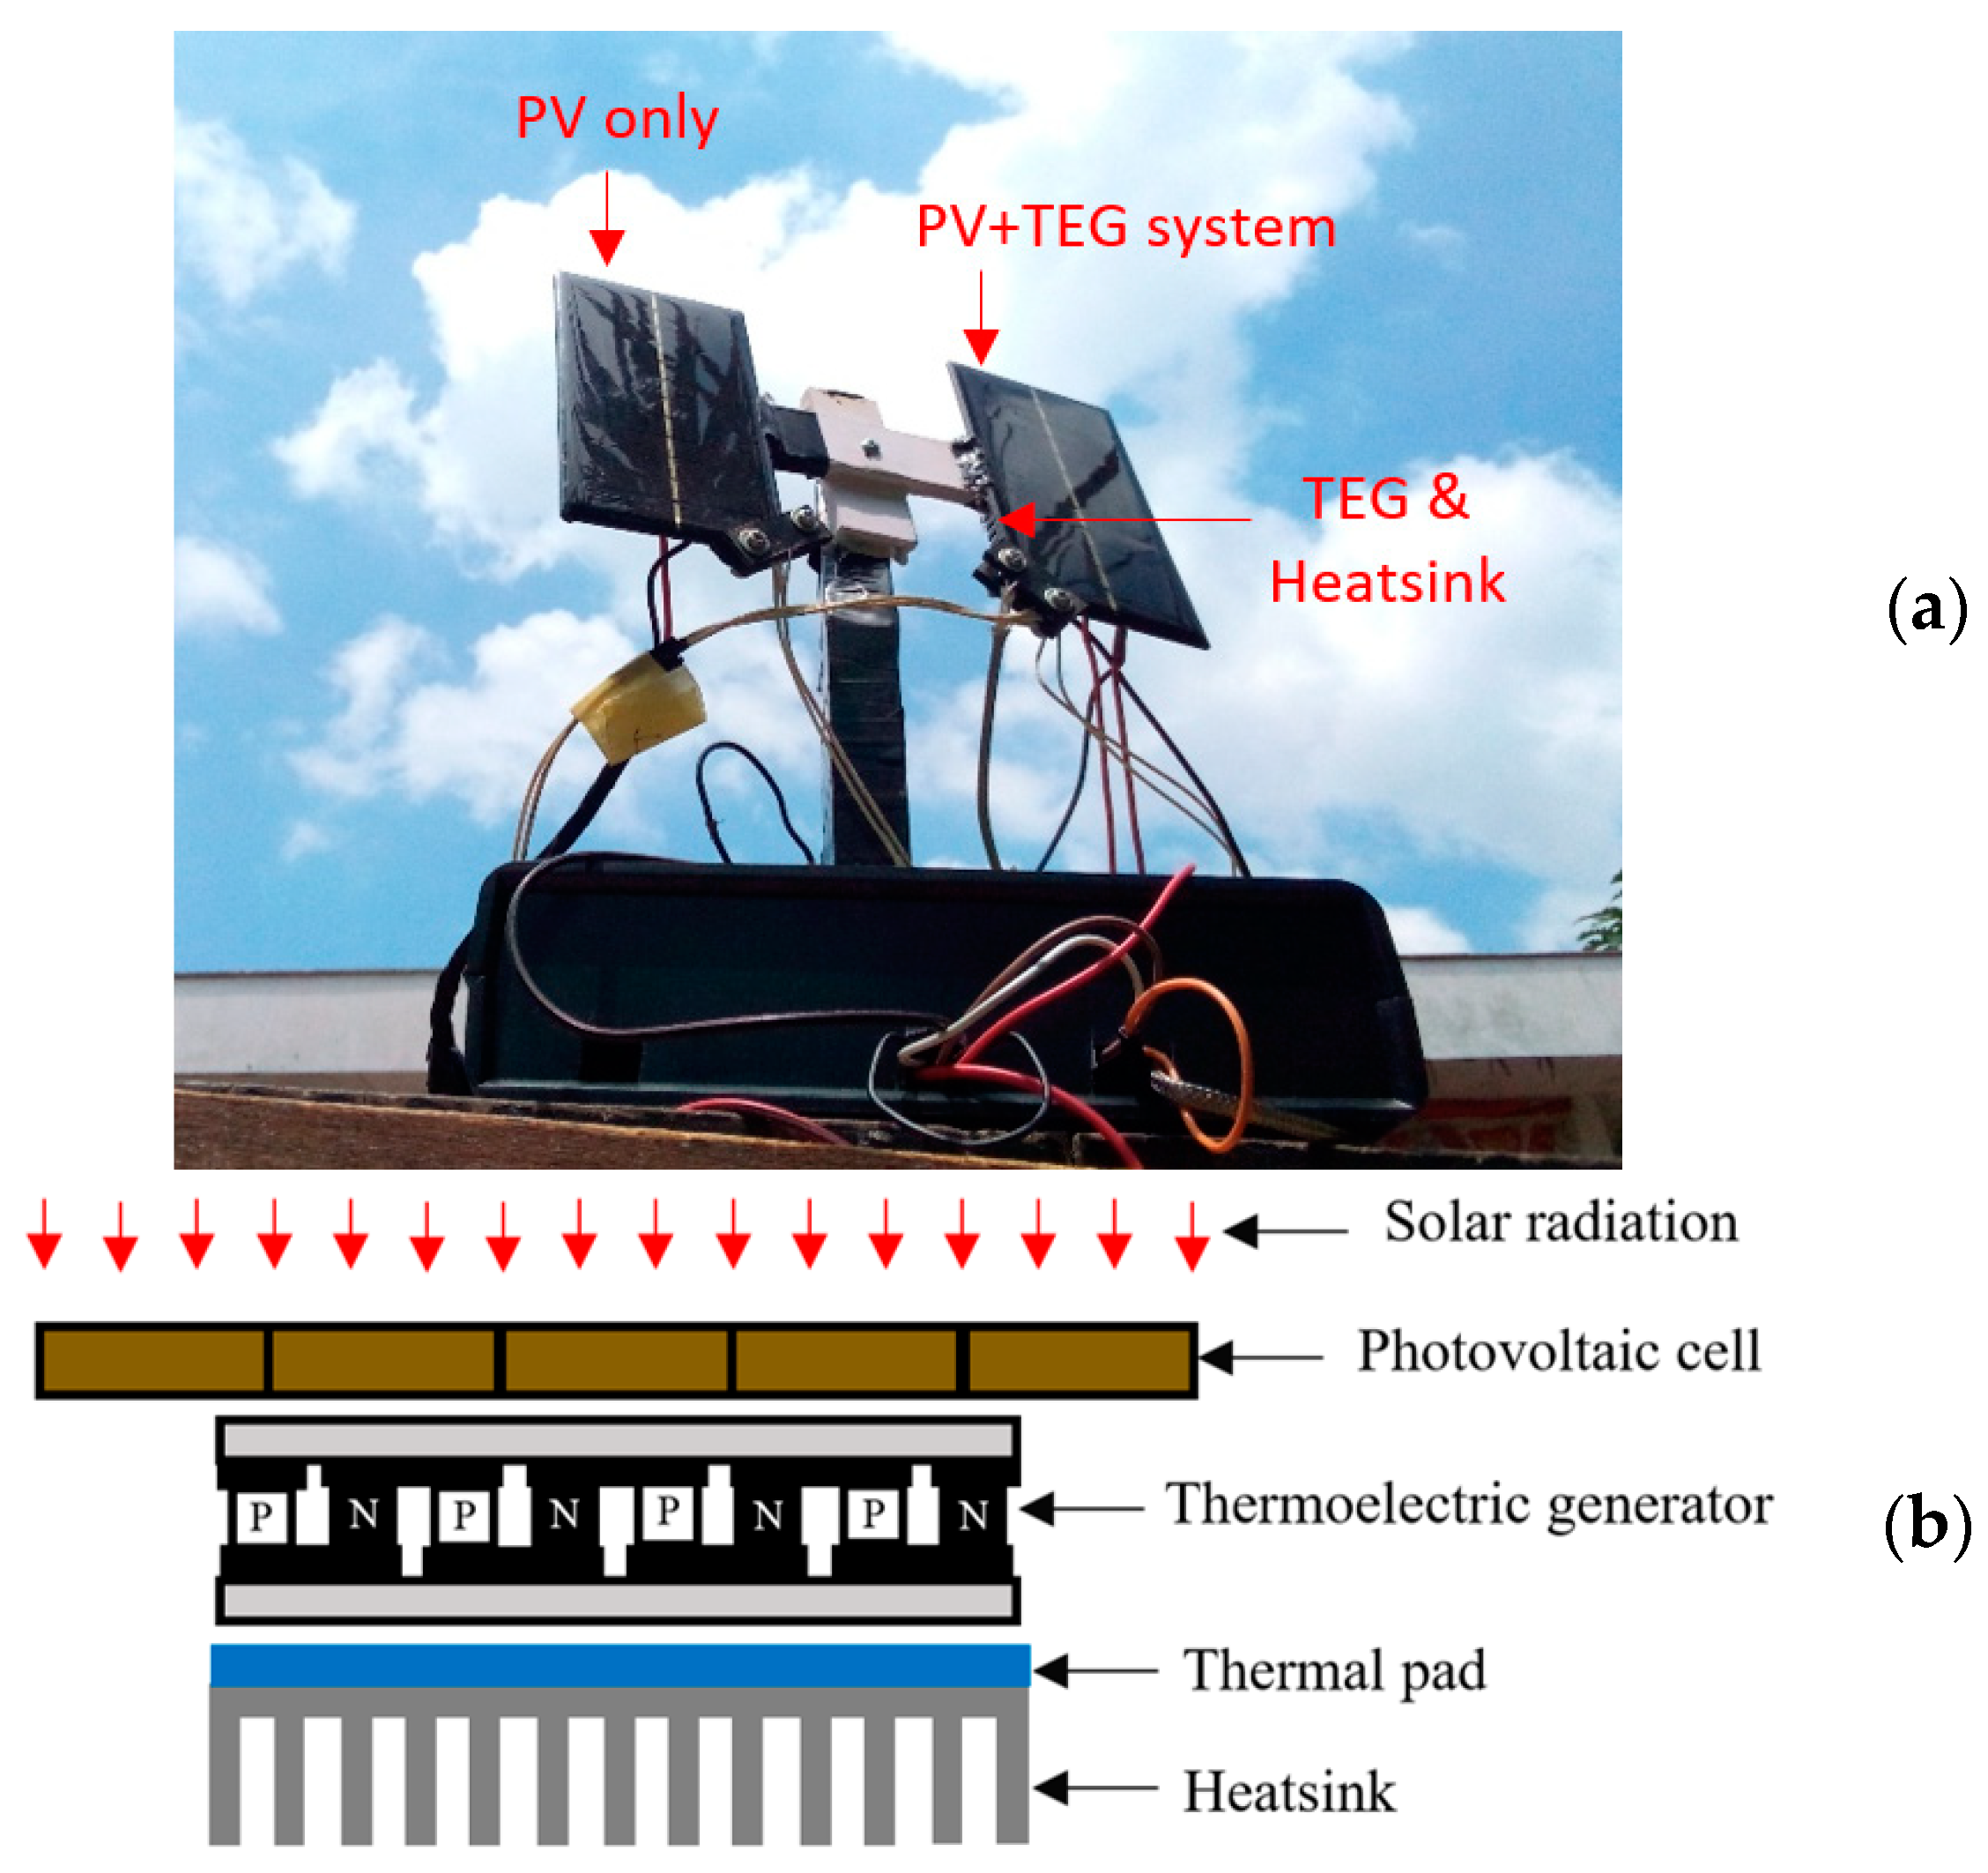
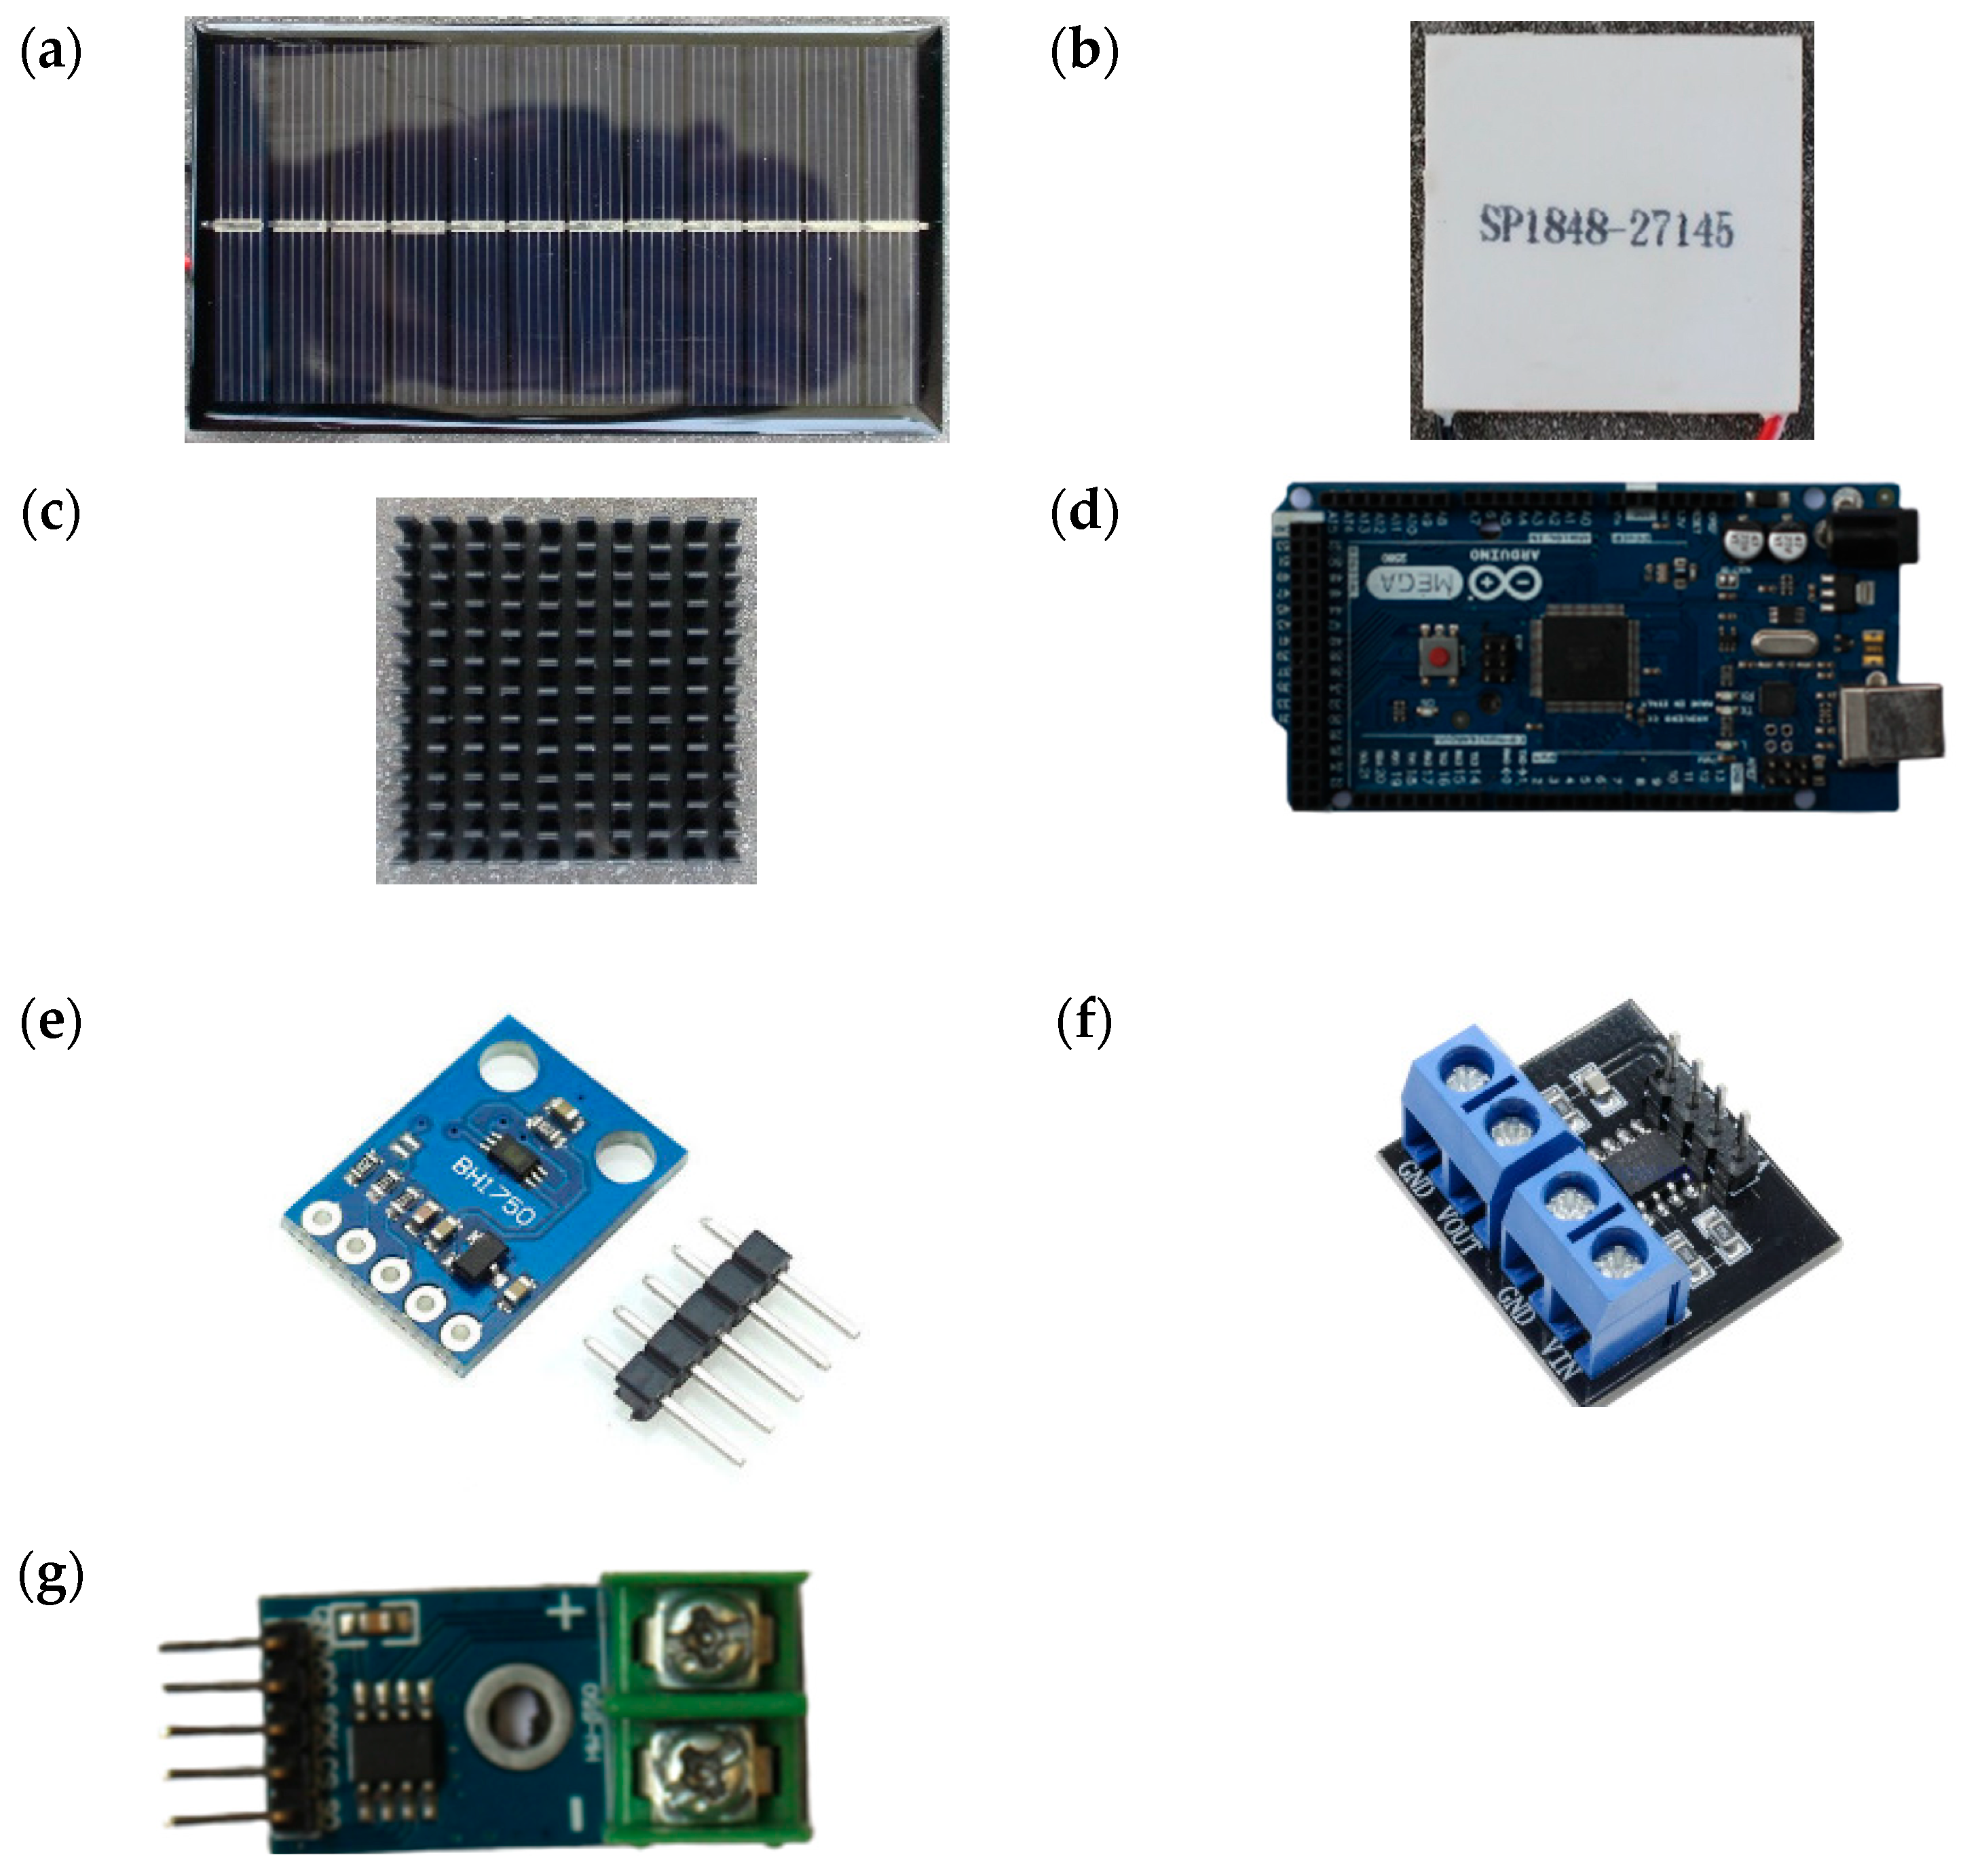
2.1. Experimental Tools
2.2. Experimental Procedures
3. Results and Discussion
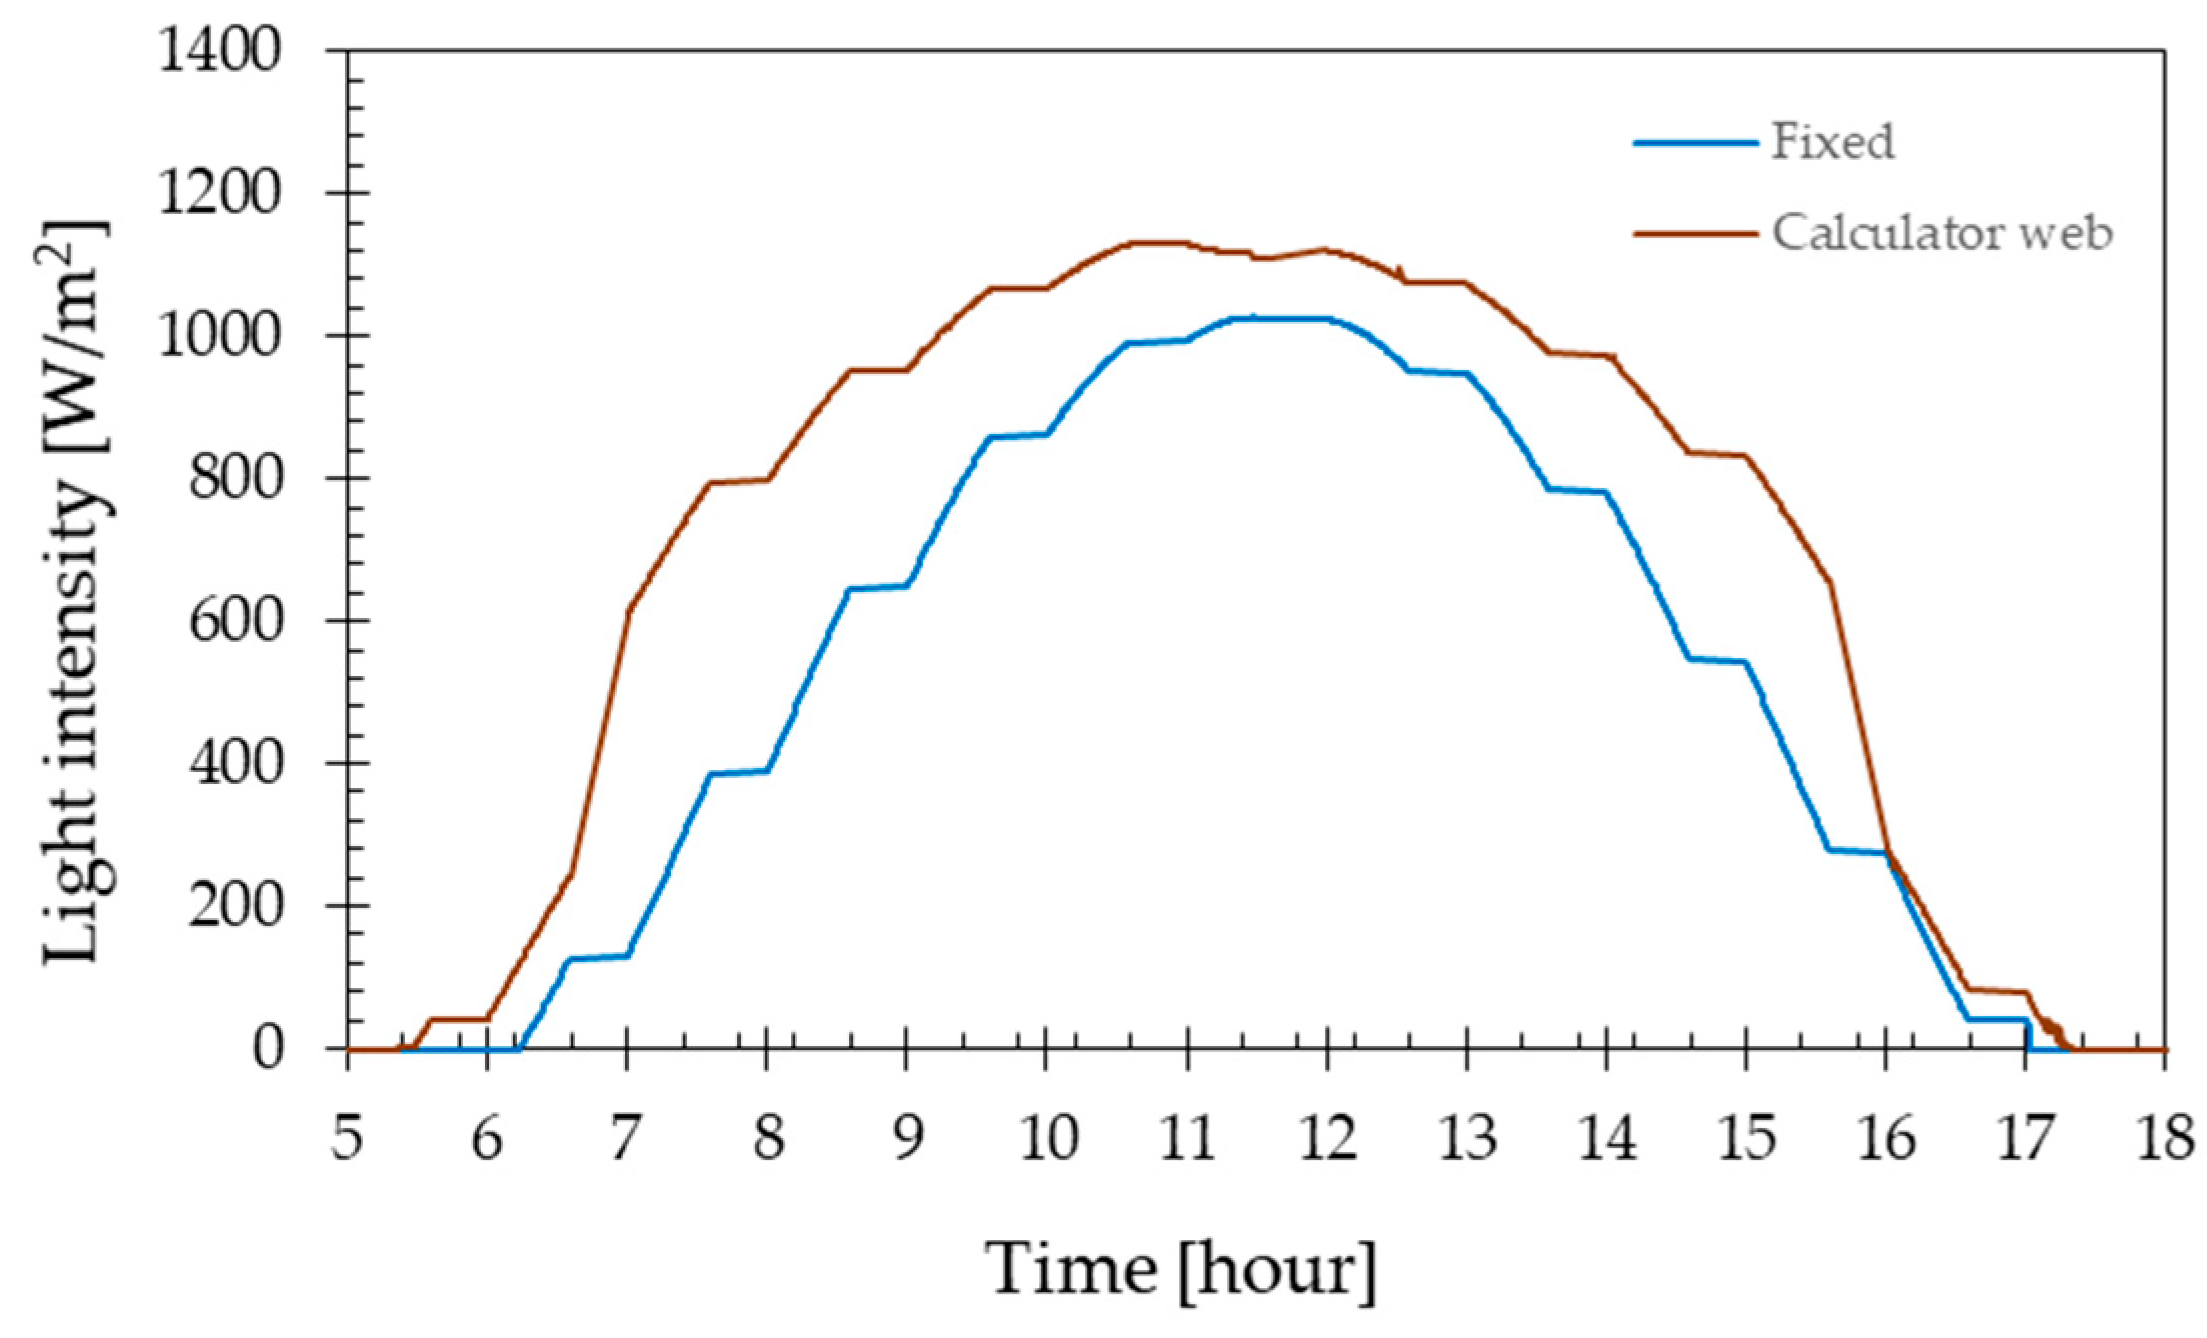
3.1. Light Intensity
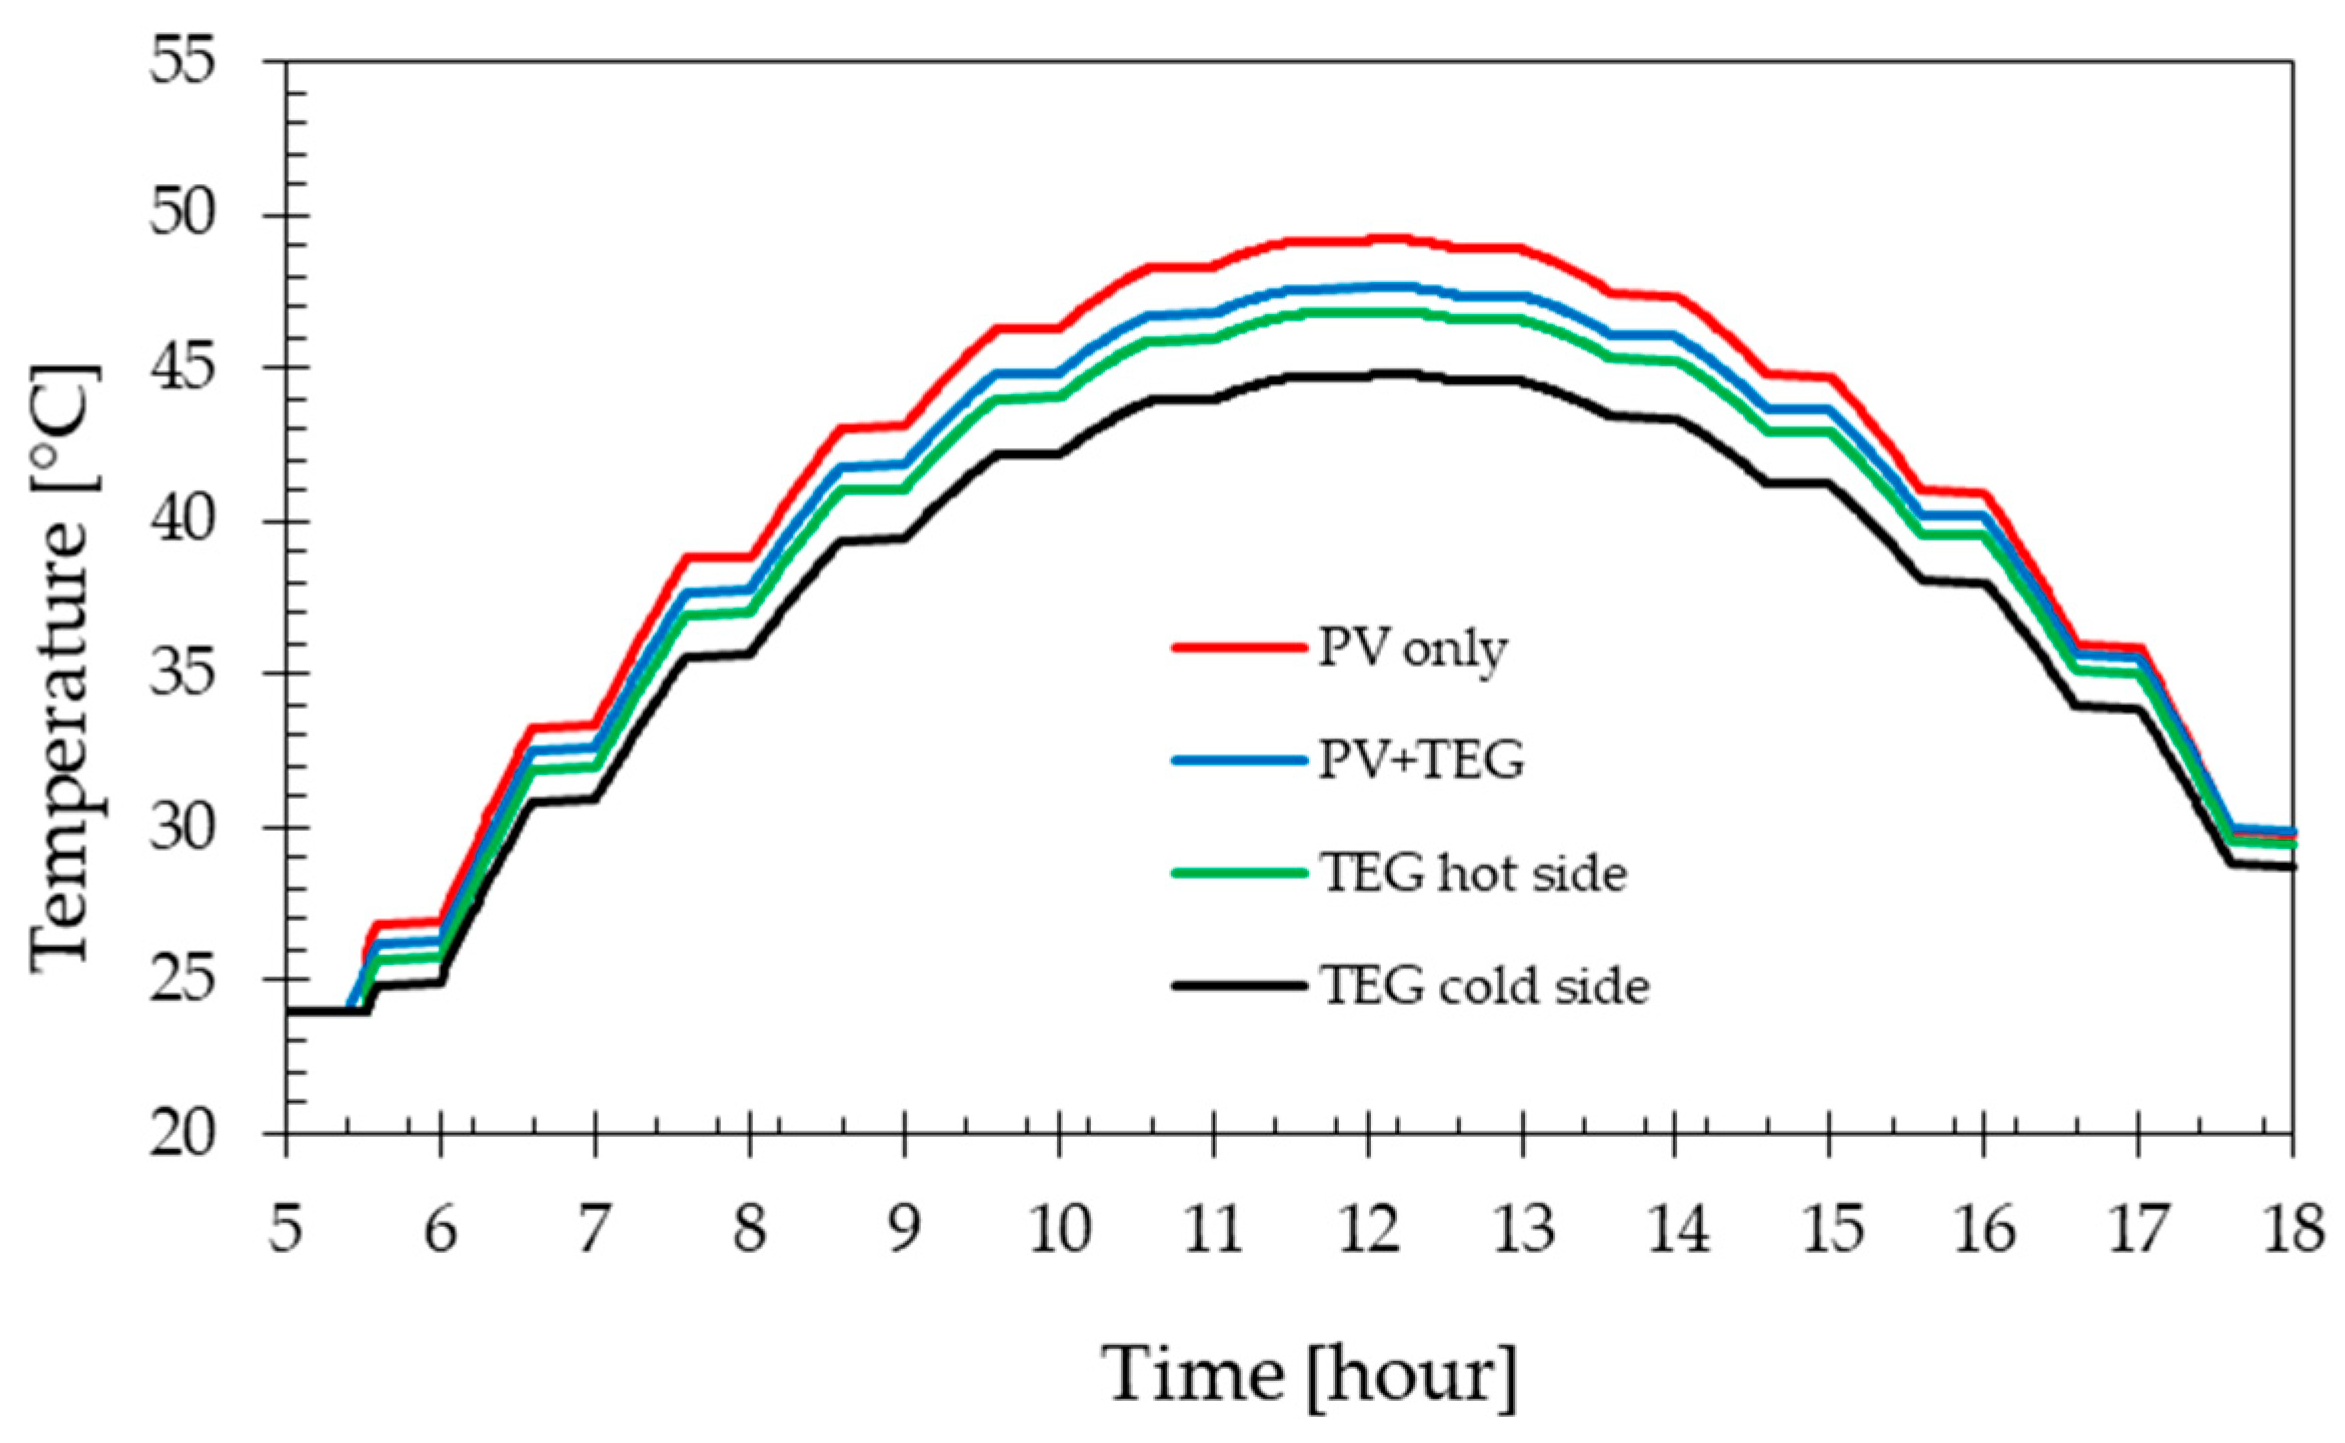
3.2. Temperature
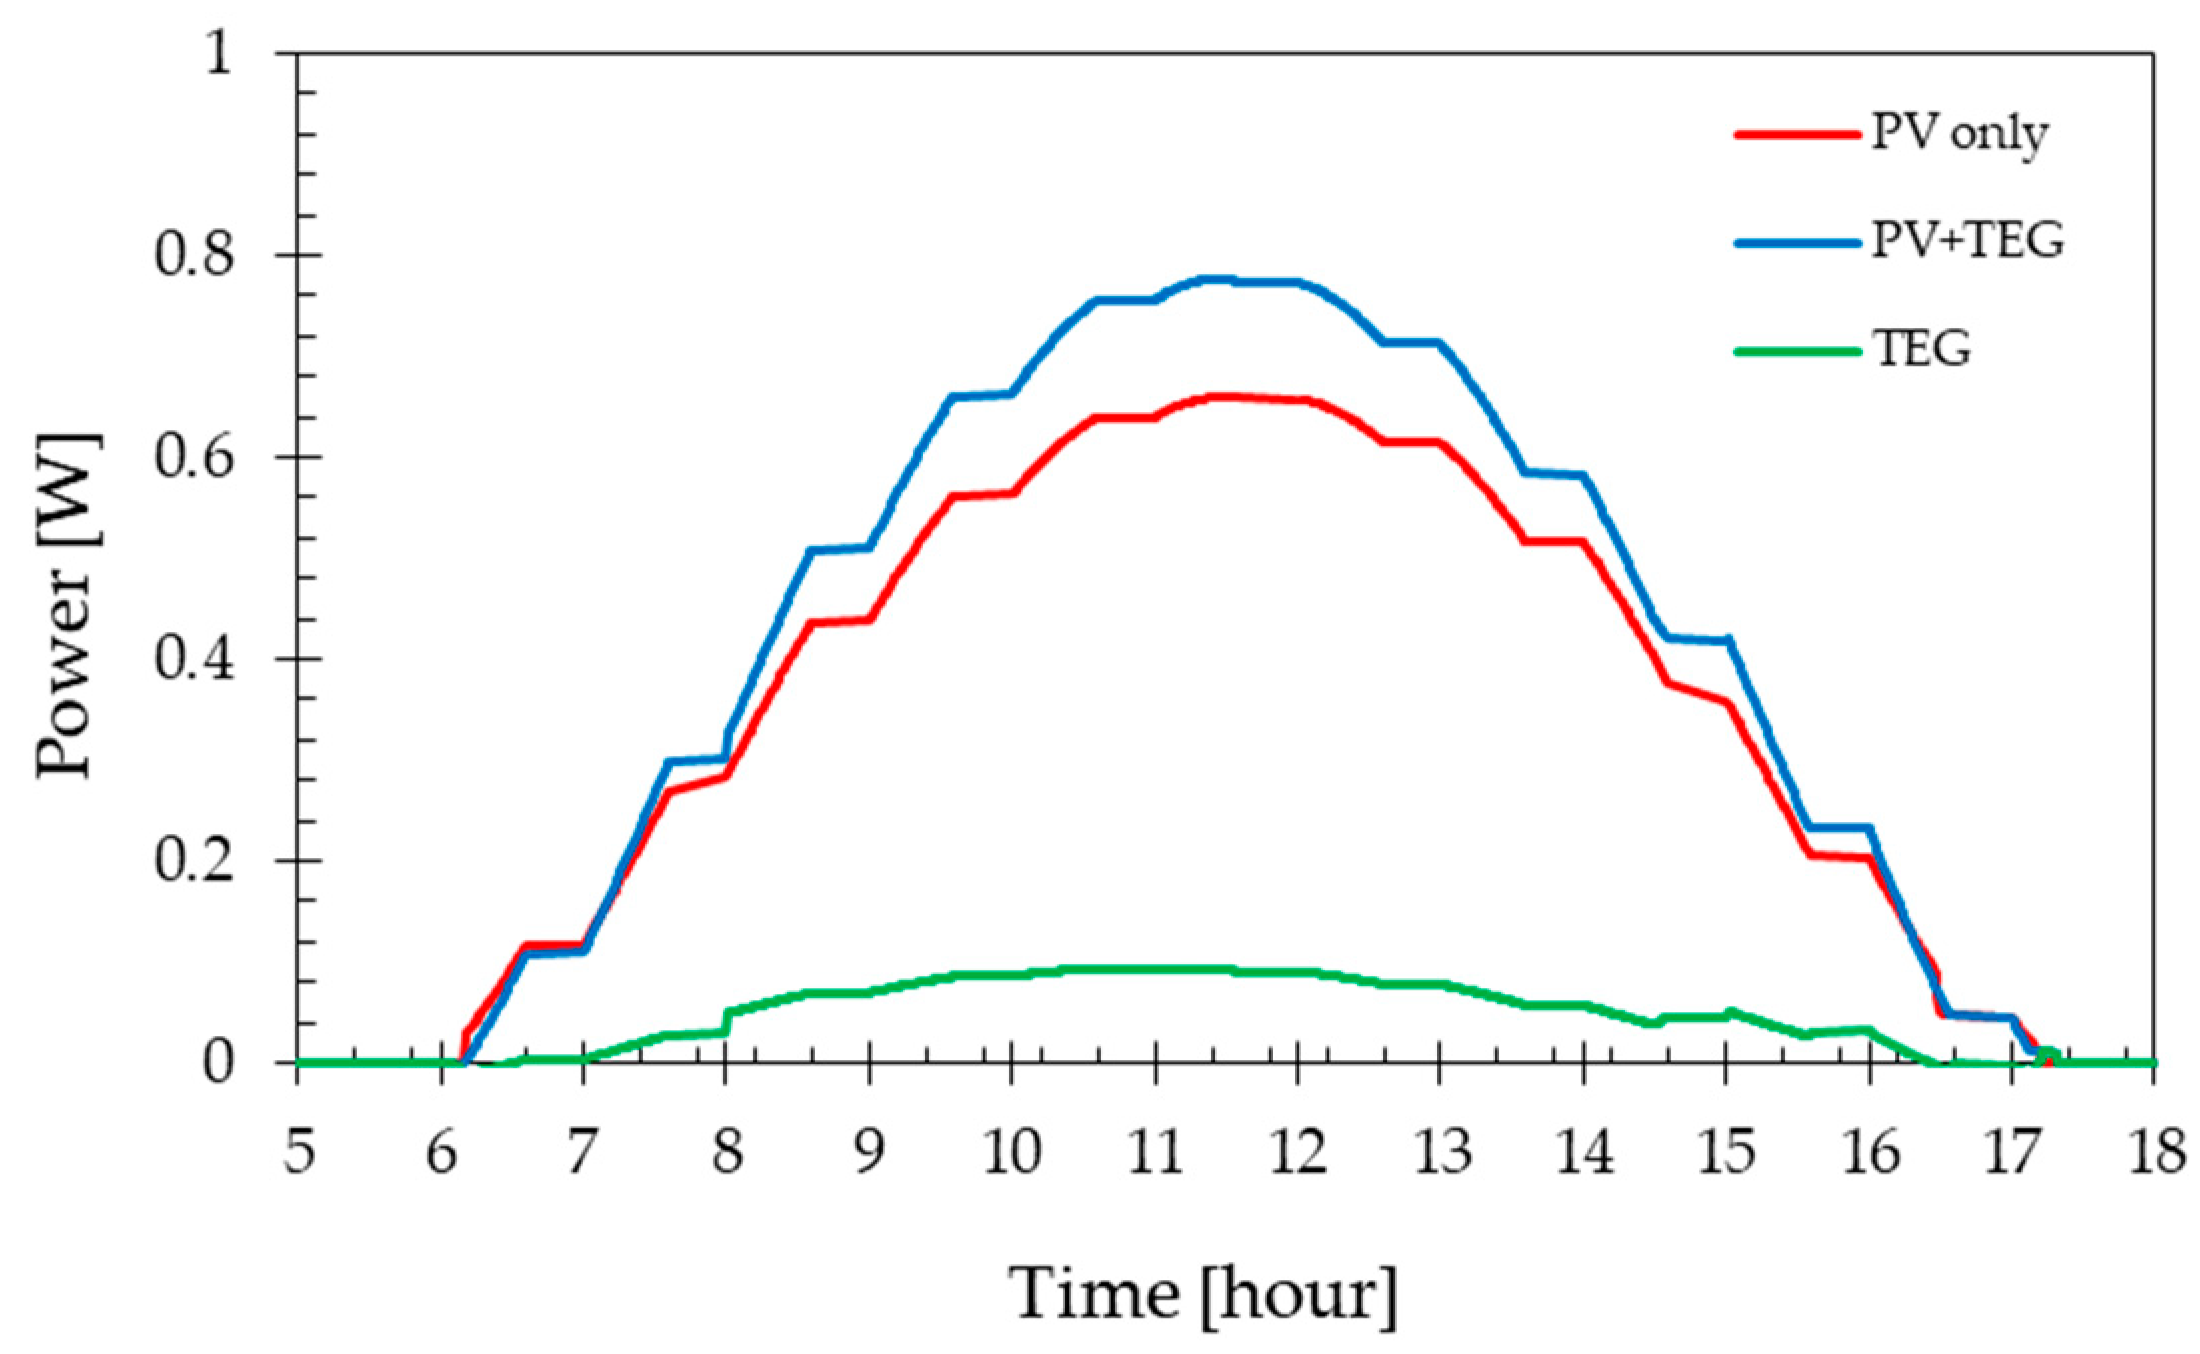
3.3. Power Output
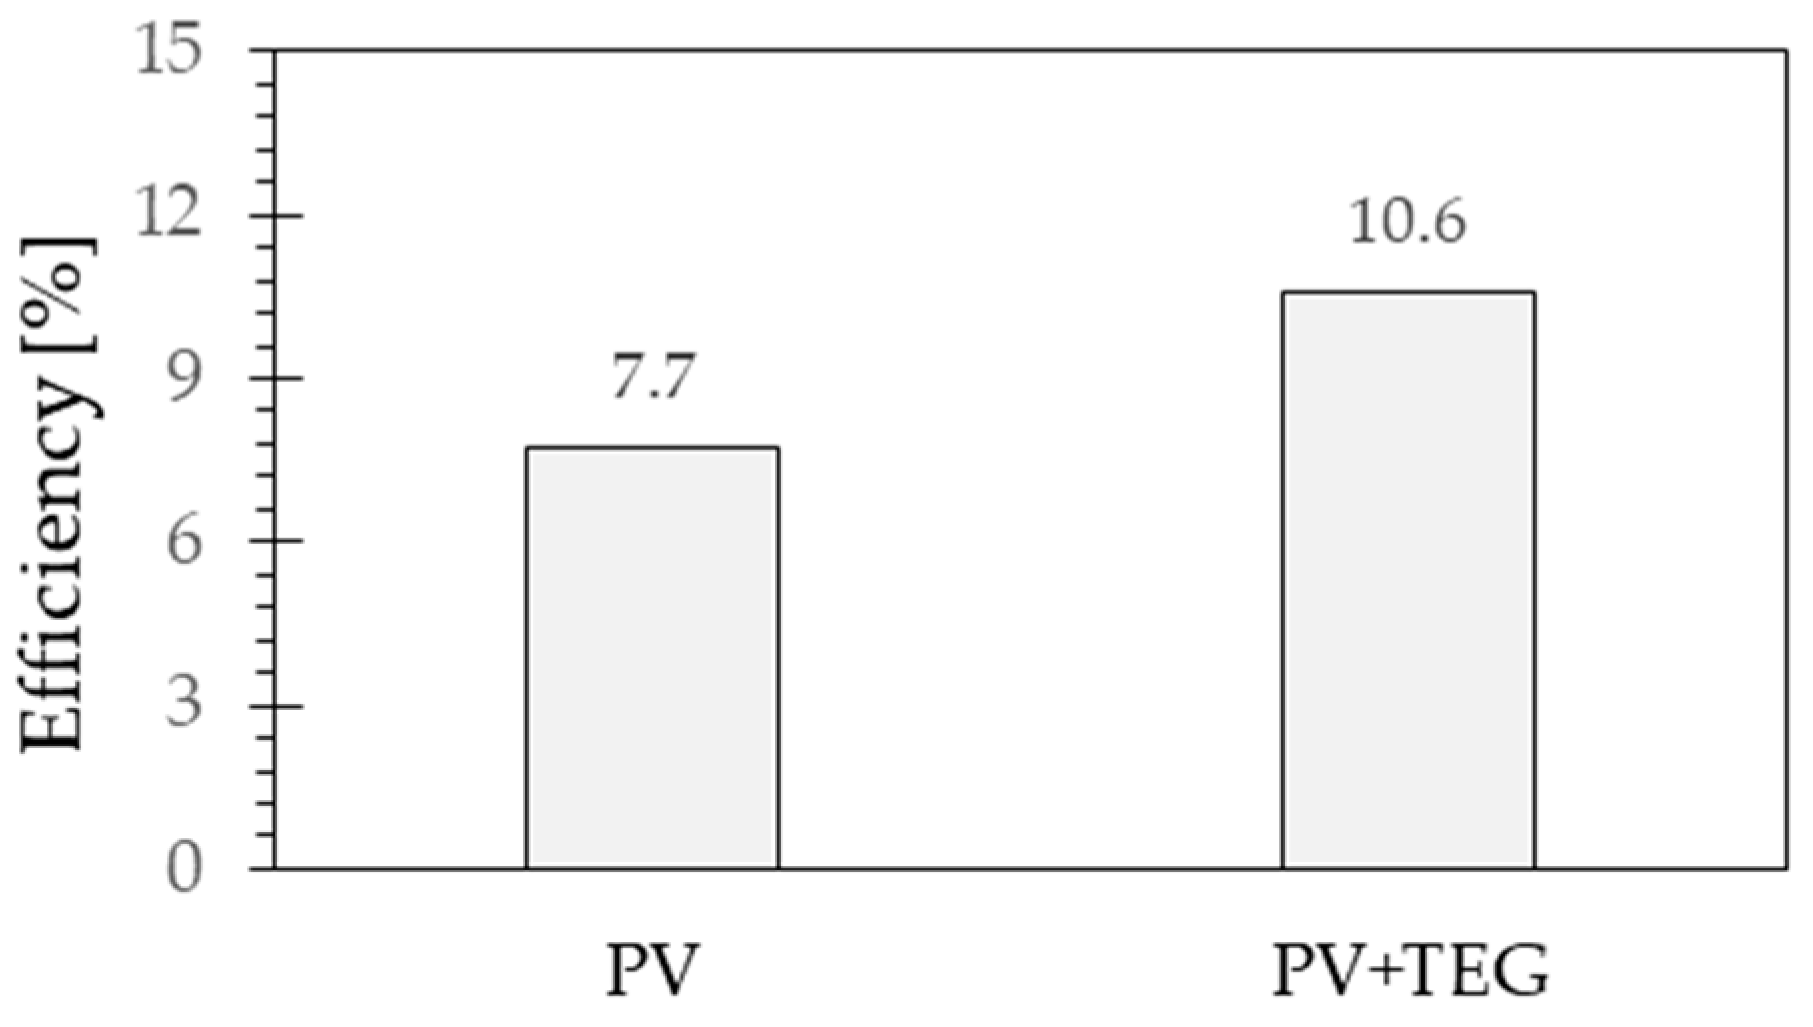
3.4. Efficiency
4. Conclusions
Author Contributions
Funding
Institutional Review Board Statement
Informed Consent Statement
Data Availability Statement
Conflicts of Interest
References
- Muzayanah, I.F.U.; Lean, H.H.; Hartono, D.; Indraswari, K.D.; Partama, R. Population density and energy consumption: A study in Indonesian provinces. Heliyon 2022, 8, e10634. [Google Scholar] [CrossRef]
- Overland, I.; Juraev, J.; Vakulchuk, R. Are renewable energy resources more evenly distributed than fossil fuels? Renew. Energy 2022, 200, 379–386. [Google Scholar] [CrossRef]
- Efendi, R.; Indriyani, Y.A. Mini-Review: Green Roof As a Greenery Solution in Urbanized Settlements and Energy Saving in Buildings. Media Mesin Maj. Tek. Mesin 2022, 23, 91–98. [Google Scholar] [CrossRef]
- Zile, M. Optimisation of power quality in solar/wind power stations using developed artificial bee/ant hybrid heuristic algorithm. Appl. Res. Smart Technol. 2021, 2, 69–79. [Google Scholar] [CrossRef]
- Abdelrazik, M.K.; Abdelaziz, S.E.; Hassan, M.F.; Hatem, T.M. Climate action: Prospects of solar energy in Africa. Energy Rep. 2022, 8, 11363–11377. [Google Scholar] [CrossRef]
- Sourav Khanna KSReddy, T.K.M. Optimization of finned solar photovoltaic phase change material finned pv pcm) system. Int. J. Therm. Sci. 2018, 130, 313–322. [Google Scholar] [CrossRef]
- Maka, A.O.M.; Salem, S.; Mehmood, M. Solar photovoltaic (PV) applications in Libya: Challenges, potential, opportunities and future perspectives. Clean. Eng. Technol. 2021, 5, 100267. [Google Scholar] [CrossRef]
- Sahari, N.; Ngadiron, Z.; Azman, Z.; Mustapha, N.B.; Ismail, N. Development of Hybrid Photovoltaic and Thermoelectric Generator for Energy Harvesting. Int. J. Eng. Trends Technol. 2022, 70, 284–291. [Google Scholar] [CrossRef]
- Nathan, G.J.; Jafarian, M.; Dally, B.B.; Saw, W.L.; Ashman, P.J.; Hu, E.; Steinfeld, A. Solar thermal hybrids for combustion power plant: A growing opportunity. Prog. Energy Combust. Sci. 2018, 64, 4–28. [Google Scholar] [CrossRef]
- Atmoko, N.T.; Veza, I.; Riyadi, T.W.B. Study On The Energy Conversion In The Thermoelectric Liquefied Petroleum Gas Cooking Stove With Different Cooling Methods. Int. J. Eng. Trends Technol. 2021, 69, 185–193. [Google Scholar] [CrossRef]
- Atmoko, N.T.; Jamaldi, A.; Riyadi, T.W.B. An Experimental Study of the TEG Performance using Cooling Systems of Waterblock and Heatsink-Fan. Automot. Exp. 2022, 5, 361–367. [Google Scholar] [CrossRef]
- Riyadi, T.W.B.; Utomo, B.R.; Effendy, M.; Wijayanta, A.T.; Al-Kayiem, H.H. Effect of thermal cycling with various heating rates on the performance of thermoelectric modules. Int. J. Therm. Sci. 2022, 178, 107601. [Google Scholar] [CrossRef]
- Utomo, B.R.; Sulistyanto, A.; Riyadi, T.W.B.; Wijayanta, A.T. Enhanced Performance of Combined Photovoltaic–Thermoelectric Generator and Heat Sink Panels with a Dual-Axis Tracking System. Energies 2023, 16, 2658. [Google Scholar] [CrossRef]
- Widodo, T.; Riyadi, B.; Effendy, M.; Radiant, B.; Tri, A. Performance of a photovoltaic-thermoelectric generator panel in combination with various solar tracking systems. Appl. Therm. Eng. 2023, 235, 121336. [Google Scholar] [CrossRef]
- Babu, C.; Ponnambalam, P. The theoretical performance evaluation of hybrid PV-TEG system. Energy Convers. Manag. 2018, 173, 450–460. [Google Scholar] [CrossRef]
- Kamran Khan, M.; Hamza Zafar, M.; Mansoor, M.; Feroz Mirza, A.; Amir Khan, U.; Mujeeb Khan, N. Green energy extraction for sustainable development: A novel MPPT technique for hybrid PV-TEG system. Sustain. Energy Technol. Assess. 2022, 53, 102388. [Google Scholar] [CrossRef]
- Gao, Y.; Dai, Z.; Wu, D.; Wang, C.; Chen, B.; Zhang, X. Transient performance assessment of a hybrid PV-TEG system integrated with PCM under non-uniform radiation conditions: A numerical investigation. Renew. Energy 2022, 198, 352–366. [Google Scholar] [CrossRef]
- Nouman, A.S.; Chokhachian, A.; Santucci, D.; Auer, T. Prototyping of environmental kit for georeferenced transient outdoor comfort assessment. ISPRS Int. J. Geo-Inf. 2019, 8, 76. [Google Scholar] [CrossRef]
- First Rays LLC. Solar Instensity Calculator 2022. Available online: https://firstrays.com/natural-sunlight-intensity/ (accessed on 10 August 2022).
- Bazyari, S.; Keypour, R.; Farhangi, S.; Ghaedi, A.; Bazyari, K. A Study on the Effects of Solar Tracking Systems on the Performance of Photovoltaic Power Plants. J. Power Energy Eng. 2014, 02, 718–728. [Google Scholar] [CrossRef]
- Dida, M.; Boughali, S.; Bechki, D.; Bouguettaia, H. Experimental investigation of a passive cooling system for photovoltaic modules efficiency improvement in hot and arid regions. Energy Convers. Manag. 2021, 243, 114328. [Google Scholar] [CrossRef]
- Ahsan, M.; Khan, I.; Khan, M.I.; Kazim, A.H.; Shabir, A. An Experimental and Comparative Performance Evaluation of a Hybrid Photovoltaic-Thermoelectric System. Front. Energy Res. 2021, 9, 722514. [Google Scholar] [CrossRef]
- Fathabadi, H. Novel high efficient offline sensorless dual-axis solar tracker for using in photovoltaic systems and solar concentrators. Renew. Energy 2016, 95, 485–494. [Google Scholar] [CrossRef]
- Sutanto, B.; Indartono, Y.S.; Wijayanta, A.T.; Iacovides, H. Enhancing the performance of floating photovoltaic system by using thermosiphon cooling method: Numerical and experimental analyses. Int. J. Therm. Sci. 2022, 180, 107727. [Google Scholar] [CrossRef]

| Parameters | Specification |
|---|---|
| Type of PV | HY1-49 |
| Material of PV | Monocrystalline |
| Max. voltage | 5 Volt |
| Max. current | 200 mA |
| Parameters | Specification |
|---|---|
| Type | SP1848 27145 SA |
| Semiconductor material | Bi2Te3 |
| Number of semiconductor | 220 |
| Working temperature | 0–150 °C |
Disclaimer/Publisher’s Note: The statements, opinions and data contained in all publications are solely those of the individual author(s) and contributor(s) and not of MDPI and/or the editor(s). MDPI and/or the editor(s) disclaim responsibility for any injury to people or property resulting from any ideas, methods, instructions or products referred to in the content. |
© 2024 by the authors. Licensee MDPI, Basel, Switzerland. This article is an open access article distributed under the terms and conditions of the Creative Commons Attribution (CC BY) license (https://creativecommons.org/licenses/by/4.0/).
Share and Cite
Riyadi, T.W.B.; Soumi, A.I.; Haryanto; Hendrawan, A. Performance Assessment of a Photovoltaic Cell Coupled with a Thermoelectric Generator. Eng. Proc. 2024, 63, 23. https://doi.org/10.3390/engproc2024063023
Riyadi TWB, Soumi AI, Haryanto, Hendrawan A. Performance Assessment of a Photovoltaic Cell Coupled with a Thermoelectric Generator. Engineering Proceedings. 2024; 63(1):23. https://doi.org/10.3390/engproc2024063023
Chicago/Turabian StyleRiyadi, Tri Widodo Besar, Andi Ibrahim Soumi, Haryanto, and Andi Hendrawan. 2024. "Performance Assessment of a Photovoltaic Cell Coupled with a Thermoelectric Generator" Engineering Proceedings 63, no. 1: 23. https://doi.org/10.3390/engproc2024063023
APA StyleRiyadi, T. W. B., Soumi, A. I., Haryanto, & Hendrawan, A. (2024). Performance Assessment of a Photovoltaic Cell Coupled with a Thermoelectric Generator. Engineering Proceedings, 63(1), 23. https://doi.org/10.3390/engproc2024063023