
Optimization of Waterblock Cooling Water Flow Rate in a Thermoelectric Generator Charcoal Furnace †

 ,
,
Abstract
1. Introduction
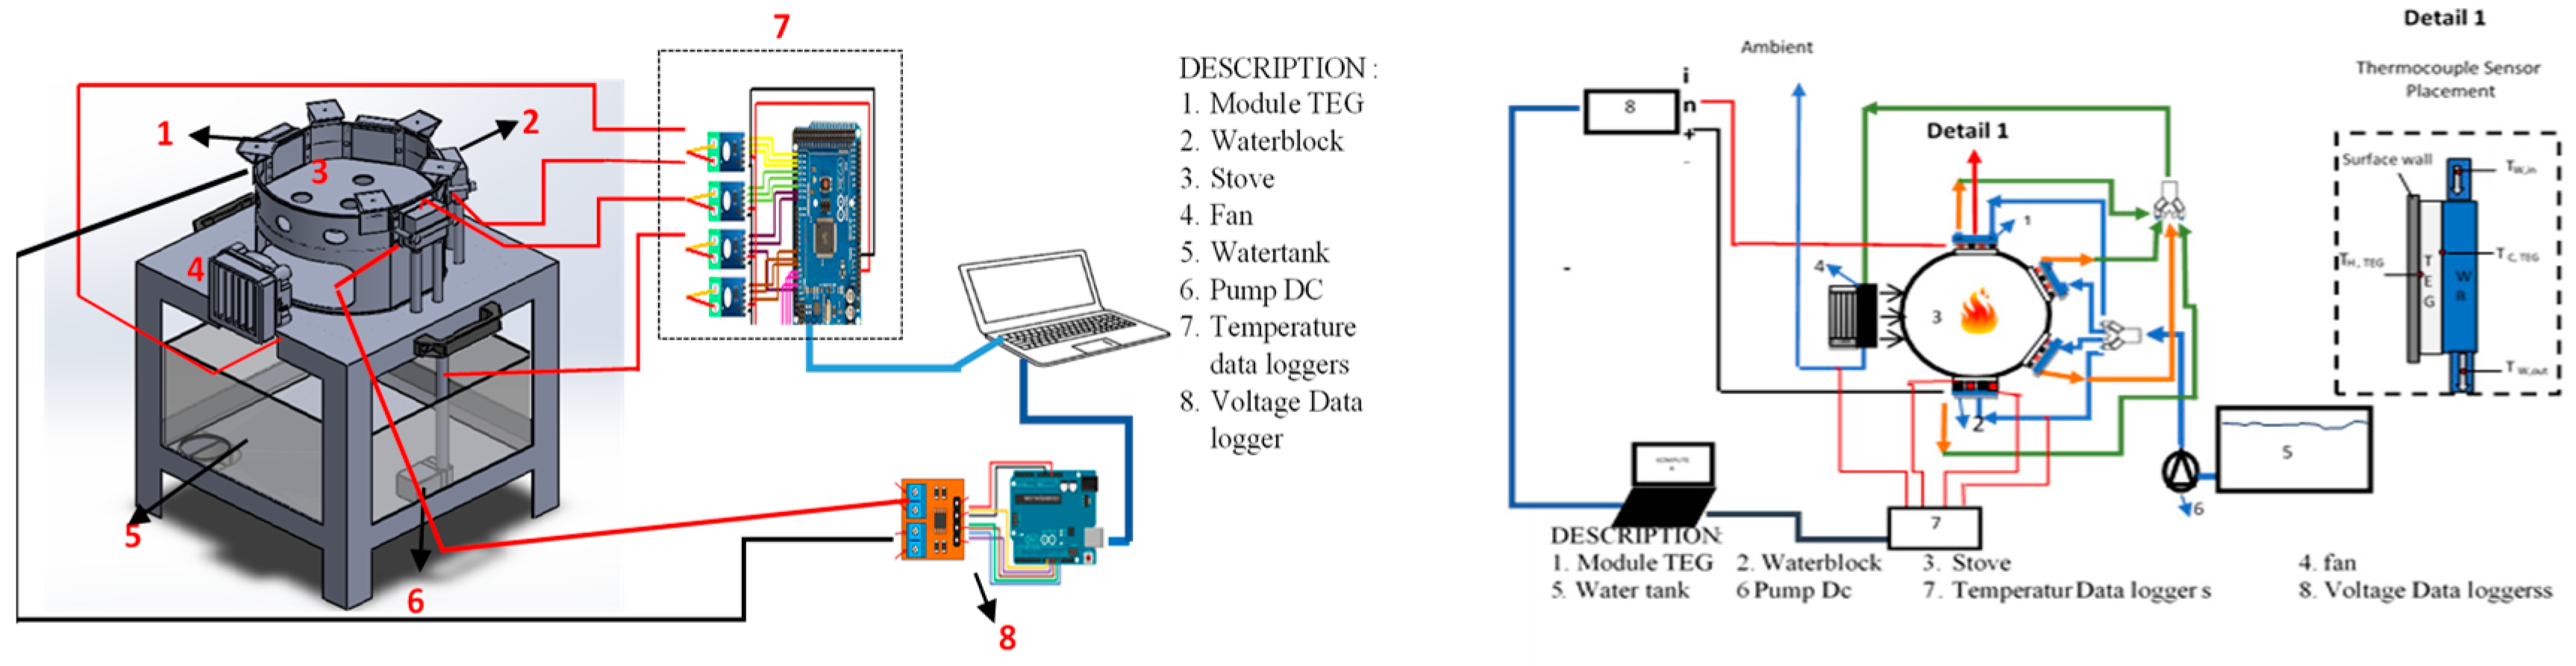
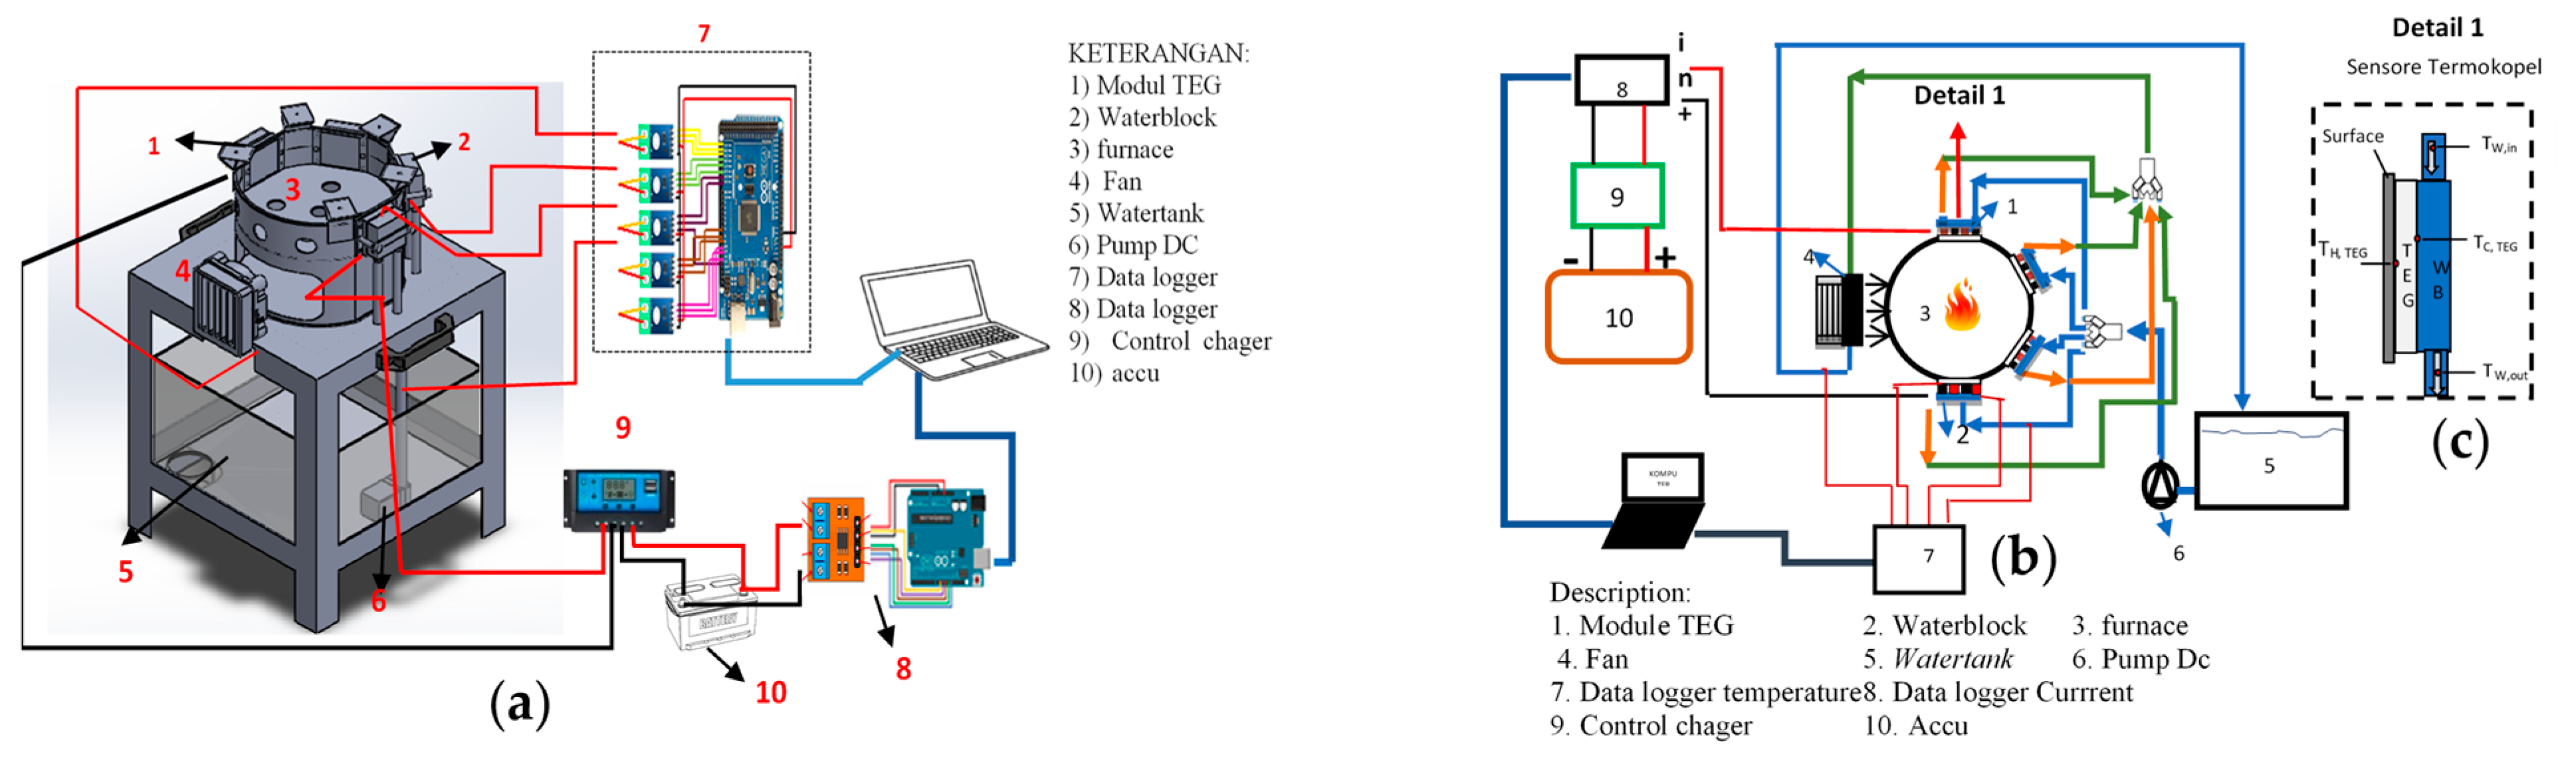
2. Method
2.1. Data Retieval Process
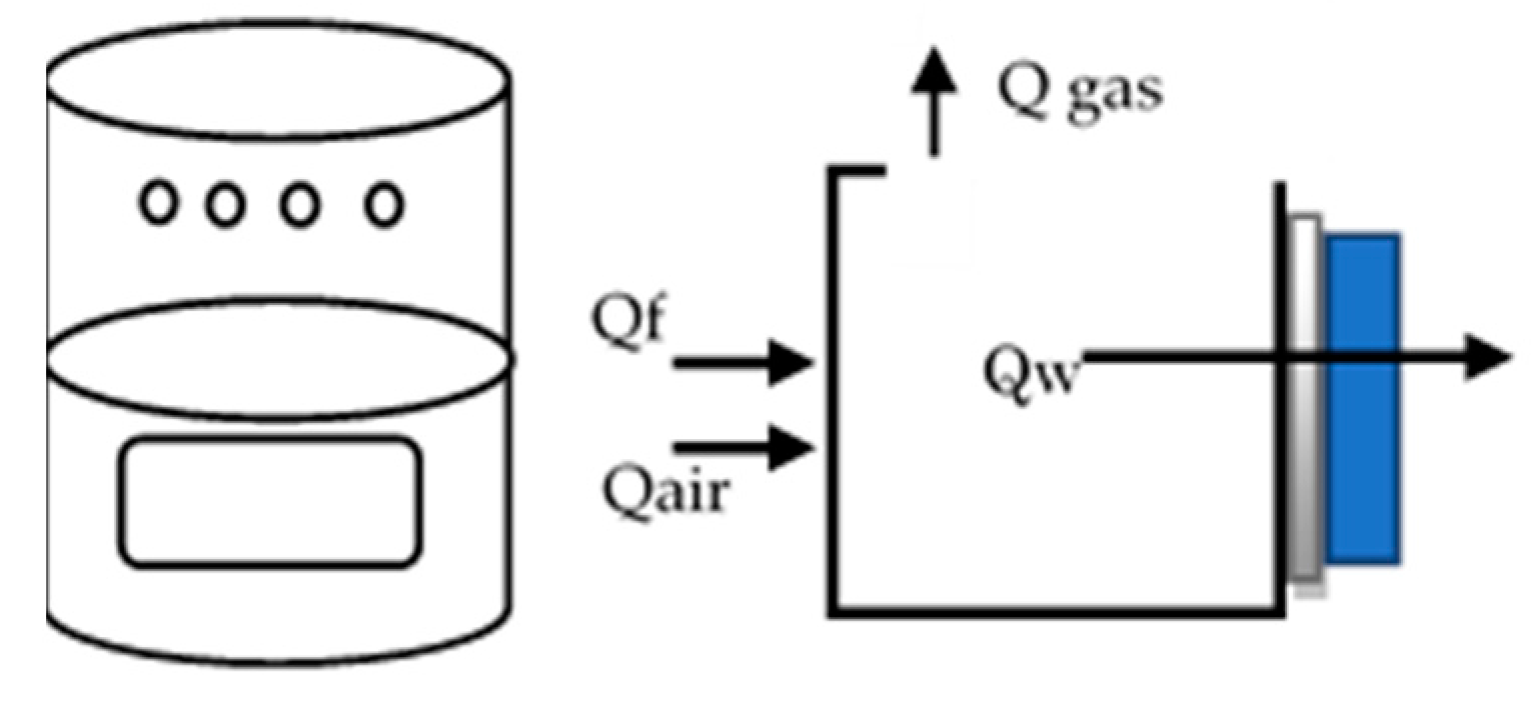
2.2. Energy Balance in the Furnace
- -
- Incoming heat energy (Qin): Qair and Qfuel;
- -
- Hot energy out (Qout): Qgass and Qwall.
2.3. The Energy Equation That Enters the Furnace Is in the Form of Fuel (Qfuel)
2.4. Equation of the Energy That Comes Out of the Furnace in the Form of Gas (Qgas)
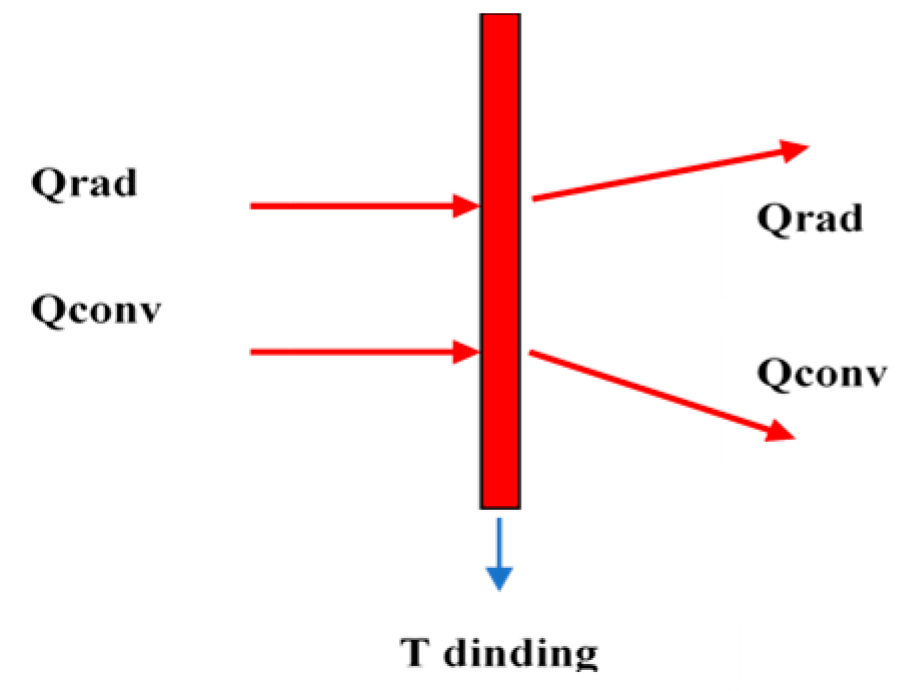
2.5. The Equation for the Transfer of Energy out through the Furnace Wall (Qwall)
3. Result and Discussion
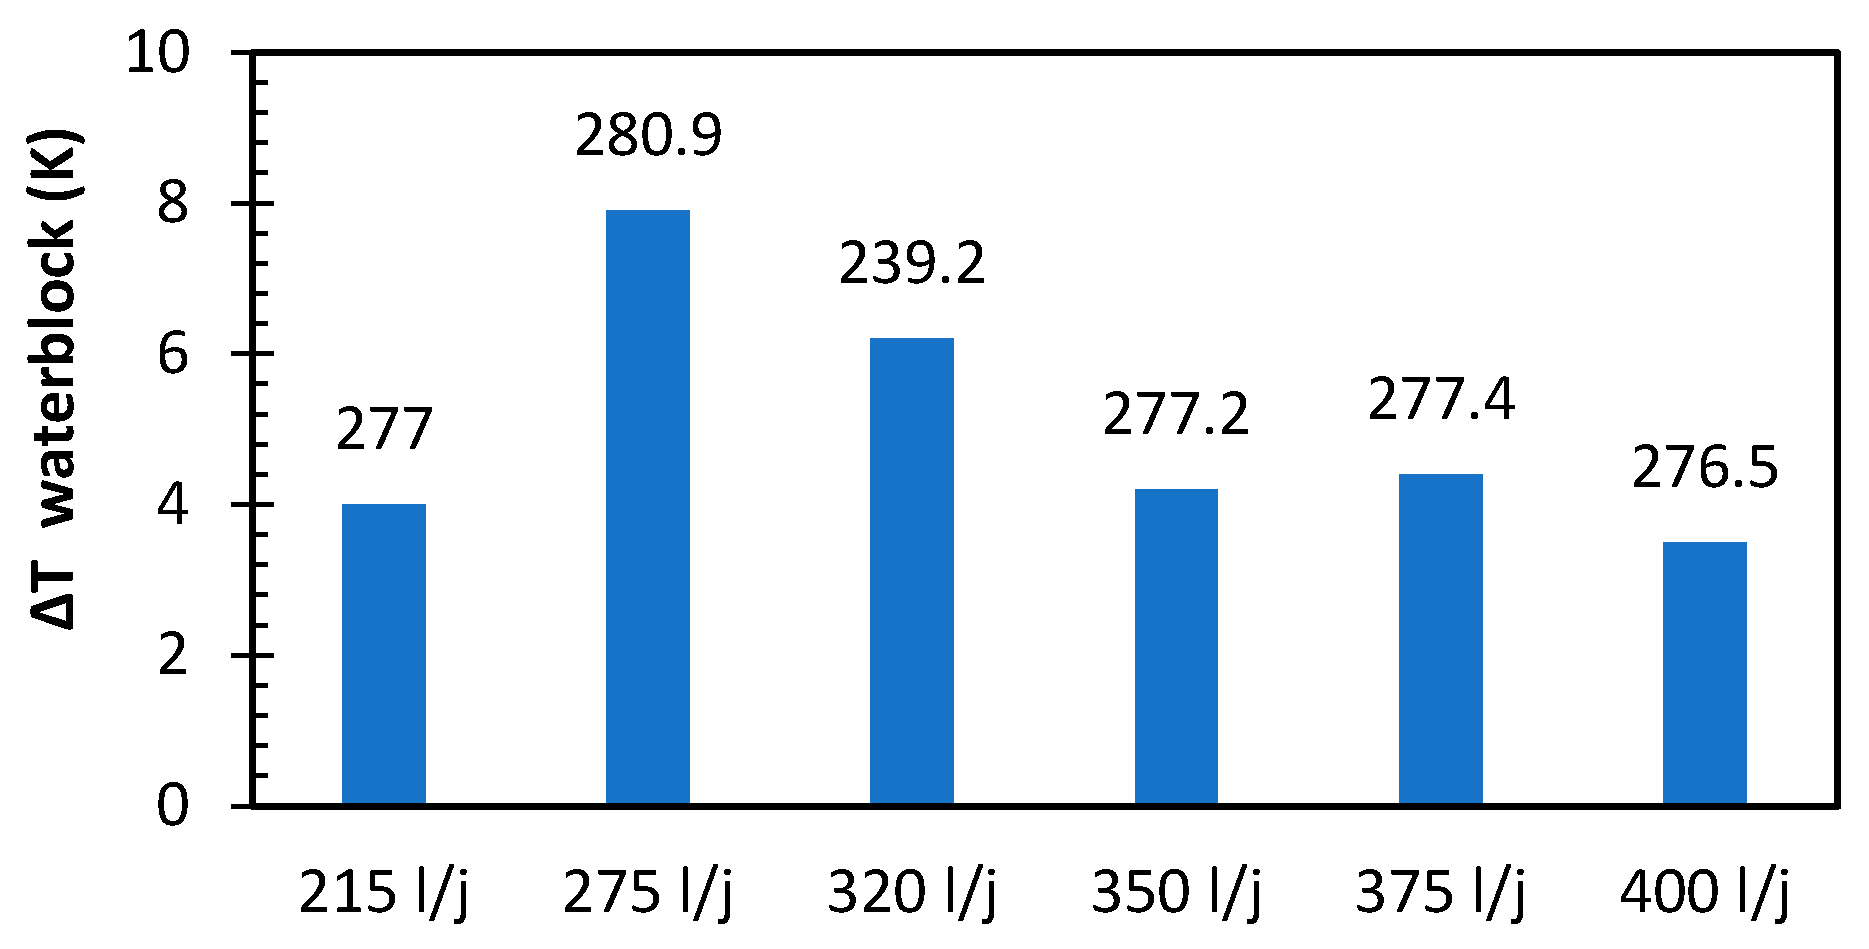
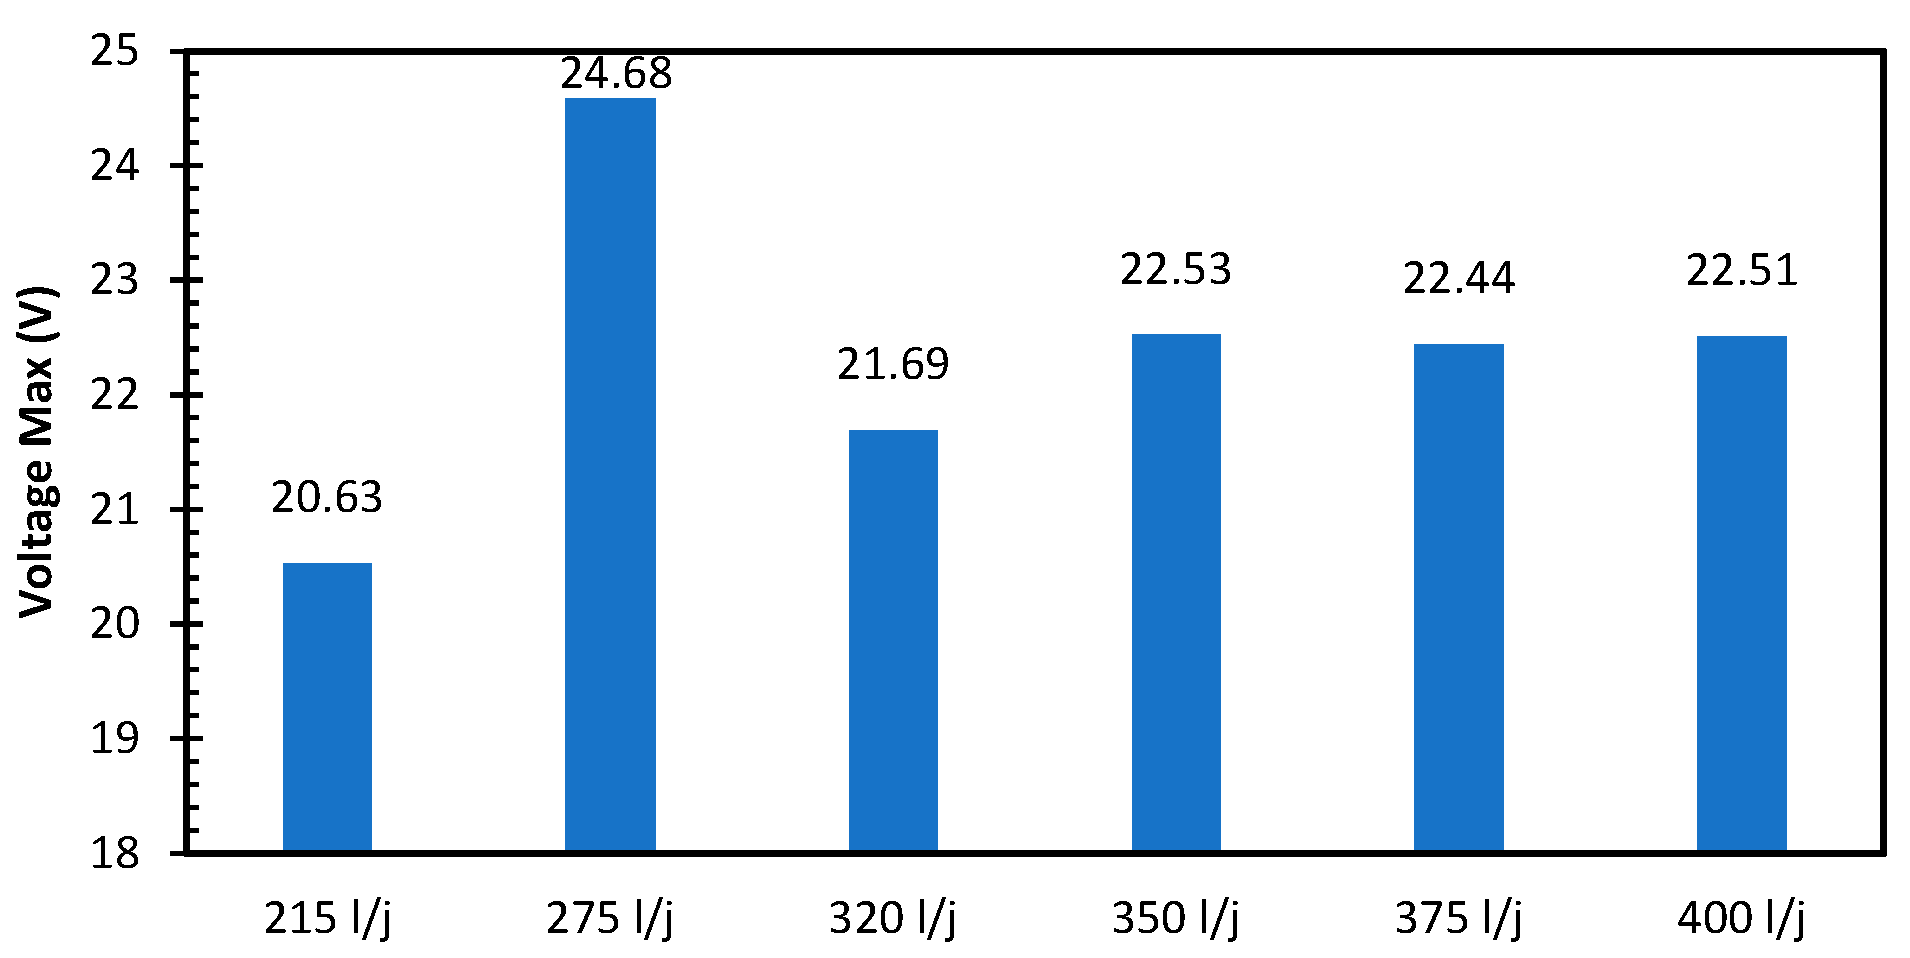
3.1. Optimization of Water Flow Rate on TEG Performance
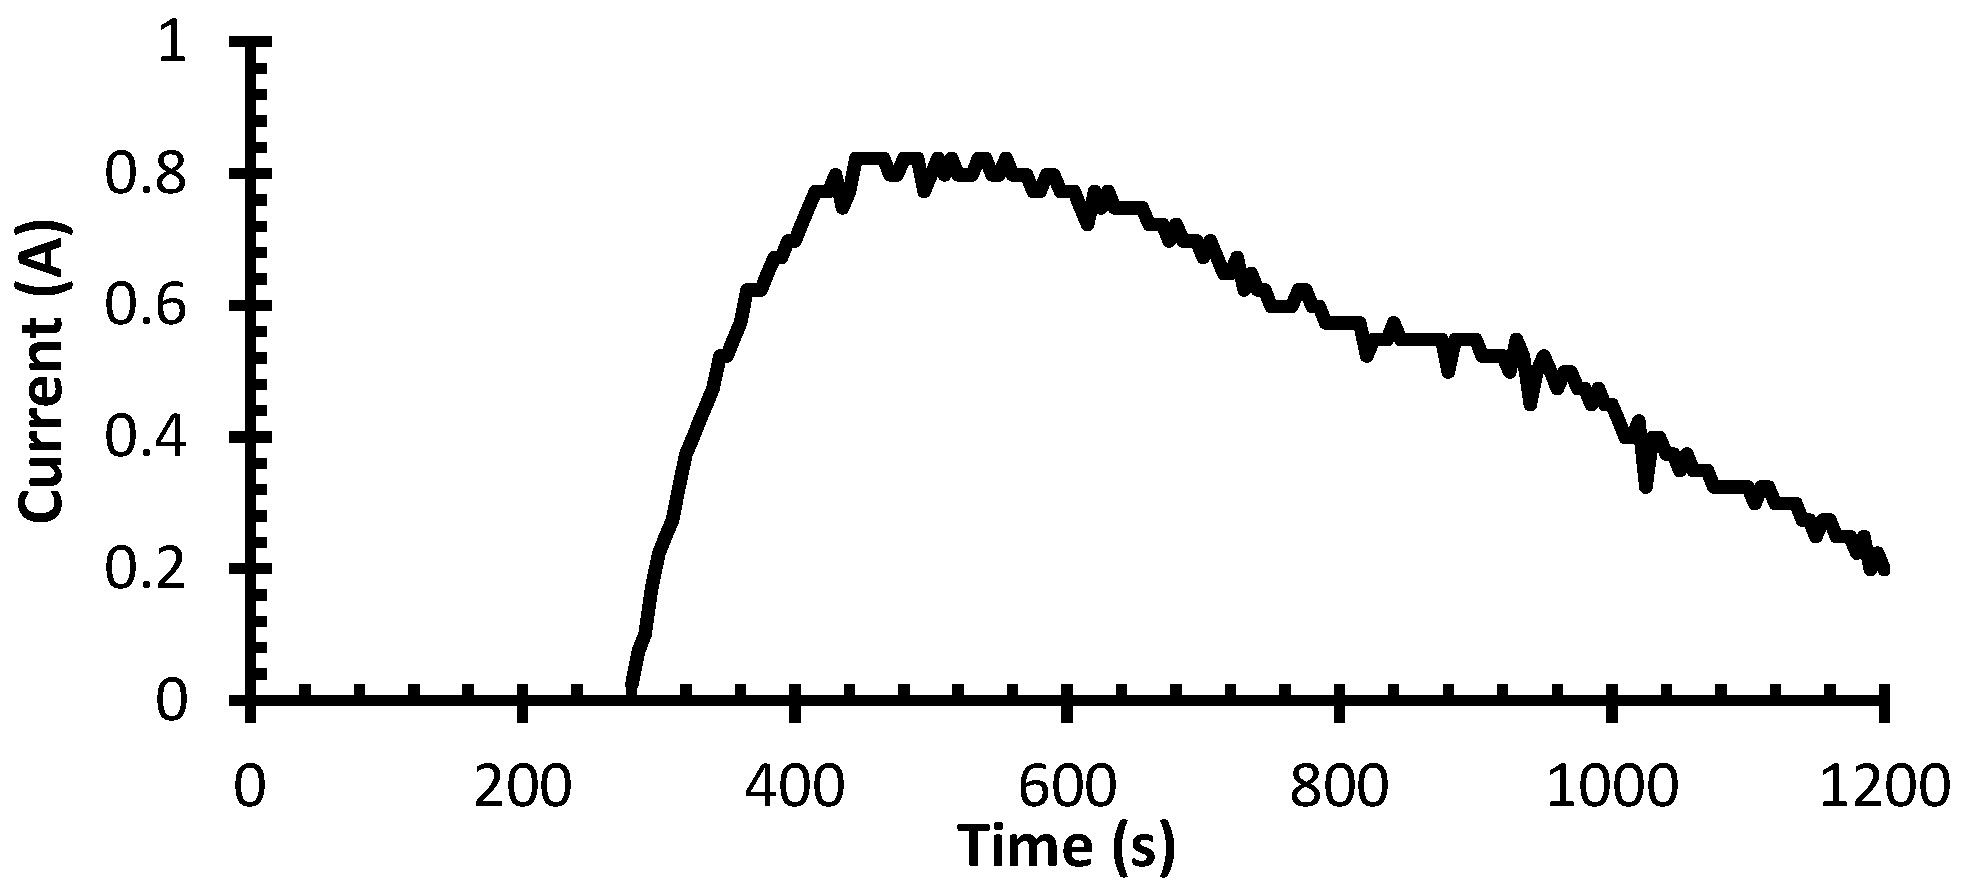
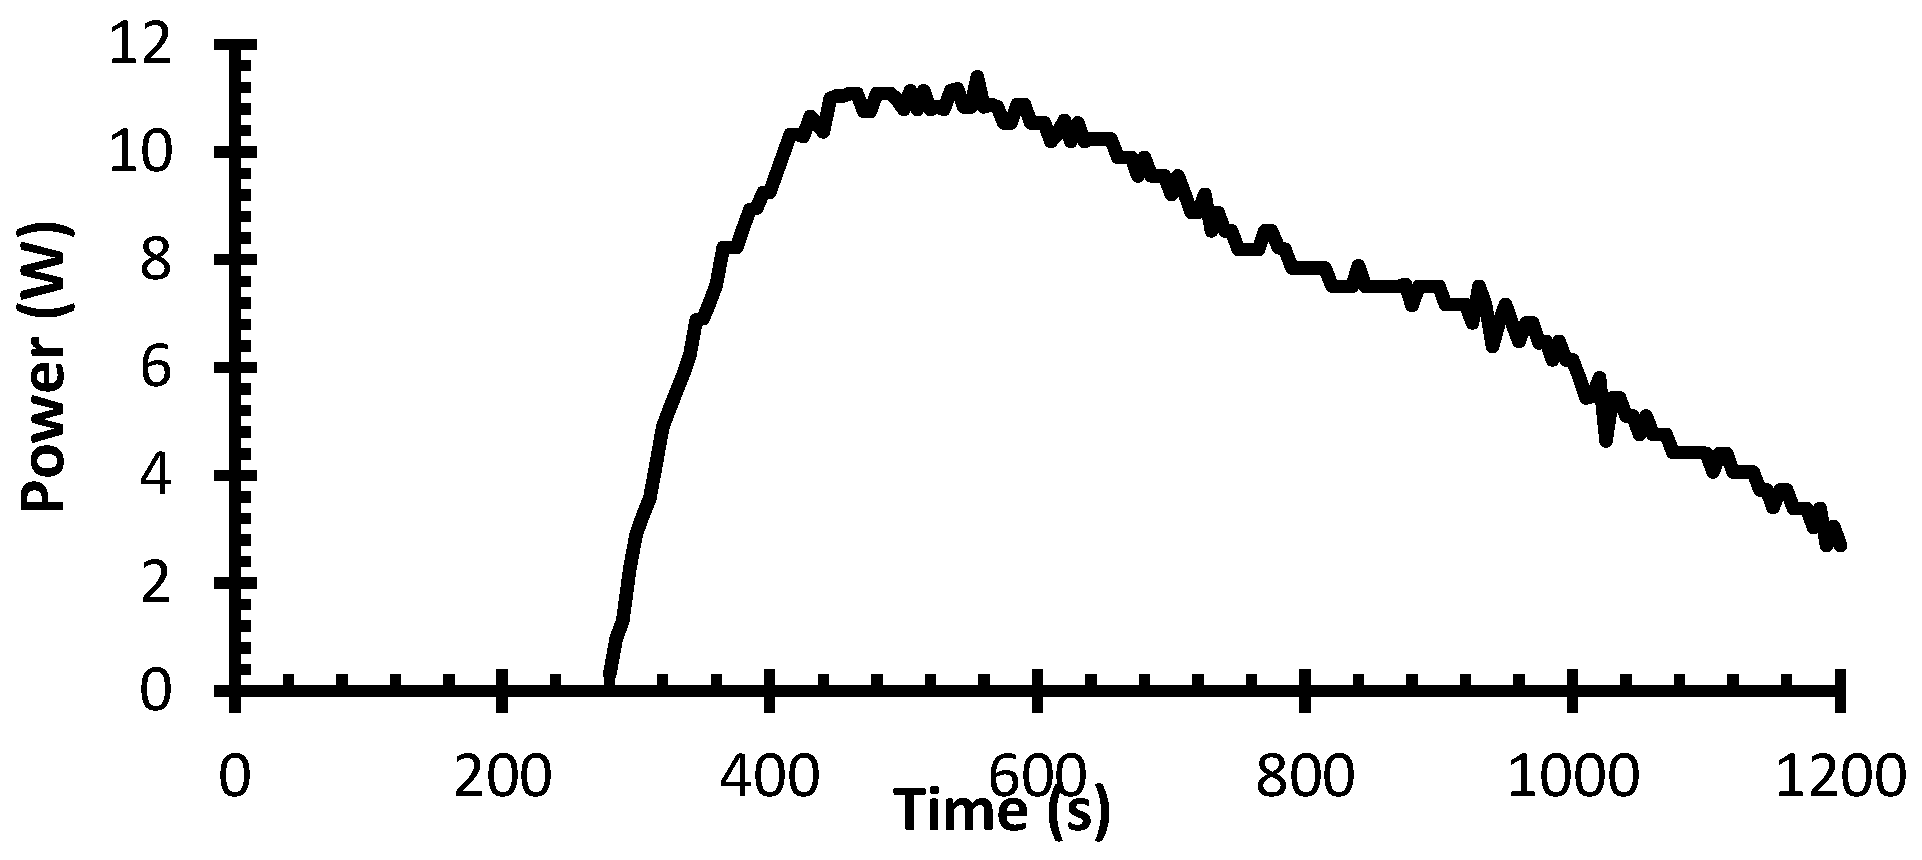
3.2. Effect of Water Flow Rate as Surface Cooling Media on TEG Performance with Battery Loading
3.2.1. Cooling Water from a Faucet That Flows Continuously
3.2.2. Cooling Water with a Volume of 9 L of Water
4. Conclusions
Author Contributions
Funding
Institutional Review Board Statement
Informed Consent Statement
Data Availability Statement
Acknowledgments
Conflicts of Interest
References
- Ioffe, A.F. Semiconductor Thermoelements and Thermoelectric Cooling; Pion Ltd.: London, UK, 1958. [Google Scholar]
- Atmoko, N.T.; Riyadi TW, B.; Wijayanto, H.L. The Experimental Investigation of Heating Rate Variant Method to Produce Power Output Generated by Thermoelectric Generator SP1848-SA. J. Phys. Conf. Ser. 2022, 2406, 012008. [Google Scholar] [CrossRef]
- Champier, D.; Bédécarrats, J.P.; Kousksou, T.; Rivaletto, M.; Strub, F.; Pignolet, P. Study of a TE (thermoelectric) generator incorporated in a multifunction wood stove. Energy 2011, 36, 1518–1526. [Google Scholar] [CrossRef]
- Disalvo, F.J. Thermoelectric cooling and power generation. Science 1999, 285, 703–706. [Google Scholar] [CrossRef] [PubMed]
- Fitriani; Ovik, R.; Long, B.D.; Barma, M.C.; Riaz, M.; Sabri, M.F.M.; Said, S.M.; Saidur, R. A review on nanostructures of high-temperature thermoelectric materials for waste heat recovery. Renew. Sustain. Energy Rev. 2016, 64, 635–659. [Google Scholar] [CrossRef]
- Jaziri, N.; Boughamoura, A.; Müller, J.; Mezghani, B.; Tounsi, F.; Ismail, M. A comprehensive review of Thermoelectric Generators: Technologies and common applications. Energy Rep. 2020, 6, 264–287. [Google Scholar] [CrossRef]
- Kishore, R.A.; Priya, S. A Review on low-grade thermal energy harvesting: Materials, methods and devices. Materials 2018, 11, 1433. [Google Scholar] [CrossRef] [PubMed]
- Kütt, L.; Millar, J.; Karttunen, A.; Lehtonen, M.; Karppinen, M. Thermoelectric applications for energy harvesting in domestic applications and micro-production units. Part I: Thermoelectric concepts, domestic boilers and biomass stoves. Renew. Sustain. Energy Rev. 2018, 98, 519–544. [Google Scholar] [CrossRef]
- Li, Y.; Wang, S.; Zhao, Y.; Yue, L. Effect of thermoelectric modules with different characteristics on the performance of thermoelectric generators inserted in the central flow region with porous foam copper. Appl. Energy 2022, 327, 120041. [Google Scholar] [CrossRef]
- Maksymuk, M.; Zazakowny, K.; Lis, A.; Kosonowski, A.; Parashchuk, T.; Wojciechowski, K.T. Development of the anodized aluminum substrates for thermoelectric energy converters. Ceram. Int. 2022, 49, 4816–4825. [Google Scholar] [CrossRef]
- Najjar, Y.S.H.; Kseibi, M.M. Heat transfer and performance analysis of thermoelectricgia stoves. Appl. Therm. Eng. 2016, 102, 1045–1058. [Google Scholar] [CrossRef]
- Purohit, K. Review Paper on Optimizations of Thermoelectric System. Int. J. Innov. Res. Eng. Manag. (IJIREM) 2016, 3, 259–263. [Google Scholar]
- Riyadi, T.W.B.; Utomo, B.R.; Effendy, M.; Wijayanta, A.T.; Al-Kayiem, H.H. Effect of thermal cycling with various heating rates on the performance of thermoelectric modules. Int. J. Therm. Sci. 2022, 178, 107601. [Google Scholar] [CrossRef]
- Sornek, K.; Filipowicz, M.; Żołądek, M.; Kot, R.; Mikrut, M. Comparative analysis of selected thermoelectric generators operating with wood-fired stove. Energy 2019, 166, 1303–1313. [Google Scholar] [CrossRef]
- Atmoko, N.T.; Riyadi TW, B.; Utomo, B.R.; Jamaldi, A.; Nugroho, A.S. Heat Transfer Analysis and Performance Investigation of Generator Thermoelectric Applied in LPG Stove Waste Heat Recovery. Int. J. Renew. Energy Res. 2023, 13, 70–76. [Google Scholar]
- Wijayanto, H.L.; Amiruddin, A.; Kadriadi, K.; Wirakusuma, K.W.; Atmoko, N.T. Pengaruh Variasi Daya Pompa pada System Pendinginan TEG terhadap Tegangan yang Dihasilkan TEG. J. Ilm. Univ. Batanghari Jambi 2022, 22, 477. [Google Scholar] [CrossRef]
- Zheng, X.F.; Liu, C.X.; Yan, Y.Y.; Wang, Q. A review of thermoelectrics research—Recent developments and potentials for sustainable and renewable energy applications. Renew. Sustain. Energy Rev. 2014, 32, 486–503. [Google Scholar] [CrossRef]


| Flow Rate (l/j) | T Hot (°C) | T Cold (°C) | T In (°C) | T Out (°C) | ∆T (°C) | Voltage (V) | ∆T.wb (°C) |
|---|---|---|---|---|---|---|---|
| 215 | 145.75 | 58.5 | 31 | 35.75 | 86.75 | 20.39 | 4.75 |
| 275 | 145.75 | 52 | 31 | 39.25 | 93.75 | 24.6 | 8.75 |
| 320 | 145.75 | 61.25 | 31 | 37.5 | 84.05 | 21.13 | 6.75 |
| 350 | 145.75 | 59.75 | 31 | 36 | 86 | 22.53 | 5 |
| 375 | 145.75 | 62 | 31 | 35 | 86 | 21.35 | 4 |
| 400 | 145.75 | 59.25 | 31 | 33.5 | 86.5 | 22.09 | 2.25 |
Disclaimer/Publisher’s Note: The statements, opinions and data contained in all publications are solely those of the individual author(s) and contributor(s) and not of MDPI and/or the editor(s). MDPI and/or the editor(s) disclaim responsibility for any injury to people or property resulting from any ideas, methods, instructions or products referred to in the content. |
© 2024 by the authors. Licensee MDPI, Basel, Switzerland. This article is an open access article distributed under the terms and conditions of the Creative Commons Attribution (CC BY) license (https://creativecommons.org/licenses/by/4.0/).
Share and Cite
Wijayanto, H.L.; Setiawan, A.T.; Amiruddin; Yusdianto; Atmoko, N.T. Optimization of Waterblock Cooling Water Flow Rate in a Thermoelectric Generator Charcoal Furnace. Eng. Proc. 2024, 63, 21. https://doi.org/10.3390/engproc2024063021
Wijayanto HL, Setiawan AT, Amiruddin, Yusdianto, Atmoko NT. Optimization of Waterblock Cooling Water Flow Rate in a Thermoelectric Generator Charcoal Furnace. Engineering Proceedings. 2024; 63(1):21. https://doi.org/10.3390/engproc2024063021
Chicago/Turabian StyleWijayanto, Hendi Lilih, Angga Tegar Setiawan, Amiruddin, Yusdianto, and Nugroho Tri Atmoko. 2024. "Optimization of Waterblock Cooling Water Flow Rate in a Thermoelectric Generator Charcoal Furnace" Engineering Proceedings 63, no. 1: 21. https://doi.org/10.3390/engproc2024063021
APA StyleWijayanto, H. L., Setiawan, A. T., Amiruddin, Yusdianto, & Atmoko, N. T. (2024). Optimization of Waterblock Cooling Water Flow Rate in a Thermoelectric Generator Charcoal Furnace. Engineering Proceedings, 63(1), 21. https://doi.org/10.3390/engproc2024063021