1. Introduction
Global warming is accelerating, and the world is looking for solutions, but the complicated world situation and problems with energy and fuels lead to delays in the green transition. The climate changes swiftly, and the consequences are expected to be many and costly. One of the solutions for energy problems is photovoltaic (PV) systems, but they still have many drawbacks and deficiencies. The main one is that the PV panels still possess comparatively low solar energy conversion efficiencies.
The effect of their deficiencies is lower, and they become competitive if they are installed locally by the end consumers and generate energy directly for them without any intermediaries. The decentralized production of energy from renewable sources is a way to avoid the cost of networking and the loss from the transmission and distribution of energy [
1]. The problem is that most of the human population lives in crowded urban areas with limited free space. This requires the PV systems to be installed directly on buildings and creates different hazards, the main one being the fire hazard. In this regard, a study evaluated the mid-life degradation of PV plants, and 52.5% of the 360 PV modules showed certain defects. The power degradation rate of the PV modules over a period of 10 years ranges between 0.16%/year and 1.72%/year. The conclusion is that in a PV plant, the degraded PV modules with burn marks on their surface, heavy snail tracks, visual cracks, and hotspots with a severe locally generated high temperature must be replaced immediately because of mismatch losses of strings and risk of fire [
2]. This risk increases considering the fact that people are usually looking for more affordable solutions, which means that they tend to buy cheaper PV system components, but another study has concluded that different technologies have different levels of deterioration over time, and the performance factor is not necessarily directly proportional to the initial cost [
3]. From another point of view, the low-quality PV panels might pose a fire hazard during their lifetime. In this regard, the comparison and analysis of performance and degradation differences in two photovoltaic modules from different producers after 15 years of field operation leads to the conclusion that they have very different operational and physical characteristics. In this case, the different levels of degradation are due to the different encapsulation technology [
4].
Another important factor which limits photovoltaic performance and is a common problem in urban environments is soiling. The obtained [
5] results indicate that it could lead to a reduction in the generated power by more than 30% in certain situations. Furthermore, it leads to faster PV degradation.
The design and environmental parameters are known to have a significant role in the thermal regime of energy-related processes [
6]. Weather conditions affect the PV system performance over time, and various defects can occur in the PV modules even in the short term. The meteorological parameters that are of interest for engineering activities related to renewable energy sources are wind, solar radiation, air temperature, air humidity, atmospheric pressure, and precipitation [
7]. In this regard, the application of suitable inspection methods is critical to detect faults and problems in the PV modules in particular.
Early failure detection plays a significant role in maintaining the performance of PV modules over time [
8] because the power output of PV modules deployed under outdoor conditions does not remain the same and experiences continuous degradation due to aging [
9]. For that reason, reliable techniques for their periodic on-site inspections are needed. Such techniques could be used for an initial analysis of the quality of the PV panels, which is needed for timely design corrections and warranty enforcement, as well as for tracking the soiling and degradation of the PV panels during their long-term operation. Such periodic monitoring is necessary in order to solve any future problems in a timely manner before they become dangerous and to ensure that the system operates with optimal performance. Furthermore, previous studies have shown that providing remote monitoring helps ensure asset protection, lowers operation costs, and ensures improved quality [
10,
11].
Other studies have shown that thermographic analysis could be a very reliable tool for the identification of different PV installation faults and problems. In [
12], 20-year-old PV modules were analyzed with the use of electroluminescence (EL) and infrared (IR) thermography. The results show that most of the defects detected in IR images were also visible in the EL images. In [
13], different technologies are also used to analyze 12-year-old PV modules. The IR inspection showed no hotspots and defects, yet the EL imaging showed several microcracks, which were not otherwise visible. The IR camera was also used to diagnose the bypass diodes. In [
14], IR thermography is used to diagnose a total of 17,142 PV modules, and 859 cell hotspots are detected with a temperature difference from the PV surface of 60–80 °C. Furthermore, IR imaging is used to diagnose overheating connections and bypass diodes. The authors of [
15] prove that hotspots are more visible with IR imaging when the modules are tested under short-circuit mode compared to open-circuit mode. All of the above studies indicate that different spectrum cameras could be an important tool for the early identification of potential and actual problems in photovoltaic installations.
This study aims to present the design and development of an experimental facility for investigating the operation of photovoltaic installations with the use of visual thermography. It should allow implementing a wide range of research experiments in the field of soiling, shading, degradation, and modeling of photovoltaic installations. The continuous thermographic analysis is important when assessing the impact of different urban scenarios as well as for the early identification of different degradation defects. The abovementioned could create the necessary means for an efficient and reliable integration of photovoltaic technologies in the urban areas.
2. Comparison of Popular Non-Invasive Methods for Inspection of PV Panels
The quality assurance measures are of fundamental importance for PV power systems. The failure-free operation of the PV modules is a prerequisite for efficient energy production, long life, and high return on the investment [
16].
Some of the surface problems of PV panels could be visually observed, but there are many structural defects that cannot be identified with the naked eye. Monitoring of the IV curves is important for the overall diagnosis, but it is not enough for the identification of emerging problems and their causes. In this regard, the optimization of grid-connected PV systems requires a strategy for automatic fault detection [
17].
Two popular methods for the non-invasive inspection of PV panels are known to be effective in different cases. They are based on the infrared and electroluminescence imaging techniques. The key difference between them is that the IR imaging inspection is completed under natural sunlight, while the EL imaging requires dark conditions and additional equipment besides the camera.
The IR inspections should be completed under high irradiation intensity, stable temperature, and low or no wind speed. The useful information is extracted from the temperature differences between different parts of a certain module or of separate modules, as problem areas create hotspots. The temperature differences are proportional to the level of irradiance; therefore, values over 600 W/m
2 are required. In most cases, inactive or damaged areas of a PV module have higher temperature than the surrounding active areas because their resistance is higher. Furthermore, such differences might be due to shading, soiling, thermal reflections, and other interfering factors. The time required for the PV panels to enter steady-state thermal regime ranges between 5 and 15 min [
16,
18].
The EL imaging technique utilizes the electroluminescence phenomenon, which represents the ability of the materials to emit light in response to electric current flow. Therefore, in order to minimize the interference the EL images are taken under low light or dark conditions, although this technique is more weather resistant. In this case, DC voltage is applied to the PV module and its photoemissions are captured with an infrared-sensitive camera; i.e., additional power supply is required. The EL imaging technique works with camera detectors of the charge-coupled devices (CCD) type or of the complementary metal oxide semiconductor (CMOS) type. For better results, a special sensor should be selected, whose peak sensitivity corresponds to the emission spectrum of the tested material, and such cameras are usually very expensive. The EL camera must be positioned perpendicularly to the PV panels and proper camera-focusing techniques must be applied. With the help of EL images, microdefects within the cell material could be detected and in this case, the damaged areas appear darker as they irradiate less energy [
16].
The conclusion from the comparison of the IR and EL inspection techniques is that they both have advantages in certain cases and disadvantages in others; nevertheless, the IR technique is more versatile, faster, less complicated, and cheaper. In other words, IR imaging allows a large number of PV module failures to be detected in an easier and more affordable way. This process could be accelerated and automated with the help of drones. According to [
2], the IR thermal imaging is very helpful to recognize hotspot areas over the surface of PV modules, which are an indicator for fire hazard in the near future. The risk of fire must be avoided in urban environments because, in addition to endangering people’s lives and property, it can also hinder the widespread use of solar energy. The EL technique is more complicated, more expensive, and requires additional equipment, though it could provide more precise results in certain situations. Furthermore, the EL inspection may require the study to be conducted in laboratory conditions; i.e., it may require panel dismantling.
The performed analysis shows that the IR imaging technique is more appropriate for the needs of this study.
4. Design, Implementation and Analysis of the Developed Research Infrastructure
The developed research facility is expanding the functionality of an already existing 12.6 kWp PV installation. The PV Park Kanev is located in the University of Ruse’s campus and consists of 36 Bluesun BSM350P-72 PV panels divided in 3 strings of 12 panels each. The main characteristics of the PV modules are as follows: 350 Wp at STC, 18.04% peak efficiency, 46.9 V open-circuit voltage, 9.6 A short-circuit current, 90% output power warranty for 10 years, and 80% output power warranty for 25 years. Furthermore, the system is equipped with a Huawei SUN2000-12KTL-M0 three-phase grid connected inverter. The three strings are positioned 4.5 m away from each other in order to provide enough free space for educational and research activities.
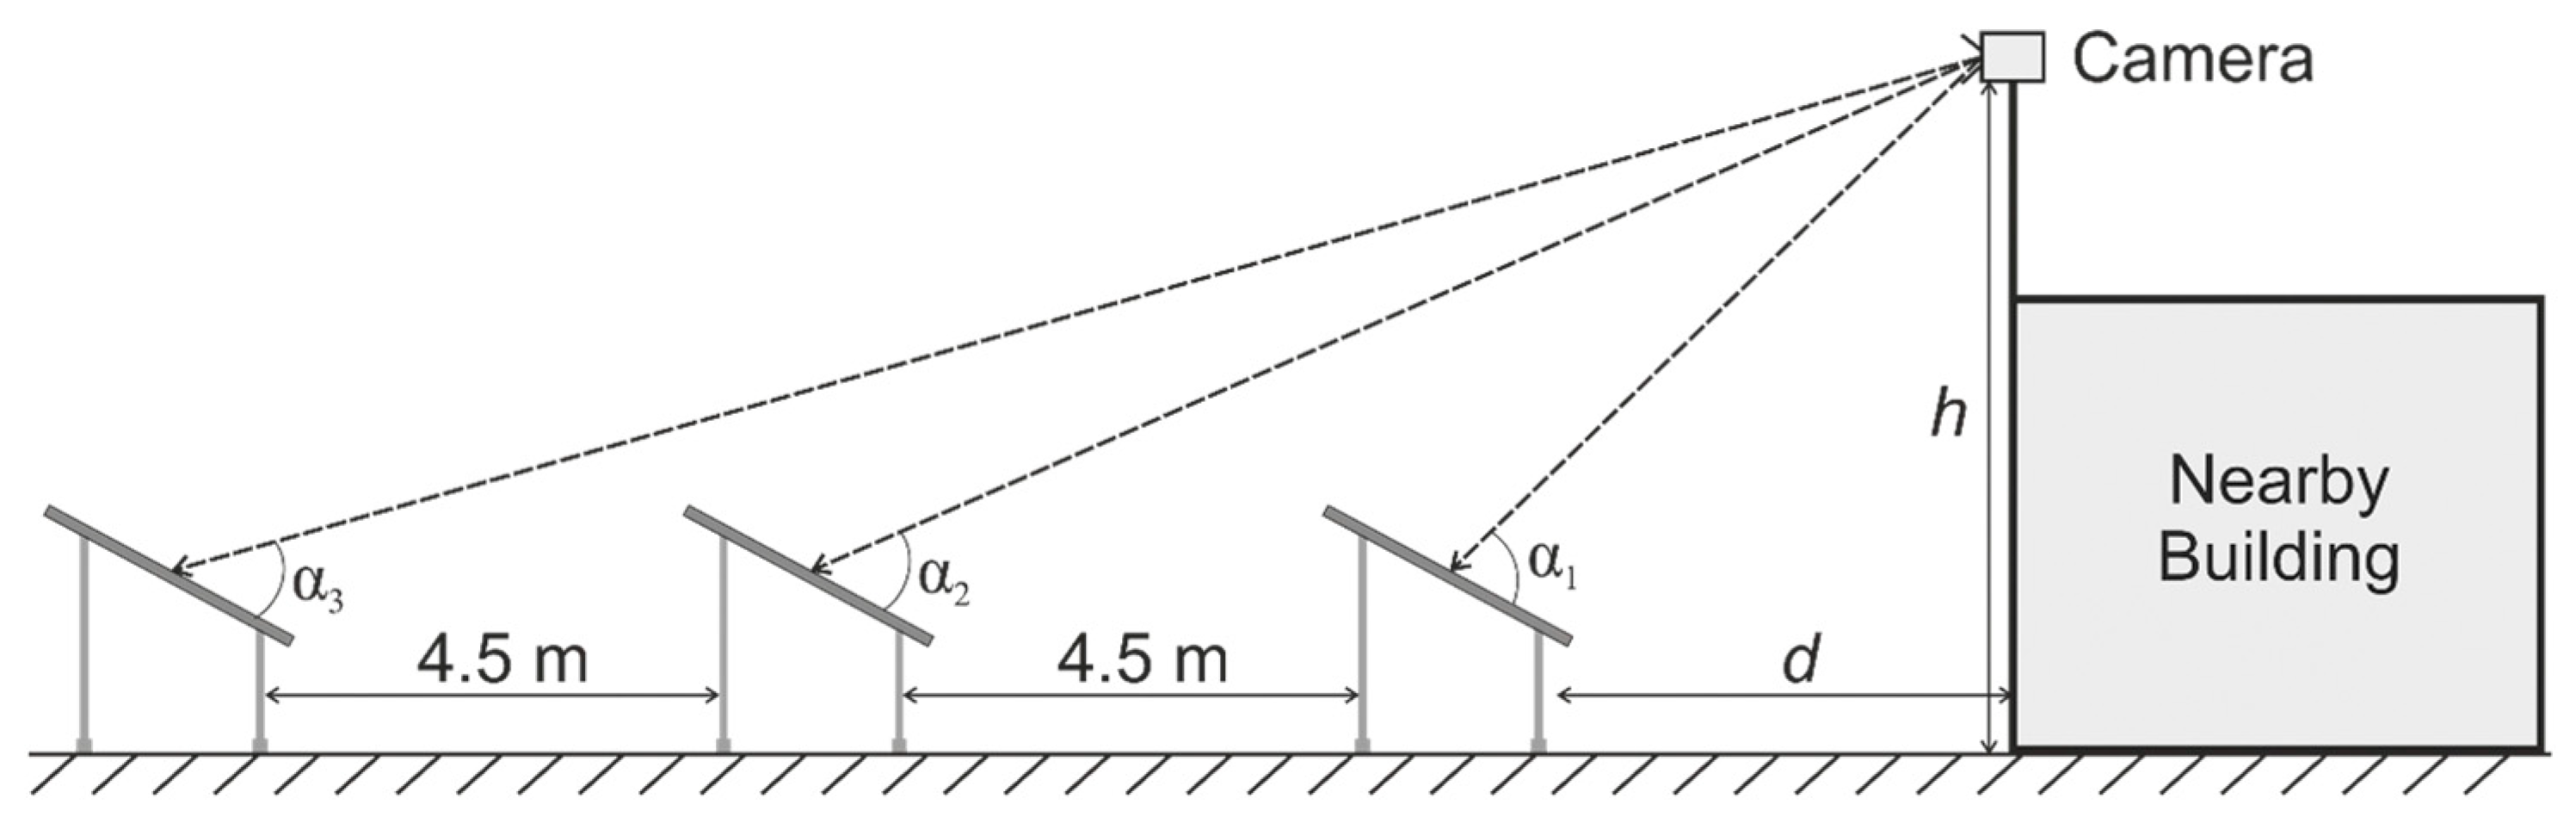
The selected tool for achieving the desired research activities is the Mobotix Mx-M16TB-R079 thermographic camera by Konika Minolta. It is equipped with two sensing units—one in the infrared and another in the visible spectrum. The infrared sensor characteristics are as follows: 336 × 252 px, IR range from 7.5 to 13.5 µm, thermal sensitivity of 50 mK and measurement temperature range from −40 to 550 °C. The visible spectrum is captured by a 6 MP, 3072 × 2048 px optical sensor. Both sensors have a 45° horizontal image angle. The camera is fixed on a pylon, installed on the nearby campus building, as shown in
Figure 1. It is set up to record the PV surfaces in the visible and IR spectrum with 1 Hz frequency; the video is stored on an SD card and can be observed from the local network of the University of Ruse. Furthermore, Mobotix provides powerful software capabilities, which allow the automatic identification of certain situations (such as temperature gradients, temperature thresholds, etc.), the generation of different notification events, storing screenshots, etc. It allows monitoring the temperature of up to 20 user-defined polygonal areas.
The distance d between the camera pylon and the closest PV string is chosen so that the camera is as close as possible, but it is able to “see” all panels of the nearby string. Similarly, the deviation of the camera above earth h is chosen so that it can “see” all PV strings simultaneously and they do not overlap each other.
The needed IR camera sensor resolution could be calculated with Equation (1):
Usually, the horizontal number of pixels is more important in order for a certain number of objects to be captured simultaneously and with sufficient details. The required horizontal number of pixels (Ncphmin) for detailed inspection of the IR sensor could be calculated by multiplying the number of horizontal standard-size PV cells (NPV cells) that must be captured by the required minimum number of pixels for detailed inspection (usually Nmin pixels = 5 px). In this case, for detailed inspection of the first row, consisting of 12 vertically mounted PV panels, each with six standard-size PV cells in the horizontal direction, an IR sensor with at least 360 horizontal pixels is required. The project does not require detailed automatic inspection for the whole installation, and it has been concluded that the 336 horizontal pixels of the chosen IR camera are enough for rough diagnostics.
The horizontal viewing angle of the IR sensor is also more important than the vertical one because 12 PV panels should be observed simultaneously. At the same time, for this PV facility, the camera could be mounted only on the nearby building (
Figure 1); hence, the installation distance
and the width
of the closest PV string are known. The required horizontal viewing angle β could be calculated according to:
In this case, the 45° horizontal viewing angle of the selected IR sensor is enough to capture the first PV string from the chosen mounting point.
According to [
19], the vertical angle between the module surface and the camera should be between 30 and 90 degrees. In our case, the thermographic camera has viewing angles α
1 = 53°, α
2 = 46° and α
3 = 42° toward the 1st, 2nd and 3rd string surfaces, respectively; i.e., the angles are according to the recommendations. The angle α is estimated with the following equation:
where
δ is the pixels’ viewing angle relative to the horizontal plane, and
τ is the tilt angle of the PV panels relative to the horizontal plane. The vertical angles can be increased by mounting the camera higher, but then it may also cast an undesired long-lasting shadow over the nearby string during the winter months.
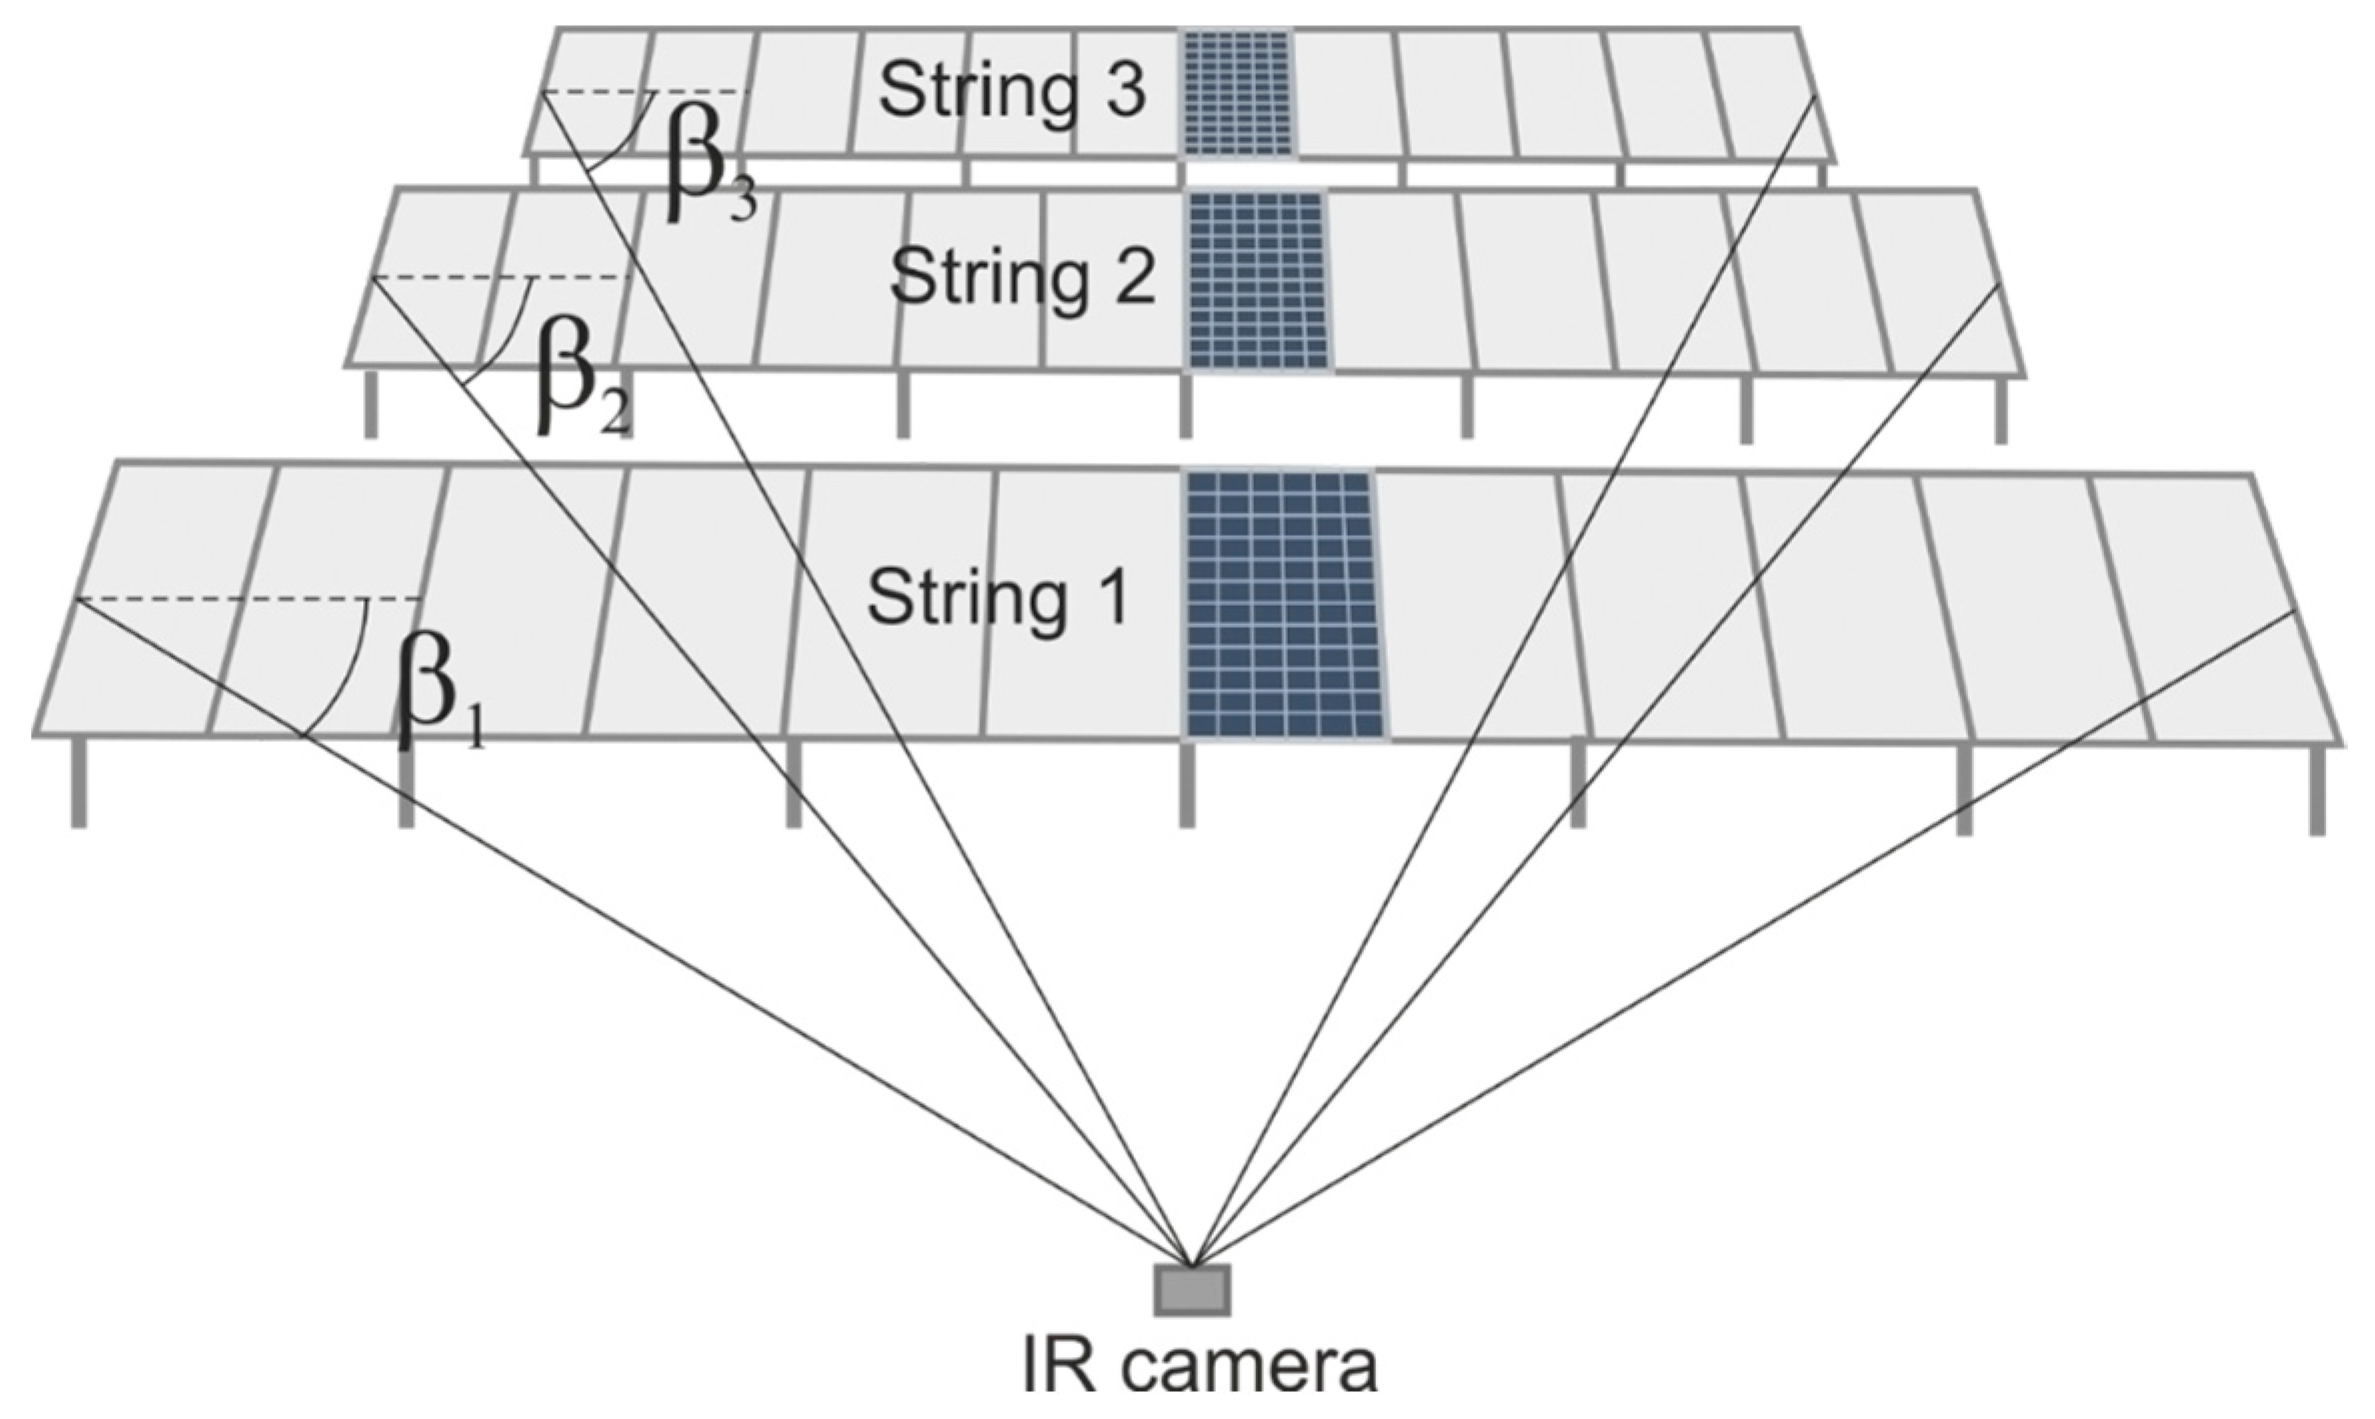
For detailed IR inspections, the camera must capture each solar cell with enough of a pixels-to-dimension ratio and therefore, the distance between the camera and the PV strings is important. In this case, the distances between the camera and the middle of the 1st, 2nd and 3rd strings are 14.99 m, 20.83 m and 26.87 m, respectively. Furthermore, the pixel size
in
varies for all PV panels depending on their location in the row. It is lowest in the middle of each row and grows toward its ends because the horizontal viewing angle decreases with the increase in distance. The horizontal angle is
in the middle for all rows and decreases to
,
and
for the 1st, 2nd and 3rd string, as shown in
Figure 2. As a result, the pixel size also increases with the increase in distance from the camera, and it is highest for the 3rd row and lowest for the 1st one.
The solar cells have dimensions
both horizontally and vertically. The pixel size
is calculated based on its distance from the IR camera using a complicated methodology that is presented in another study. The number of pixels
per cell in each direction can be obtained according to Equation (4):
Table 1 presents the best and worst pixel count per solar cell for each string horizontally and vertically. The number of pixels per solar cell for the vertical direction is lower because of the lower vertical viewing angle of the camera. This parameter could be improved if the camera is mounted higher; however, in this case, a year-round shade could be created, which is undesirable.
The conclusion is that in most cases, the camera could be used for detailed inspections of the 1st string. The number of pixels for the 2nd and 3rd strings are sufficient for rough inspections of the PV panels and their solar cells. In case a more detailed photo is required, a mobile camera could be used.
It can be seen that for the closest strings, the pixel count is more than 3 per cell (in both horizontal and vertical directions), while for the 3rd string, it is more than 2 px horizontally and less than 2 px vertically. Each cell is represented with more than 1 pixel, and this allows us to conclude that the designed installation will allow investigating the impact of different urban environmental factors, influencing the photovoltaic installations.
5. Discussion on Results and Research Scenarios
The implemented research infrastructure could be utilized in a number of research scenarios, which are described in the sections below.
5.1. Identification of the Type of Soiling on a PV Surface
For the practical application of photovoltaic installations, it is important to identify not only potential soiling problems but also the type of the soiling (dust, bird droppings, etc.). Furthermore, it is important to be able to distinguish between soiling and other environmental effects, such as shading and snow cover. For this scenario, both the IR and the visible spectrum cameras should be used and the potential tasks include:
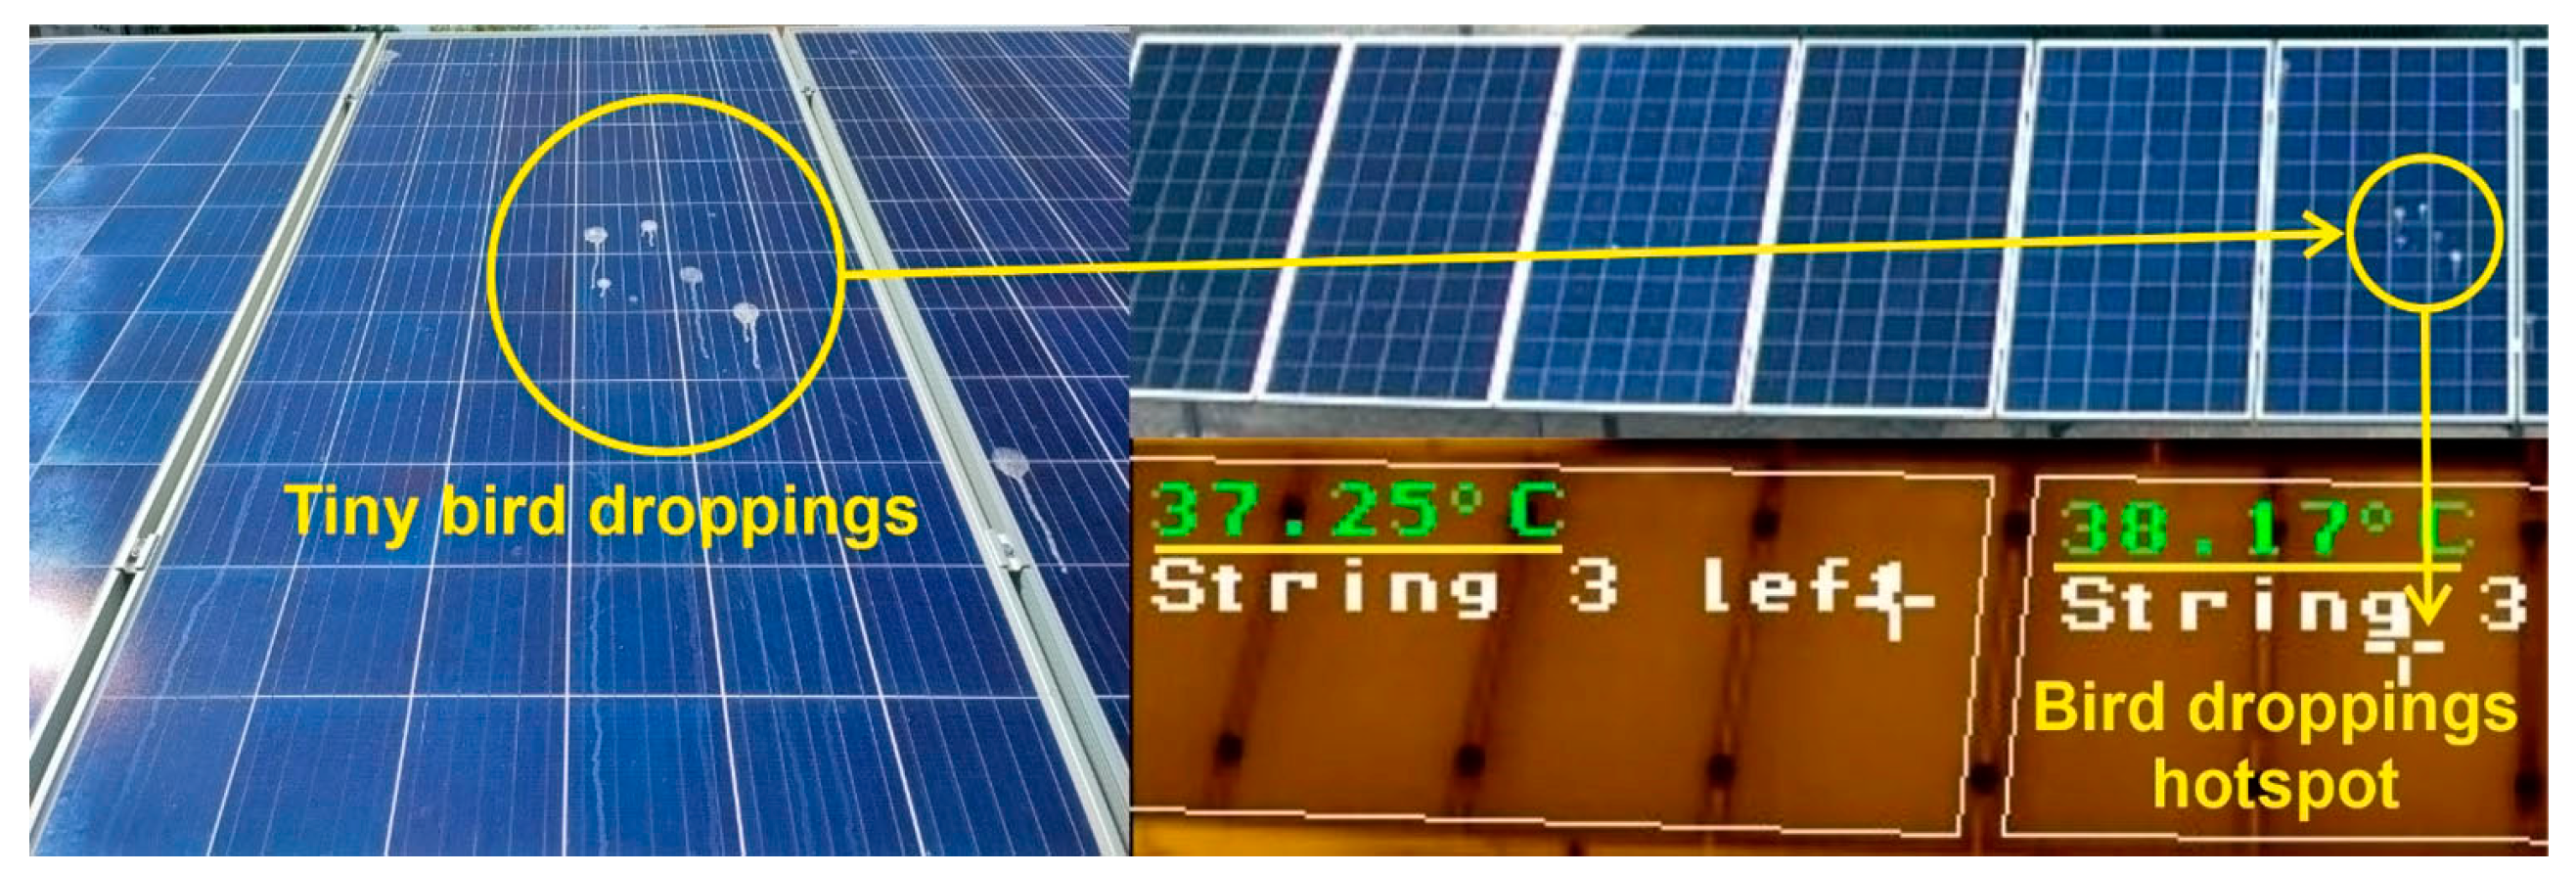
A situation with several small and thin bird droppings on one of the PV modules is presented in
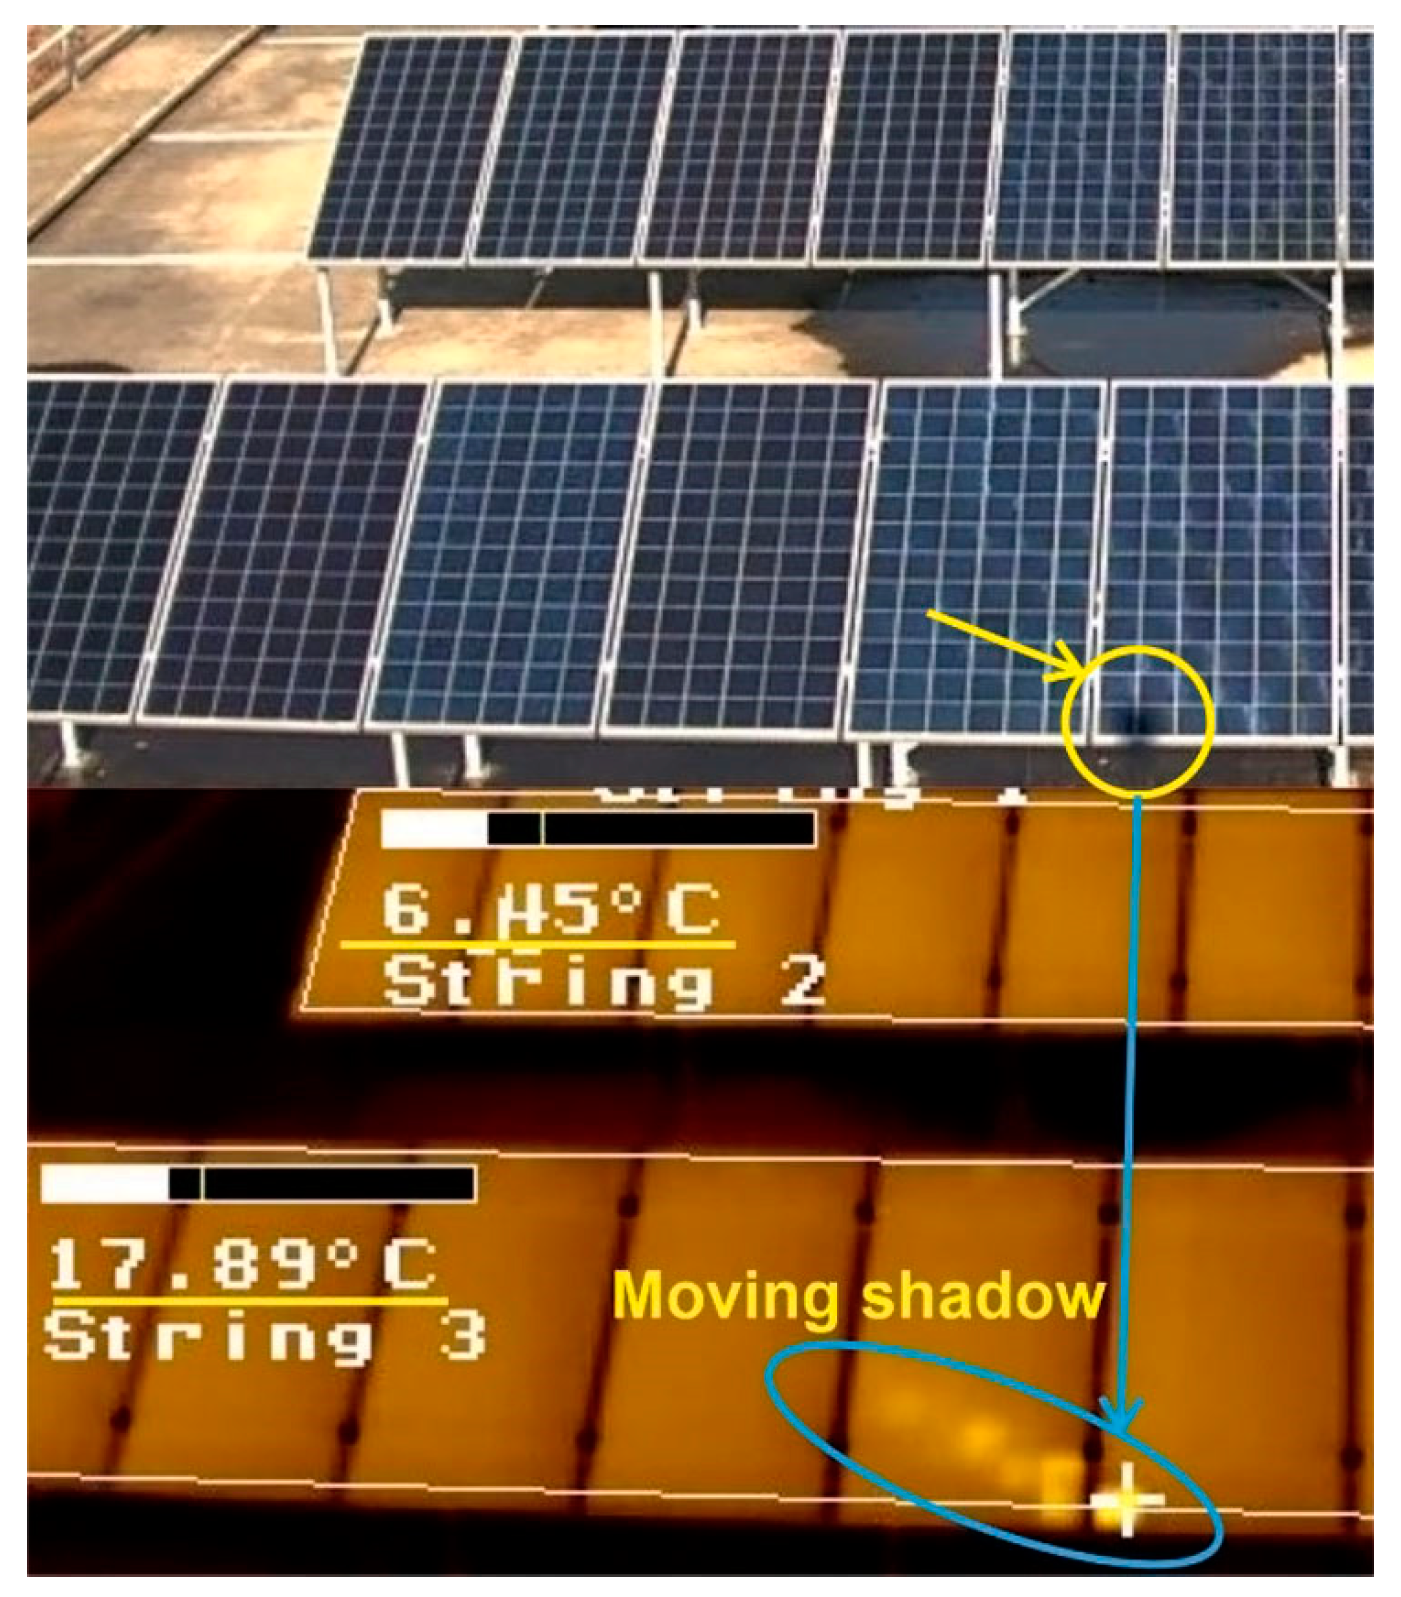
Figure 3. With the help of the IR camera, a hotspot with a low temperature gradient of approximately 1 °C can be identified in the area of the droppings. Larger and thicker bird droppings are expected to create a higher temperature gradient. A different situation can be observed in
Figure 4, where a small cell-sized shadow is moving over time. It creates a hotspot with an 11 °C temperature gradient compared to the non-influenced areas of the PV surface. Furthermore, the moving shadow creates a comet-like hotspot tail, which can be clearly observed with the IR camera. Another situation that influences the PV panels’ efficiency is demonstrated in
Figure 5. There, a whole PV cell is soiled, which leads to the activation of the bypass diode, and as a result, 20 cells become shunted.
Figure 5 shows that this situation can be clearly identified by the IR camera.
5.2. Modeling of a String’s Efficiency Decrease as a Function of Partial Shading/Soiling of the Surface
As shading/soiling/snow cover reduce the produced PV power of the string, it is important not only to identify the availability of such factors but also to correlate them with the energy losses. This is especially important when assessing the economic effect of cleaning the surface of photovoltaic installations. This scenario relies on both cameras, yet supporting and reference data are also required, such as the solar radiation, the environment temperature, the power production, etc. The goal of such experiments is to compare the power production of different PV modules/strings as a function of their thermal signatures and supporting information.
5.3. Evaluation of the Influence of the Camera Distance and Angle on the Accuracy of the Performed Measurements
As was already stated, the pixel count per cell depends on several factors, such as the distance, horizonal and vertical viewing angles between the camera and the PV surface. Furthermore, the IR cameras are known to have significantly lower resolution compared to visible spectrum ones. Therefore, it is also of significant importance to investigate the influence of these factors on the identification capabilities as well as on the accuracy of the measurements and classifications performed.
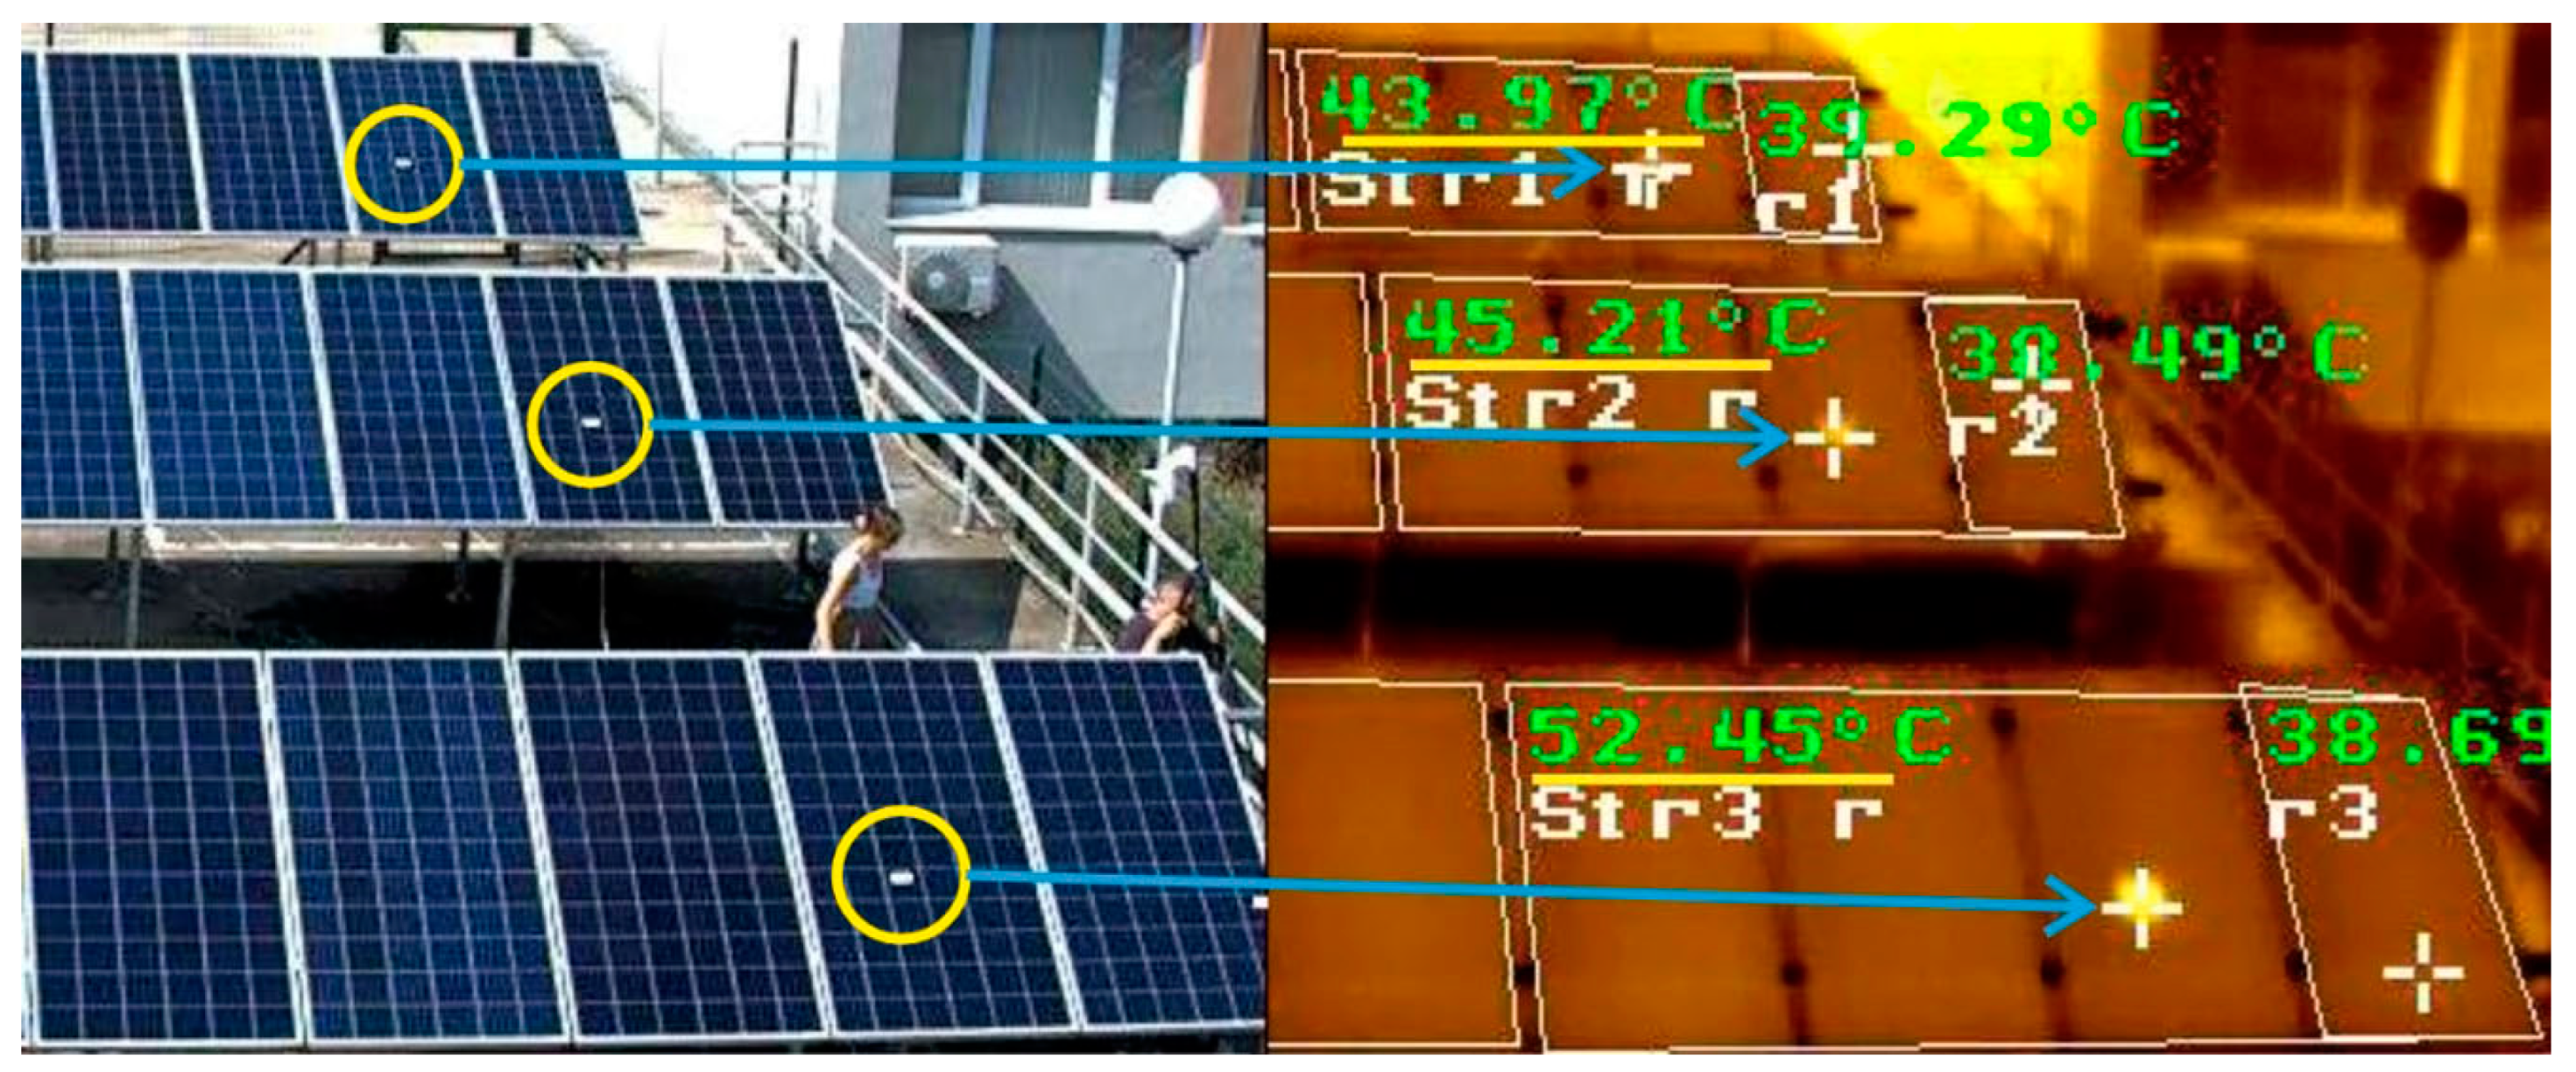
Such a situation is demonstrated in
Figure 6, where the same factor is applied on the three different strings placed at different distances from the camera. It can be observed that the distance influences the measured temperatures with the closest hotspot being the highest (52.5 °C) and the farthest one—the lowest (44.0 °C). This demonstrates the uncertainty when measuring the temperature field of PV surfaces and directly indicates the necessity to account it in all studies that rely on IR imaging.
To implement this scenario, mostly the IR spectrum camera should be used. The main goal is to evaluate the loss of accuracy and the uncertainty of any developed model as a function of the reduction in the pixel count per solar cell ratio.
5.4. Continuous Monitoring of the PV Installation
Naturally, some problems with the solar PV surfaces could only be investigated and identified when they actually occur. Other factors such as degradation could only be assessed in a long-term experiment. Therefore, an important usage scenario is the long-term monitoring of the installation.
All the previously presented scenarios suggest storing images in a database on a regular basis (at least once per day) so that they can be analyzed later. Once a new defect is detected on any of the PV modules, the long-term data should be analyzed in order to assess its development and the reasons for its occurrence.
6. Conclusions
The IR imaging is a valuable method for diagnosing PV infrastructures and identifying a wide range of environmental factors. This study presents the design and implementation of a research facility in the field of renewable energy sources with an infrared monitoring system. Different methods for non-invasive inspection of photovoltaic installations are analyzed in order to choose the most appropriate technology. Next, the main requirements toward the research facility are defined, which correspond with the goals of the laboratory “Digital energy systems 4.0” at the University of Ruse “Angel Kanchev”.
The characteristics of the existing photovoltaic installation, whose functionality is being enhanced, are presented together with the parameters of the chosen combined infrared and visible spectrum camera. The minimum and maximum pixel counts per cell are estimated for the different strings, considering the distance between the camera and the PV panels, the resolution of the IR sensor, and the dimensions of the solar cells.
The designed and implemented thermographic system provides a wide range of possibilities for research activities, which are summarized in the final part of the paper. Four main research areas are defined, where the thermographic tool could be applied: the identification of the type of soiling over a PV surface; the modeling of a string’s efficiency decrease as a function of partial shading/soiling of the surface; the investigation of the influence of distance on the accuracy and uncertainty of the performed IR measurements; and the continuous long-term monitoring of the PV installation.
Example images obtained by the Mobotix camera have been presented that allow identifying several situations within the above scenarios. They prove that the developed research infrastructure has the potential to perform a wide range of experiments with photovoltaic installations under the influence of urban environmental factors. Such investigations require careful planning and implementation and are an object for future studies.


 ,
, 

