
Analysis and Modeling of 581 kWp Grid-Integrated Solar Photovoltaic Power Plant of Academic Institution Using PVsyst †


Abstract
1. Introduction
2. Methodology
3. Results Analysis
4. Conclusions
Author Contributions
Funding
Institutional Review Board Statement
Informed Consent Statement
Data Availability Statement
Acknowledgments
Conflicts of Interest
References
- Kumar, B.S.; Sudhakar, K. Performance evaluation of 10 MW grid connected solar photovoltaic power plant in India. Energy Rep. 2015, 1, 184–192. [Google Scholar] [CrossRef]
- Alsadi, S.; Khatib, T. Photovoltaic Power Systems Optimization Research Status: A Review of Criteria, Constrains, Models, Techniques, and Software Tools. Appl. Sci. 2018, 8, 1761. [Google Scholar] [CrossRef]
- Sharma, S.; Kurian, C.P.; Paragond, L.S. Solar PV System Design Using PVsyst: A Case Study of an Academic Institute. In Proceedings of the 2018 International Conference on Control, Power, Communication and Computing Technologies (ICCPCCT), Kannur, India, 23–24 March 2018; pp. 123–128. [Google Scholar] [CrossRef]
- Sheoran, M.; Kumar, P.; Sharma, S.; Bukya, M. Current situation analysis of solar PV waste management in India. Mater. Today: Proc. 2022, 58, 773–782. [Google Scholar] [CrossRef]
- Adaramola, M.S. Viability of grid-connected solar PV energy system in Jos, Nigeria. Int. J. Electr. Power Energy Syst. 2014, 61, 64–69. [Google Scholar] [CrossRef]
- Anonymous 2017 Press Information Breau, Ministry of New and Renewable Energy, Government of India. Available online: http://pib.nic.in/newsite/pmreleases.aspx?mincode=28 (accessed on 13 August 2017).
- Kumar, P.; Bukya, M.; Shankar, A.; Garg, P.; Gowtham, N. An experimental approach towards cost benefit analysis of 850 kW solar PV plant. Vis. Sustain. 2023, 19, 255–266. [Google Scholar] [CrossRef]
- Ayompe, L.M.; Dufy, A.; McCormack, S.J.; Conlon, M. Measured performance of a 1.72 kW rooftop grid connected photovoltaic system in Ireland. Energy Convers. Manag. 2011, 52, 816–825. [Google Scholar] [CrossRef]
- Baltus CW, A.; Eikelboom, J.A.; Van Zolingen, R.J.C. Analytical monitoring of losses in PV systems. In Proceedings of the 14th European Photovoltaic Solar Energy Conference, Barcelona, Spain, 30 June–4 July 1997. [Google Scholar]
- Garg, P.; Bukya, M.; Kumar, P. Cost Benefit Analysis of 50 kW Solar Power Plant for Educational Hostel Building. In Proceedings of the 2022 2nd International Conference on Innovative Sustainable Computational Technologies (CISCT), Dehradun, India, 23–24 December 2022; pp. 1–5. [Google Scholar] [CrossRef]
- Chaita, A.; Kluabwang, J. Performance evaluation of 3.5 kWp rooftop solar PV plant in Thailand. In Proceedings of the International MultiConference of Engineers and Computer Scientists, Vol II, IMECS 2016, Hong Kong, China, 16–18 March 2016. [Google Scholar]
- Tamoor, M.; Bhatti, A.R.; Farhan, M.; Miran, S.; Raza, F.; Zaka, M.A. Designing of a Hybrid Photovoltaic Structure for an Energy-Efficient Street Lightning System Using PVsyst Software. Eng. Proc. 2021, 12, 45. [Google Scholar] [CrossRef]
- Nfaoui, M.; El-Hami, K. Extracting the maximum energy from solar panels. Energy Rep. 2018, 4, 536–545. [Google Scholar] [CrossRef]
- Gao, Z.; Li, S.; Zhou, X.; Ma, Y. An overview of PV system. In Proceedings of the 2016 IEEE International Conference on Mechatronics and Automation, Harbin, China, 7–10 August 2016; pp. 587–592. [Google Scholar]
- Irwanto, M.; Safwati, I.; Gomesh, N. Analysis simulation of the photovoltaic output performance. In Proceedings of the 2014 IEEE 8th International Power Engineering and Optimization Conference (PEOCO2014), Langkawi, Malaysia, 24–25 March 2014; pp. 477–481. [Google Scholar]
- Sheoran, M.; Kumar, P.; Sharma, S.; Bukya, M. After Life Cost Modelling of 160 kW Grid Integrated Solar Photovoltaic Plant: BSDU Jaipur. In Flexible Electronics for Electric Vehicles; Dwivedi, S., Singh, S., Tiwari, M., Shrivastava, A., Eds.; Lecture Notes in Electrical Engineering; Springer: Singapore, 2023; Volumr 863. [Google Scholar] [CrossRef]
- Bukya, M.; Kumar, P.; Kumar, R. On-Grid Solar Photovoltaic Power Plant Analysis Under PVsyst Simulation Software Platform. In Flexible Electronics for Electric Vehicles; Dwivedi, S., Singh, S., Tiwari, M., Shrivastava, A., Eds.; Lecture Notes in Electrical Engineering; Springer: Singapore, 2023; Volume 863. [Google Scholar] [CrossRef]
- Siregar, Y.; Hutahuruk, Y.; Suherman. Optimization Design and Simulating Solar PV System Using PVSyst Software. In Proceedings of the 2020 4th International Conference on Electrical, Telecommunication and Computer Engineering (ELTICOM), Medan, Indonesia, 3–4 September 2020; pp. 219–223. [Google Scholar] [CrossRef]
- Sharma, S.; Bukya, M.; Kumar, P. PVsyst modeling of 800 kWp capacity grid-tied solar photovoltaic power plant for academic institution. Vis. Sustain. 2023, 20, 175–188. [Google Scholar] [CrossRef]
- Dalal, S.; Jadhav, V.; Raut, R.; Narkhede, S. Analysis of 1KW Solar Rooftop System by Using PYSyst. In Proceedings of the 2nd International Conference on Communication & Information Processing (ICCIP), Pune, India, 26–27 June 2020. [Google Scholar]


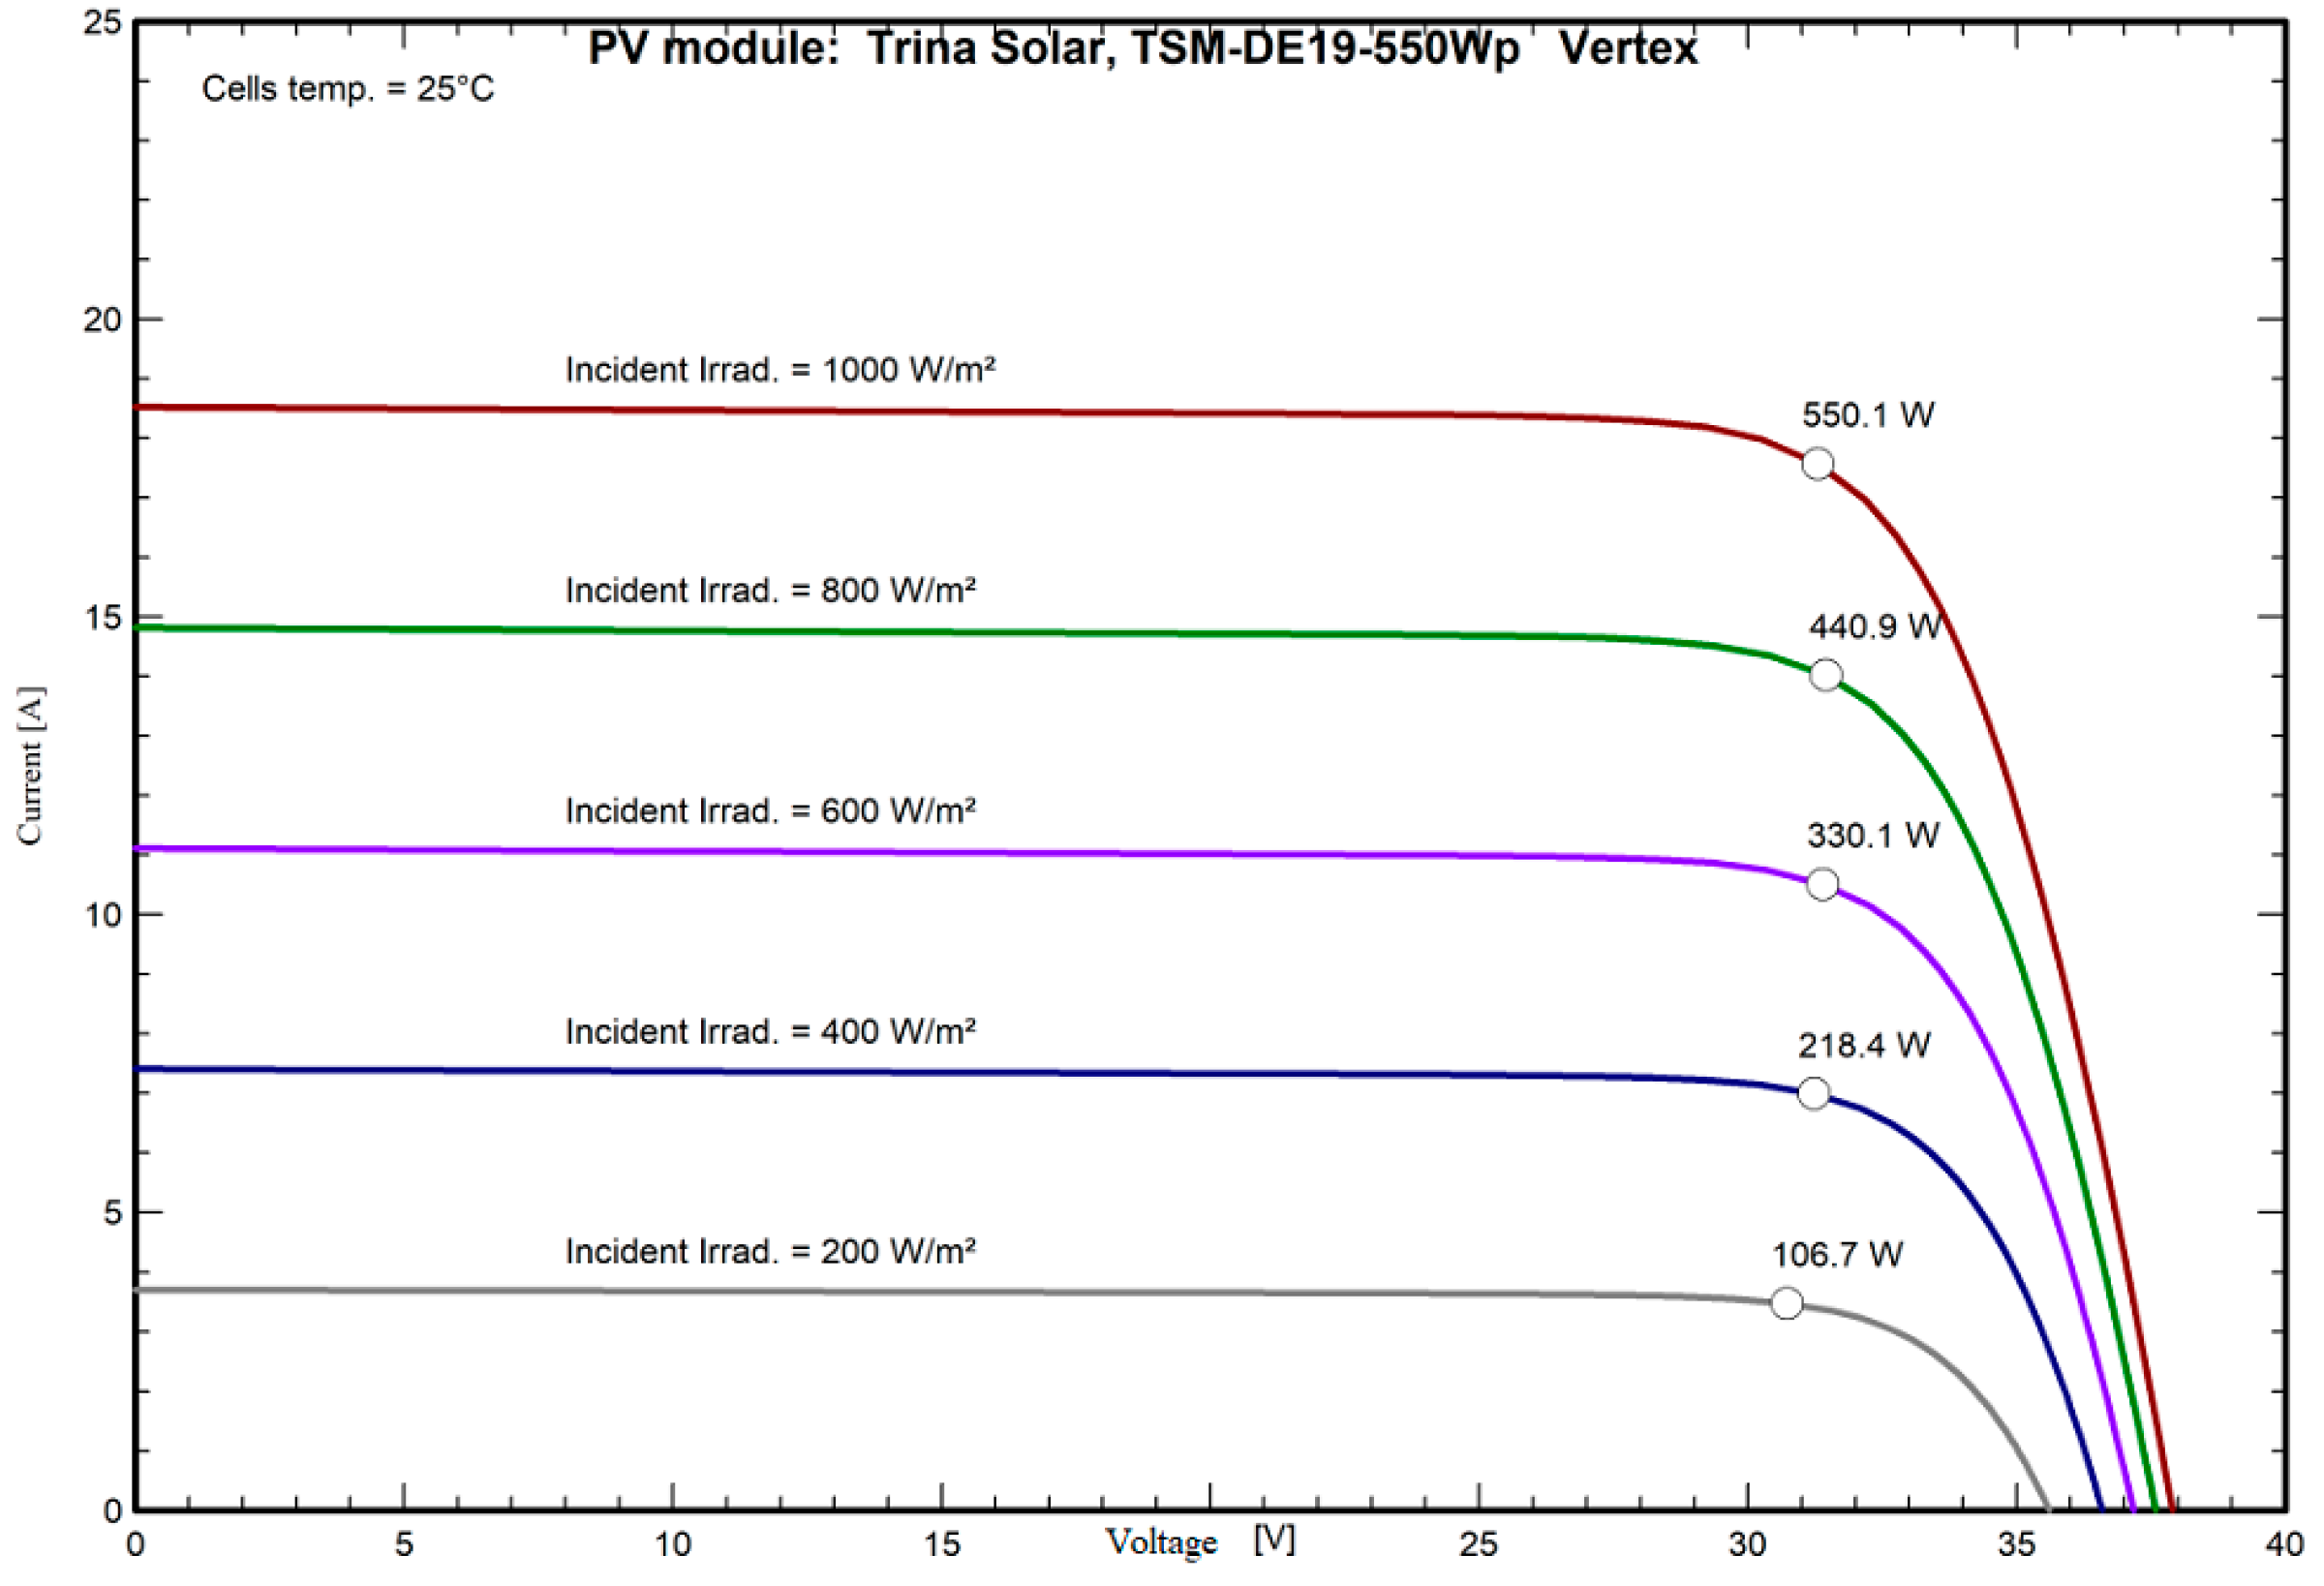
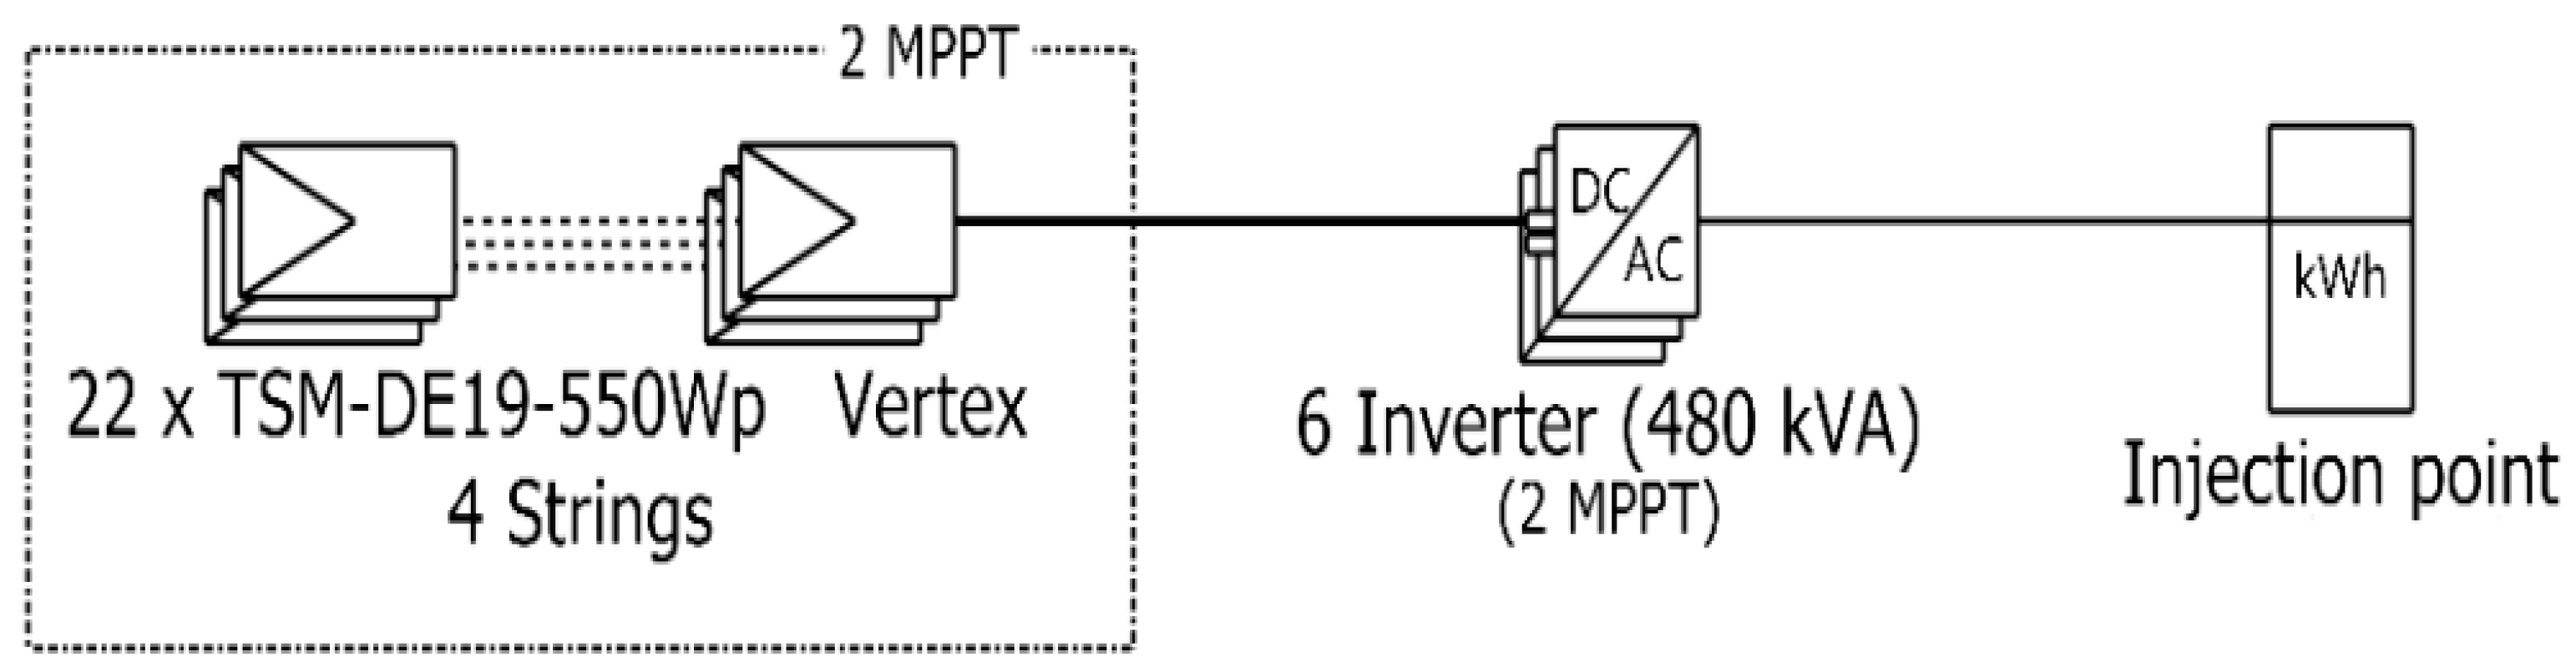
| Model | TSM-DE 19-550Wp Vertex | ||
|---|---|---|---|
| Pnom STC Power (Manufacturer) | 550 Wp | Technology | Si-mono |
| Module Size (W × L) | 1.096 × 2.384 m2 | Rough module area (Amodule) | 2.61 m2 |
| Number of cells | 2 × 55 | Sensitive area cells (Acells) | 2.64 m2 |
| Specifications for the model (Manufacturer or measurement data) | |||
| Reference temperature (Tref) | 25 °C | Reference irradiance (Gref) | 1000 W/m2 |
| Open circuit voltage (Voc) | 37.9 V | Short Circuit Current (Isc) | 18.52 A |
| Max. power point voltage (Vmpp) | 31.6 V | Max. power point current (Impp) | 17.40 A |
| => maximum power (Pmpp) | 549.8 W | Isc temperature coefficient (mulsc) | 7.4 mA/°C |
| One-diode model parameters | |||
| Shunt Resistance (Rshunt) | 200 Ω | Diode saturation current (IoRef) | 0.040 nA |
| Serie Resistance (Rserie) | 0.12 Ω | Voc temp. coefficient (MuVoc) | −105 mV/°C |
| Specified Pmax temper. Coeff. (muPMaxR) | −0.34%/°C | Diode Quality Factor (Gamma) | 1.00 |
| Diode factor temper. Coeff. (mu Gamma) | 0.0001/°C | ||
| Reverse- Bias Parameters, for use in behavior of PV arrays under partial shadings or mismatch | |||
| Reverse characteristics (dark) (BRev) | 3.20 mA/V2 | (Quadratic factor (per cell)) | |
| Number of by-pass diodes per module | 3 | Direct voltage of by-pass diodes | −0.7 V |
| Model results for standard conditions (STC: T = 25 °C, G = 1000 W/m2, AM = 1.5) | |||
| Max. power point voltage (Vmpp) | 31.3 V | Max. power point current (Impp) | 17.58 A |
| Maximum power (Pmpp) | 550.1 Wp | Power temper. Coefficient (mupmpp) | −0.34%/°C |
| Efficiency (/module area) (Eff_mod) | 21.1% | Fill factor (FF) | 0.784 |
| Efficiency (/cell area) (Eff_cells) | 22.7% | ||
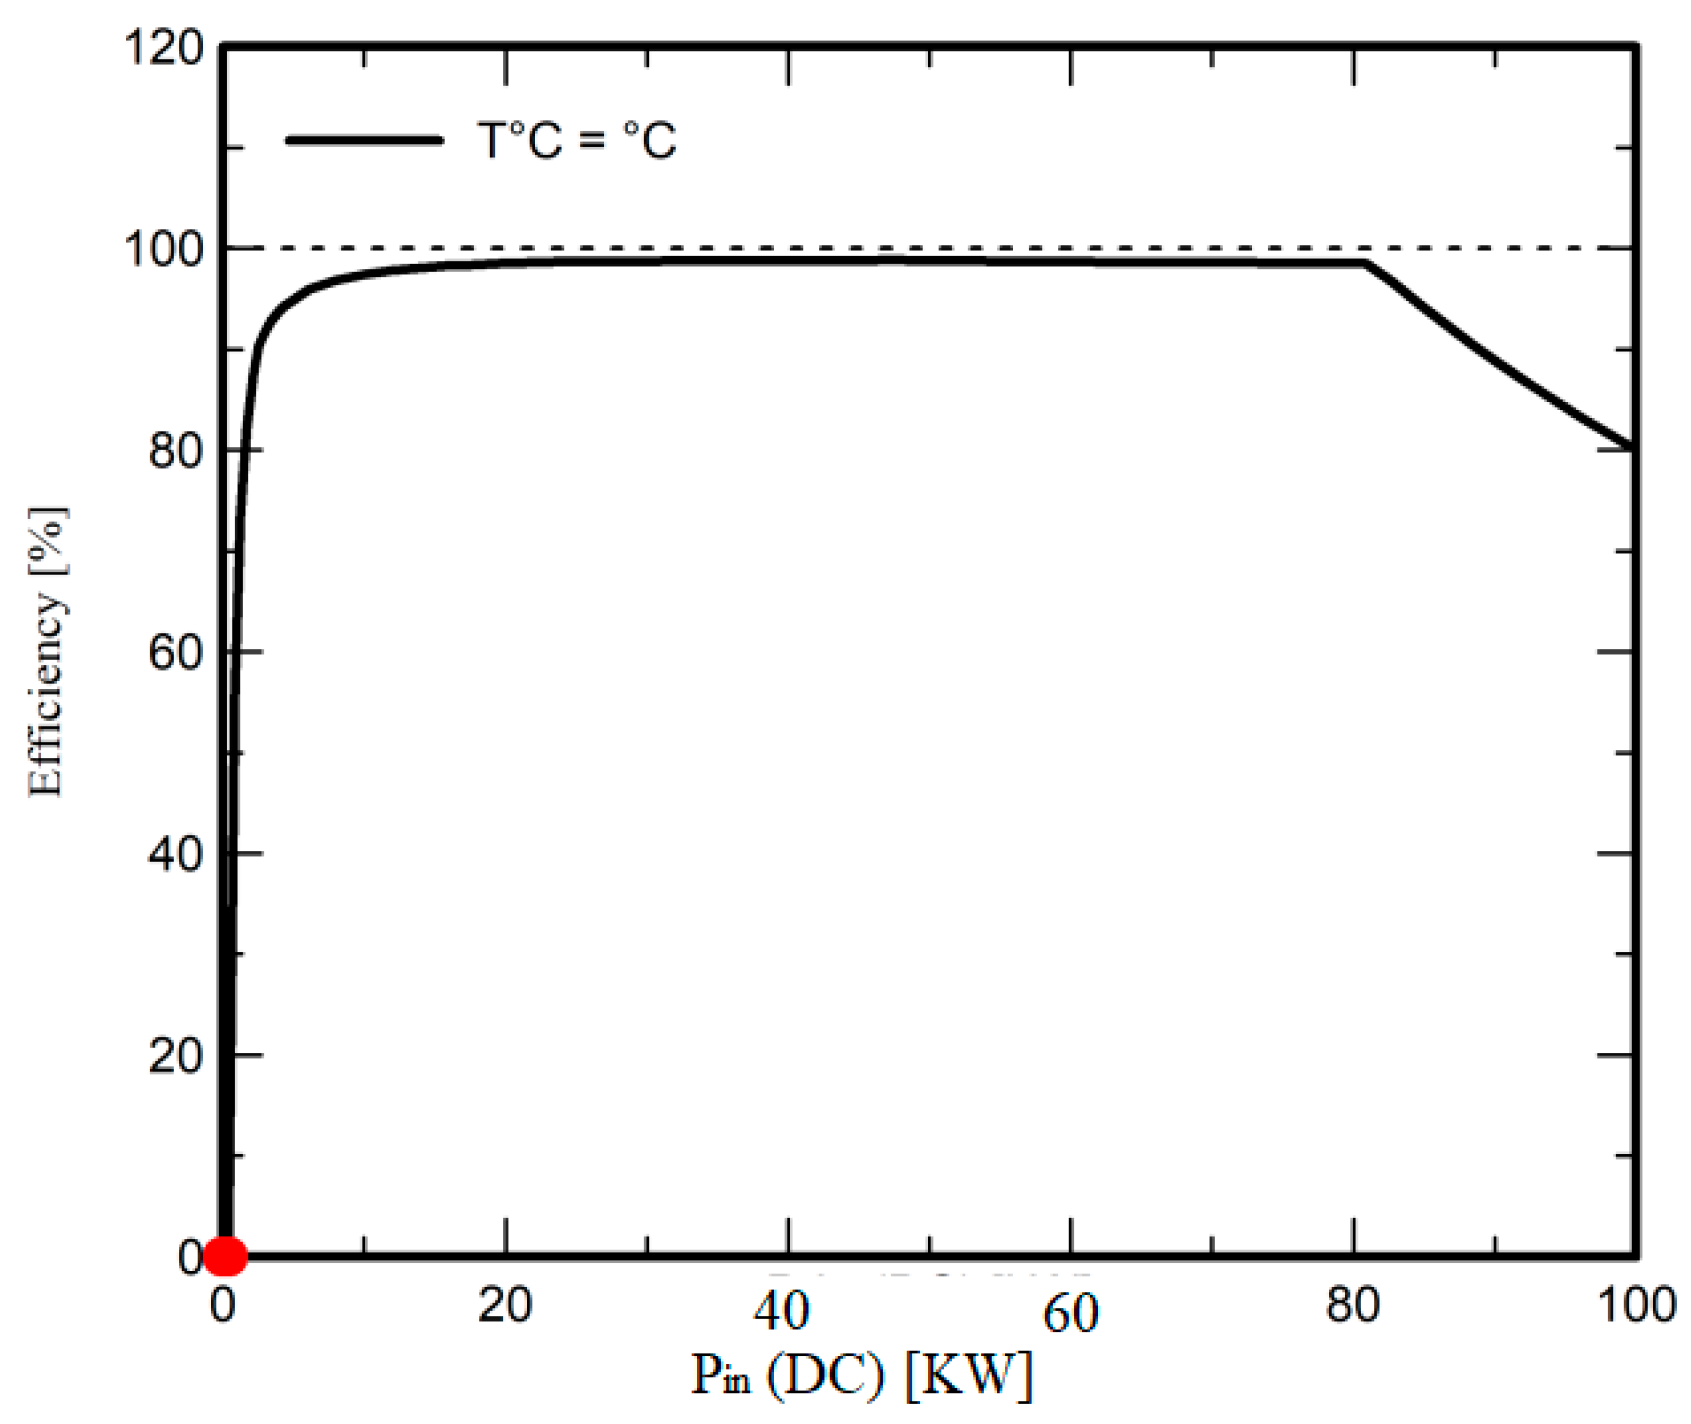
| Inverter—Solar Inverter M80H (480 VAC) | |||
|---|---|---|---|
| Model | Solar Inverter M80H (480 VAC) | ||
| Commercial Data | Data Source | ||
| Protection: | IP65 | ||
| Control: | Display operational data | Width | 615 mm |
| Height | 950 mm | ||
| Depth | 275 mm | ||
| Weight | 84.00 kg | ||
| Input characteristics (PV array side) | |||
| Operating mode | MPPT | Nominal PV Power (Pnom DC) | 80 kW |
| Minimum MPP Voltage (Vmin) | 200 V | Maximum PV Power (Pmax DC) | 89 kW |
| Maximum MPP voltage (Vmax) | 800 V | Power Threshold (Pthresh) | 396 W |
| Absolute max. PV Voltage (Vmax array) | 1000 V | ||
| Min. Volatge for PNom (Vmin@Pnom) | 635 V | ||
| “String” Inverter with input protections | Multi MPPT Capability | ||
| Number of string inputs | 18 | Number of MPPT inputs | 2 |
| Behavior at Vmin/Vmax | Limitation | ||
| Behaviour at Pnom | Limitation | ||
| Output Characteristics (AC grid side) | |||
| Grid Voltage (Imax) | Triphased 480 V | Nominal AC Power (Pnom AC) | 80 kWac |
| Grid Frequency | 50/60 Hz | Maximum AC Power (Pmax AC) | 88 kWac |
| Maximum efficiency | 98.8% | Nominal AC current (Inom AC) | 97 A |
| European average efficiency | 98.4% | Maximum AC current (Imax AC) | 106 A |
Disclaimer/Publisher’s Note: The statements, opinions and data contained in all publications are solely those of the individual author(s) and contributor(s) and not of MDPI and/or the editor(s). MDPI and/or the editor(s) disclaim responsibility for any injury to people or property resulting from any ideas, methods, instructions or products referred to in the content. |
© 2024 by the authors. Licensee MDPI, Basel, Switzerland. This article is an open access article distributed under the terms and conditions of the Creative Commons Attribution (CC BY) license (https://creativecommons.org/licenses/by/4.0/).
Share and Cite
Hanni, J.R.; Bukya, M.; Kumar, P.; Gowtham, N. Analysis and Modeling of 581 kWp Grid-Integrated Solar Photovoltaic Power Plant of Academic Institution Using PVsyst. Eng. Proc. 2023, 59, 142. https://doi.org/10.3390/engproc2023059142
Hanni JR, Bukya M, Kumar P, Gowtham N. Analysis and Modeling of 581 kWp Grid-Integrated Solar Photovoltaic Power Plant of Academic Institution Using PVsyst. Engineering Proceedings. 2023; 59(1):142. https://doi.org/10.3390/engproc2023059142
Chicago/Turabian StyleHanni, Jayalaxmi Rajesh, Mahipal Bukya, Pancham Kumar, and Nagaraju Gowtham. 2023. "Analysis and Modeling of 581 kWp Grid-Integrated Solar Photovoltaic Power Plant of Academic Institution Using PVsyst" Engineering Proceedings 59, no. 1: 142. https://doi.org/10.3390/engproc2023059142
APA StyleHanni, J. R., Bukya, M., Kumar, P., & Gowtham, N. (2023). Analysis and Modeling of 581 kWp Grid-Integrated Solar Photovoltaic Power Plant of Academic Institution Using PVsyst. Engineering Proceedings, 59(1), 142. https://doi.org/10.3390/engproc2023059142