Proceeding Paper

Non-Linear Optical Properties for Thin Films of Fluorescein Organic Laser Dyes Doped with Polyvinyl Alcohol Polymer and Al2O3 Nanoparticles †

1
Department of Medical Laboratory Techniques, Hilla University College, Hillah 51001, Babylon, Iraq
2
Physics Department, College of Science, University of Babylon, Hillah 51001, Babylon, Iraq
3
Department of Medical Physics, Hilla University College, Hillah 51001, Babylon, Iraq
*
Author to whom correspondence should be addressed.
Presented at the International Conference on Recent Advances in Science and Engineering, Dubai, United Arab Emirates, 4–5 October 2023.
Eng. Proc. 2023, 59(1), 141; https://doi.org/10.3390/engproc2023059141
Published: 4 January 2024
(This article belongs to the Proceedings of Eng. Proc., 2023, RAiSE-2023)

Abstract

:
This article presents a comprehensive study on the optical properties of fluorescein dye doped with PVA polymer and Al 2 O 3 nanoparticles. The investigation covers the material’s absorbance behavior, surface morphology, and nonlinear optical characteristics. Through the use of UV-VIS spectrometry and AFM, the study demonstrates how doping affects the dye’s absorption spectrum and grain size on the surface. The application of the Z-scan technique further allows for the measurement of the nonlinear refractive index and absorption coefficient, revealing self-defocusing lensing and distinguishing the absorption phenomena in both solutions and thin films. The results underscore the potential of fluorescein-based materials in the development of advanced optical devices, offering valuable insights for future research in material science and photonics.

1. Introduction

Large organic molecules constitute the active materials in laser dyes [1]. When dissolved in suitable solvents such as ethanol, methanol, or an ethanol–water mixture, these organic molecules can function as the lasing medium in dye lasers [2]. Laser dyes are characteristically complex molecules, often featuring multiple ring structures, which contribute to their intricate absorption and emission spectra [3]. Depending on their chemical structures, laser dyes can be categorized into various classes, with coumarins, xanthenes, and pyrromethenes being typical examples [4]. The significant long-wavelength absorption band of these dyes is due to the electronic state transition from the ground state (S 0 ) to the first excited singlet state (S 1 ), characterized by a high transition moment and an oscillator strength close to unity. The reverse transition from S 1 to S 0 is the source of spontaneous emission in dye lasers [5]. In applications, laser dyes serve as the active media in both pulsed and continuous-wave (CW) dye lasers and are utilized as ultrafast shutters for Q-switching and passive mode-locking, necessitating a diverse range of dyes to span the complete spectral range [6]. The use of dye mixtures as a lasing medium is primarily motivated by the enhancement of laser performance and the capability for multi-frequency operation [7]. This study investigates the nonlinear optical properties of fluorescein organic laser dye doped with polyvinyl alcohol (PVA) polymer and aluminum oxide (Al 2 O 3 ) nanoparticles. These dyes were dissolved in ethanol at varying concentrations of 1 × 10 5 , 3 × 10 5 , 5 × 10 5 and 7 × 10 5 M and analyzed at room temperature.

2. Theory

The theoretical framework for evaluating the optical properties of dye solutions begins with the determination of the linear absorption coefficient ( α o ), which is derived from Equation (1) [8,9,10]:
α o = ln ( 1 / T ) t
where t represents the thickness of the sample, and T is its transmittance. Additionally, the refractive index ( n o ) is a critical parameter that can be deduced from the transmittance spectrum of the film, as per Equation (2) [10]:
n o = 1 T + 1 T 2 1 1 / 2
Transmittance, denoted as T % , indicates the percentage of incident light that the solvent allows to pass through [11]. For instance, a 50% transmittance means that half of the incident light is transmitted through the solution [12]. This can be quantified by Equation (3):
T % = I I o × 100 %
where I o is the intensity of the incident light, and I is the intensity of the transmitted light. The interrelation between transmittance (T) and absorbance (A) is articulated through Equation (4) [12]:
A = log 10 1 T

3. Materials and Methods

Fluorescein, belonging to the xanthene class of dyes, is characterized by its high chemical stability, which is influenced by the polarity of the solvent. It typically appears as an orange-red to dark crystalline powder [13]. Its applications are diverse, ranging from being a fluorescent tracer in technical chemistry, microscopy, serology, and forensics to its use in medical diagnostics, such as in surgery for brain tumors, angiography, and ophthalmology [14,15,16]. Fluorescein is also utilized for its sterile properties, with the molecular formula C 20 H 12 O 5 , as depicted in Figure 1. Solutions with a concentration of 10 4 M were prepared using fluorescein dye in ethanol solvent. An electronic balance (BL 210 S, Sartorius, Goettingen, Germany) with four-digit sensitivity was employed to weigh the powder. Various concentrations ( 1 × 10 5 , 3 × 10 5 , 5 × 10 5 , and 7 × 10 5 M) were prepared using Equation (5) [17]:
W = M w × V × C 1000
where W is the weight of the dye (g), M w is the molecular weight of the dye (g/mol), V is the volume of the solvent (mL), and C is the concentration (M). The solutions were subsequently diluted according to Equation (6) [18]:
C 1 V 1 = C 2 V 2
where C 1 and C 2 are the initial and final concentrations, respectively, and V 1 and V 2 are the volumes before and after dilution, respectively.

4. Results and Discussion

Atomic force microscopy (AFM), one of the proven technique [19,20], was utilized to analyze the surface topology of thin films of fluorescein dye doped with PVA polymer and Al 2 O 3 nanoparticles at a concentration of 10 3 M. Figure 2 and Figure 3 illustrate the two-dimensional (2-D) and three-dimensional (3-D) images, respectively, providing insights into the distribution of granular growth groups on the surfaces of the deposited films. As indicated in Table 1, there is a discernible increase in both the average grain size and the root mean square (r.m.s) of surface roughness with an increase in film thickness for both undoped and doped fluorescein (FL) thin films [6].
The absorbance spectra of the fluorescein organic laser dye at various concentrations ( 1 × 10 5 , 3 × 10 5 , 5 × 10 5 , and 7 × 10 5 M) in ethanol were recorded over a wavelength range of 190 to 1100 nm using a UV-VIS spectrometer (Aquarius 7000, Optima, Tokyo, Japan), at room temperature, and are displayed in Figure 4. This figure reveals a broad spectral absorption range for the fluorescein solution between 328 nm and 530 nm. An increase in concentration, and thus an increase in the number of molecules per unit volume, enhances absorbance, which in turn affects the energy states, resulting in an elevation of both the linear absorbance index and refractive index, as well as a reduction in transmittance. These findings are consistent with the Beer–Lambert law [21].
Figure 5 depicts the linear absorbance spectra of thin films of Fluorescein dye at a concentration of 10 3 M, doped with PVA and Al 2 O 3 nanoparticles. The absorption peaks of the doped films show a redshift towards longer wavelengths compared to the pure dye. This shift can be attributed to changes in the electronic and vibrational states of interfacial molecules, leading to enhanced absorption across all nanocomposite samples. This is hypothesized to occur due to the excitation of electrons from the highest occupied molecular orbital (HOMO) to the lowest unoccupied molecular orbital (LUMO).
The linear refractive coefficient ( n o ) and linear absorption coefficient ( α o ) were calculated for all samples using Equations (1) and (2), respectively, as detailed in Table 2 and Table 3. The maximum absorption wavelength for fluorescein was identified at 497 nm.
Continuing the exploration of optical properties, Z-scan experiments were conducted using a continuous-wave (CW) diode solid-state laser operating at a wavelength of 457 nm and a power of 84 mW. The laser beam was focused through a lens with a 15 mm focal length. The experimental setup is diagrammatically represented in Figure 6. In the setup, a 1 mm wide optical cell containing a solution of mixed organic dyes in ethanol solvent at varying ratios was translated through the focal region along the axial direction, coinciding with the direction of the laser beam’s propagation.
The Z-scan technique is employed in two variants: the closed-aperture method, which is used to determine the nonlinear refractive coefficient ( n 2 ); and the open-aperture method, which ascertains the nonlinear absorption coefficient ( β ). In the closed-aperture configuration, the far-field intensity pattern is measured as a function of the sample’s position by observing the transmittance changes through a small aperture placed at the far-field location. By analyzing the transmittance variation with the Z-scan measurements, the third-order nonlinear refractive coefficient ( n 2 ) and the nonlinear absorption coefficient ( β ) were determined for all samples in ethanol solvent across different mixing ratios [21]. The Z-scan method is instrumental for quantifying the nonlinear optical properties of materials, specifically the nonlinear refractive index ( n 2 ) and the nonlinear absorption coefficient ( β ). It employs both open- and closed-aperture techniques to measure these parameters. The normalized transmittances from Z-scan measurements, plotted as a function of the sample’s position relative to the focal point, are illustrated for fluorescein dye in ethanol solvent in Figure 7, Figure 8, Figure 9 and Figure 10. The nonlinear effect region, as demonstrated in these figures, extends from 2 mm to 2 mm from the focal point.
The characteristic peak followed by a valley in the transmittance curve, derived from closed aperture Z-scan data, signifies a negative nonlinear refractive index ( n 2 < 0 ), indicative of self-defocusing phenomena within the sample [21], as depicted in Figure 8 and Figure 10. Conversely, open-aperture Z-scan data reveal different behaviors for solutions and thin films.
For fluorescein organic laser dye in solution, two-photon absorption phenomena are observed, as shown in Figure 9. In the case of thin films, the data indicate saturable absorption, which is presented in Figure 10.

5. Conclusions

In summary, the study has successfully elucidated the intricate optical properties of Fluorescein dye when doped with PVA polymer and Al 2 O 3 nanoparticles. The absorbance spectra and surface morphology, analyzed through UV-VIS spectrometry and AFM, respectively, have provided substantial insights into the material characteristics. Particularly, the Z-scan technique has proven to be a pivotal method for assessing the nonlinear optical parameters, revealing negative nonlinear refractive indices indicative of self-defocusing phenomena and distinguishing between two-photon and saturable absorption in solutions and thin films, respectively. These findings not only contribute to the existing body of knowledge regarding the nonlinear optical behavior of organic compounds but also pave the way for potential applications in optical devices where such properties are requisite. Future work may focus on exploring the influence of varying nanoparticle sizes and concentration ratios, aiming to fine-tune these optical properties for specific technological applications.

Author Contributions

Methodology and writing—original draft preparation, B.R.S.; investigation, B.A.N.; resources, B.A.N.; data curation, B.A.N.; writing—review and editing, B.A.N.; formal analysis, Z.N.S. All authors have read and agreed to the published version of the manuscript.

Funding

This research received no external funding.

Institutional Review Board Statement

Not applicable.

Informed Consent Statement

Not applicable.

Data Availability Statement

All the data used in the experiment have been made available in the present article.

Conflicts of Interest

The authors declare no conflicts of interest.

References

  1. Schäfer, F.P. Principles of Dye Laser Operation. In Dye Lasers; Springer: Berlin/Heidelberg, Germany, 2005; pp. 1–89. [Google Scholar]
  2. Arbeloa, F.L.; Arbeloa, T.L.; Arbeloa, I.L. Photophysical Properties of Laser Dyes: Correlations with the Lasing Characteristics. In Handbook of Advanced Electronic and Photonic Materials and Devices; Academic Press: San Diego, CA, USA, 2001; pp. 209–245. [Google Scholar]
  3. Rieger, R.; Müllen, K. Forever Young: Polycyclic Aromatic Hydrocarbons as Model Cases for Structural and Optical Studies. J. Phys. Org. Chem. 2010, 23, 315–325. [Google Scholar] [CrossRef]
  4. Duarte, F.J. Tunable Laser Optics; Elsevier Academic Press: New York, NY, USA, 2003. [Google Scholar]
  5. Abdulazeez, O.; Yassin, H.; Ban, A. Nonlinear Optical Properties of Pure and Dye Doped Nematic Liquid Crystals. Int. J. Chem. Sci. 2016, 4, 2601–2610. [Google Scholar]
  6. Ulrich, B. Laser Dyes, 3rd ed.; Lambda Physik AG: Göttingen, Germany, 2000. [Google Scholar]
  7. Aboud, L.H.; Shoja, S.J. Study Effect of Different Solvent Polarity on the Absorption and the Fluorescence Spectrum of Phenolphthalein Laser Dye. Acad. Res. Int. 2016, 7, 17–21. [Google Scholar]
  8. Wilson, B.C. Measurement of Tissue Optical Properties: Methods and Theories. In Optical-Thermal Response of Laser-Irradiated Tissue; Plenum Press: New York, NY, USA, 1995; pp. 233–303. [Google Scholar]
  9. Khan, M.U.; Khalid, M.; Ibrahim, M.; Braga, A.A.C.; Safdar, M.; Al-Saadi, A.A.; Janjua, M.R.S.A. First Theoretical Framework of Triphenylamine–Dicyanovinylene-Based Nonlinear Optical Dyes: Structural Modification of π-Linkers. J. Phys. Chem. C 2018, 122, 4009–4018. [Google Scholar] [CrossRef]
  10. Noor, A.; Ban, A.; Abdulazeez, O. Effect of Polarity of Solvents on Linear Optical Properties for Organic Dye. J. Phys. Conf. Ser. 2019, 1234, 012036. [Google Scholar]
  11. Wu, Z.; Chen, Z.; Du, X.; Logan, J.M.; Sippel, J.; Nikolou, M.; Kamaras, K.; Reynolds, J.R.; Tanner, D.B.; Hebard, A.F.; et al. Transparent, Conductive Carbon Nanotube Films. Science 2004, 305, 1273–1276. [Google Scholar] [CrossRef] [PubMed]
  12. Seth, D.; Chakrabarty, D.; Sarkar, N. Study of energy transfer from 7-amino coumarin donors to rhodamine 6G acceptor in non-aqueous reverse micelles. Chem. Phys. Lett. 2005, 401, 546–552. [Google Scholar] [CrossRef]
  13. Anwar, M.; Nadeem, F.; Faiz, S.; Alam, M. A Review of Synthesis of Fluorescein Based Advanced Materials. Int. J. Chem. Biochem. Sci. 2018, 14, 120–141. [Google Scholar]
  14. Cao, J.; Zhu, B.; Zheng, K.; He, S.; Meng, L.; Song, J.; Yang, H. Recent Progress in NIR-II Contrast Agent for Biological Imaging. Front. Bioeng. Biotechnol. 2020, 7, 487. [Google Scholar] [CrossRef] [PubMed]
  15. Schebesch, K.-M.; Brawanski, A.; Hohenberger, C.; Hohne, J. Fluorescein Sodium-Guided Surgery of Malignant Brain Tumors: History, Current Concepts, and Future Project. Turk. Neurosurg. 2016, 26, 185–194. [Google Scholar] [CrossRef]
  16. Prasad, M.; Ghosh, M.; Patki, H.S.; Kumar, S.; Brar, B.; Sindhu, N.; Goel, P.; Kaushik, S.; Mohan, H.; Syed, S.; et al. Imaging Techniques in Veterinary Disease Diagnosis. In Advances in Animal Disease Diagnosis; CRC Press: Boca Raton, FL, USA, 2021; pp. 103–145. [Google Scholar]
  17. Samundeeswari, S.; Kulkarni, M.; Yenagi, J.; Tonannavar, J. Fluorescence and solvatochromic study on 3-acyl coumarins. J. Fluoresc. 2017, 27, 1247–1255. [Google Scholar] [CrossRef] [PubMed]
  18. Andreia, F. Nonlinear Optical Properties of Liquid Crystals Probed by Z-Scan Technique. Braz. J. Phys. 2003, 33, 813–820. [Google Scholar]
  19. Hiremath, A.; Thipperudrappa, S.; Bhat, R. Surface Morphology Analysis Using Atomic Force Microscopy and Statistical Method for Glass Fiber Reinforced Epoxy-Zinc Oxide Nanocomposites. Engineered Sci. 2022, 18, 308–319. [Google Scholar] [CrossRef]
  20. Naik, N.; Bhat, R.; Shivamurthy, B.; Shetty, R.; Parashar, P.R.; Hegde, A.L. Statistical and Artificial Neural Network Coupled Technique for Prediction of Tribo-Performance in Amine-Cured Bio-Based Epoxy/MMT Nanocomposites. J. Compos. Sci. 2023, 7, 372. [Google Scholar] [CrossRef]
  21. Noor, A.; Ban, A.; Abdulazeez, O. Spectral and Linear Optical Characterization of Rhodamine B and Fluorescein Sodium Organic Laser Dyes Mixture Solutions. Iraqi J. Sci. 2019, 60, 69–74. [Google Scholar]
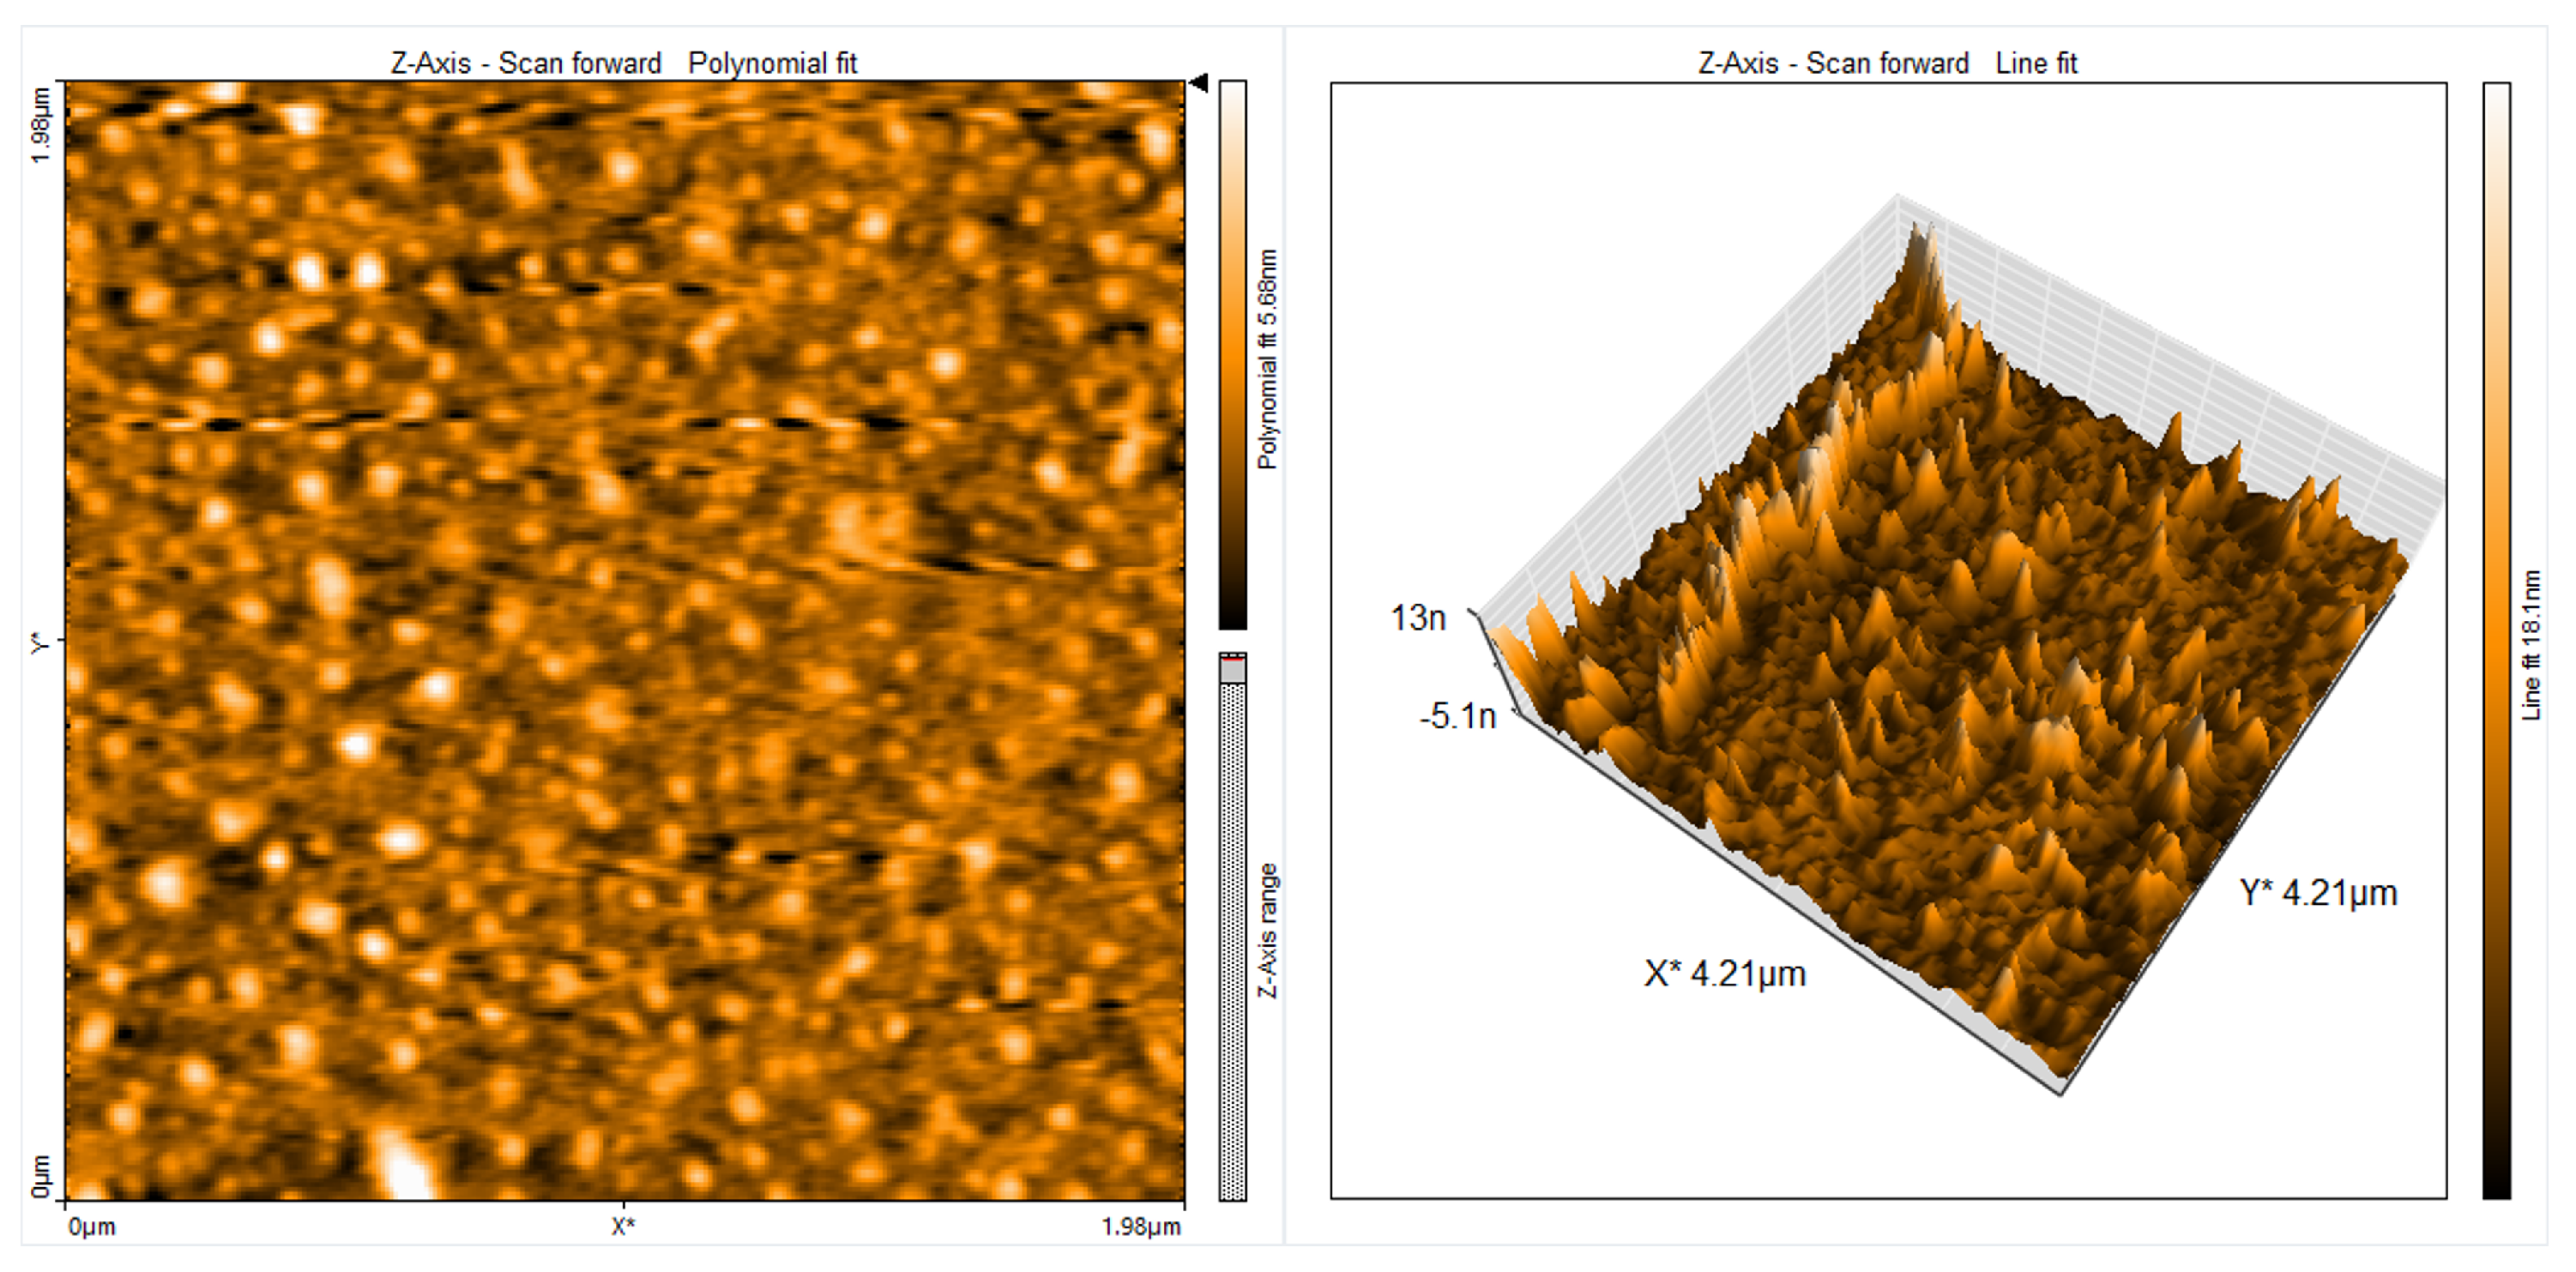
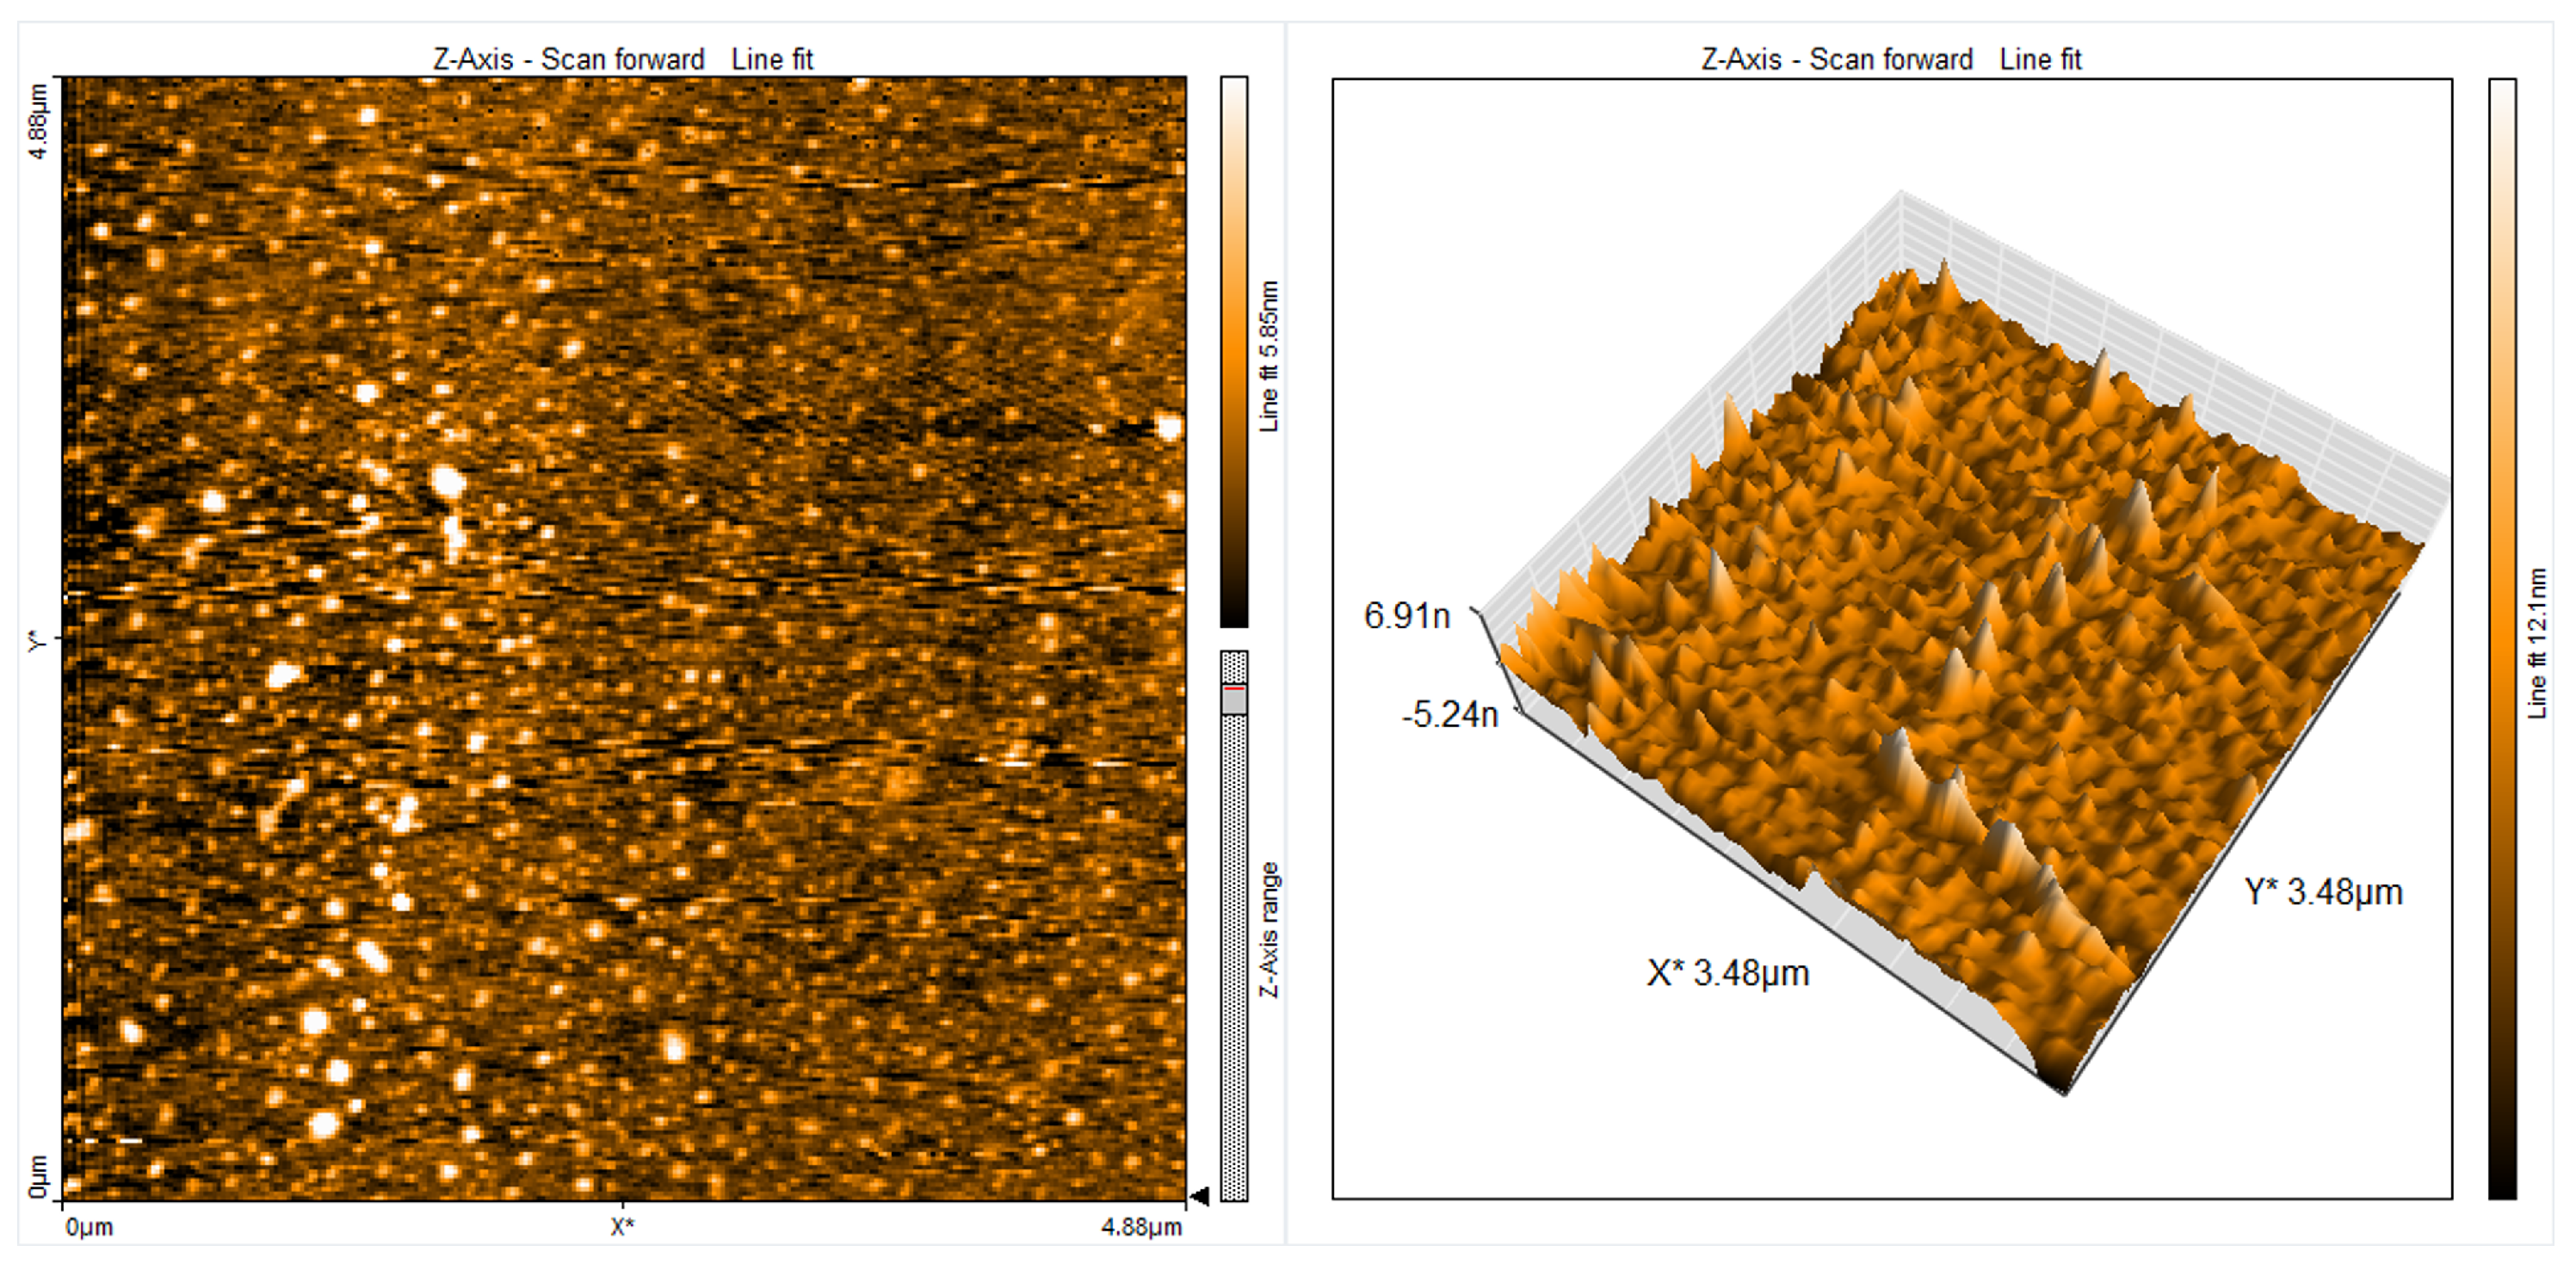
Figure 1. Molecular structure of fluorescein organic dye.
Engproc 59 00141 g001
Figure 2. Two-dimensional and three-dimensional AFM images for thin films of fluorescein dye doped with PVA polymer.
Engproc 59 00141 g002
Figure 3. Two-dimensional and three-dimensional AFM images for thin films of Fluorescein doped with PVA polymer and Al 2 O 3 NPs.
Engproc 59 00141 g003
Figure 4. Absorbance spectra for fluorescein dye at different concentrations in ethanol solvent.
Engproc 59 00141 g004
Figure 5. The absorbance spectrum for thin film of fluorescein organic laser dye doped with PVA polymer and (Al 2 O 3 ) NPs.
Engproc 59 00141 g005
Figure 6. (a) Closed-aperture Z-scan; (b) open-aperture Z-scan [21].
Engproc 59 00141 g006
Figure 7. Closed-aperture Z-scan data for different concentrations of fluorescein organic laser dye in ethanol solvent.
Engproc 59 00141 g007
Figure 8. Open-aperture Z-scan data for different concentrations of fluorescein organic laser dye in ethanol solvent.
Engproc 59 00141 g008
Figure 9. Closed-aperture Z-scan data for thin films of fluorescein organic laser dye doped with PVA polymer and (Al 2 O 3 ) NPs.
Engproc 59 00141 g009
Figure 10. Open-aperture Z-scan data for thin films of fluorescein organic laser dye doped with PVA polymer and (Al 2 O 3 ) NPs.
Engproc 59 00141 g010
Table 1. AFM parameters for fluorescein doping with PVA polymer and Al 2 O 3 NPs.
Materialr.m.s (nm)Roughness (nm)Average Grain Size (nm)Thickness (nm)
FL+PVA polymer8.6885.55251146
FL+PVA polymer + Al 2 O 3 NPs9.2116.66459155
Table 2. Materials and their respective concentrations.
MaterialConcentration (Mol/L)
Fluorescein (solutions) 1 × 10 5
Fluorescein (solutions) 3 × 10 5
Fluorescein (solutions) 5 × 10 5
Fluorescein (solutions) 7 × 10 5
FL+PVA polymer (thin films) 1 × 10 3
FL+PVA polymer + Al 2 O 3 NPs (Thin films) 1 × 10 3
Table 3. Optical parameters for different materials at λ = 457 nm.
MaterialT α o (cm 1 ) n o Δ TP V n 2 (cm 2 /mW) β (cm/mW)
Fluorescein (solutions)0.80160.22101.29310.0277 3.5016 × 10 11 1.2947
Fluorescein (solutions)0.71940.32931.49550.0361 5.5024 × 10 11 1.4198
Fluorescein (solutions)0.57600.55151.78490.0416 7.6834 × 10 11 1.5068
Fluorescein (solutions)0.47140.75191.92160.0527 8.5168 × 10 11 1.6264
FL+PVA polymer (thin films)0.67486396.331.16520.132 2.91 × 10 7 2.023
FL+PVA polymer + Al 2 O 3 NPs (thin films)0.64026806.971.18520.154 3.89 × 10 7 3.765
Disclaimer/Publisher’s Note: The statements, opinions and data contained in all publications are solely those of the individual author(s) and contributor(s) and not of MDPI and/or the editor(s). MDPI and/or the editor(s) disclaim responsibility for any injury to people or property resulting from any ideas, methods, instructions or products referred to in the content.

