
Prediction Model for Preoperative Diagnosis of Ovarian Cancer Using Tumor Markers, CBC, and LFT †


Abstract
:1. Introduction
2. Methods
3. Results
3.1. Logistic Regression Analysis: Tumor Marker Group
3.2. Logistic Regression Analysis: CBC Group
3.3. Logistic Regression Analysis: LFT Group
4. Discussion and Conclusions
Author Contributions
Funding
Institutional Review Board Statement
Informed Consent Statement
Data Availability Statement
Acknowledgments
Conflicts of Interest
References
- Sung, H.; Ferlay, J.; Siegel, R.L.; Laversanne, M.; Soerjomataram, I.; Jemal, A. Global cancer statistics 2020: GLOBOCAN estimates of incidence and mortality worldwide for 36 cancers in 185 countries. CA Cancer J. Clin. 2021, 209–249. [Google Scholar] [CrossRef] [PubMed]
- Chirdchim, W.; Wanichsetakul, P.; Phinyo, P. Development and Validation of a Predictive Score for Preoperative Diagnosis of Early Stage Epithelial Ovarian Cancer. Asian Pac. J. Cancer Prev. 2019, 20, 1207–1213. [Google Scholar] [CrossRef] [PubMed]
- Jacobs, I.; Oram, D.; Fairbanks, J.; Turner, J.; Frost, C.; Grudzinskas, J.G. A risk of malignancy index incorporating CA 125, ultrasound and menopausal status for the accurate preoperative diagnosis of ovarian cancer. Br. J. Obstet. Gynaecol. 1990, 97, 922–929. [Google Scholar] [CrossRef] [PubMed]
- Moore, R.G.; McMeekin, D.S.; Brown, A.K.; DiSilvestro, P.; Miller, M.C.; Allard, W.J.; Gajewski, W.; Kurman, R.; Bast, R.C.; Skates, S.J. A novel multiple marker bioassay utilizing HE4 and CA125 for the prediction of ovarian cancer in patients with a pelvic mass. Gynecol. Oncol. 2009, 112, 40–46. [Google Scholar] [CrossRef] [PubMed]
- Data for: Using Machine Learning to Predict Ovarian Cancer. Available online: https://data.mendeley.com/datasets/th7fztbrv9/11 (accessed on 23 October 2020).
- Pepe, M.S. The Statistical Evaluation of Medical Tests for Classification and Prediction; Oxford University Press: Oxford, UK, 2003. [Google Scholar]

| Parameter | Details |
|---|---|
| Menopausal status | |
| HE4 | Level of human epididymis protein 4 |
| CA19-9 | Level of carbohydrate antigen 19-9 |
| Parameter | Coefficient | OR | 95% CL | p-Value |
|---|---|---|---|---|
| Menopausal status | 0.623 | 1.865 | 0.682–5.104 | 0.225 |
| HE4 | 0.056 | 1.058 | 1.030–1.086 | <0.001 |
| CA19-9 | 0.008 | 1.008 | 1.000–1.015 | 0.051 |
| Constant | −3.867 | 0.021 | <0.001 |
| Parameters | Details |
|---|---|
| Menopausal status | |
| BASO | Basophil cell ratio |
| LYM | Amount of lymphocyte |
| Parameter | Coefficient | OR | 95% CL | p-Value |
|---|---|---|---|---|
| Menopausal status | 1.870 | 6.48 | 0.682–14.018 | <0.001 |
| BASO | −1.020 | 0.361 | 0.143–0.911 | 0.031 |
| LYM | −1.283 | 0.277 | 1.000–1.015 | <0.001 |
| Constant | 2.395 | 10.698 | <0.001 |
| Parameters | Details |
|---|---|
| Menopausal status | |
| ALB | The amount of albumin |
| ALP | The amount of alkaline phosphatase |
| IBIL | The amount of indirect bilirubin |
| Parameter | Coefficient | OR | 95% CL | p-Value |
|---|---|---|---|---|
| Menopausal status | 1.919 | 6.813 | 3.057–15.182 | <0.001 |
| ALB | −0.093 | 0.911 | 0.848–0.979 | 0.011 |
| ALP | 0.020 | 1.021 | 1.005–1.037 | 0.011 |
| IBIL | −0.116 | 0.890 | 0.769–1.030 | 0.119 |
| Constant | 2.606 | 13.543 | 0.089 |
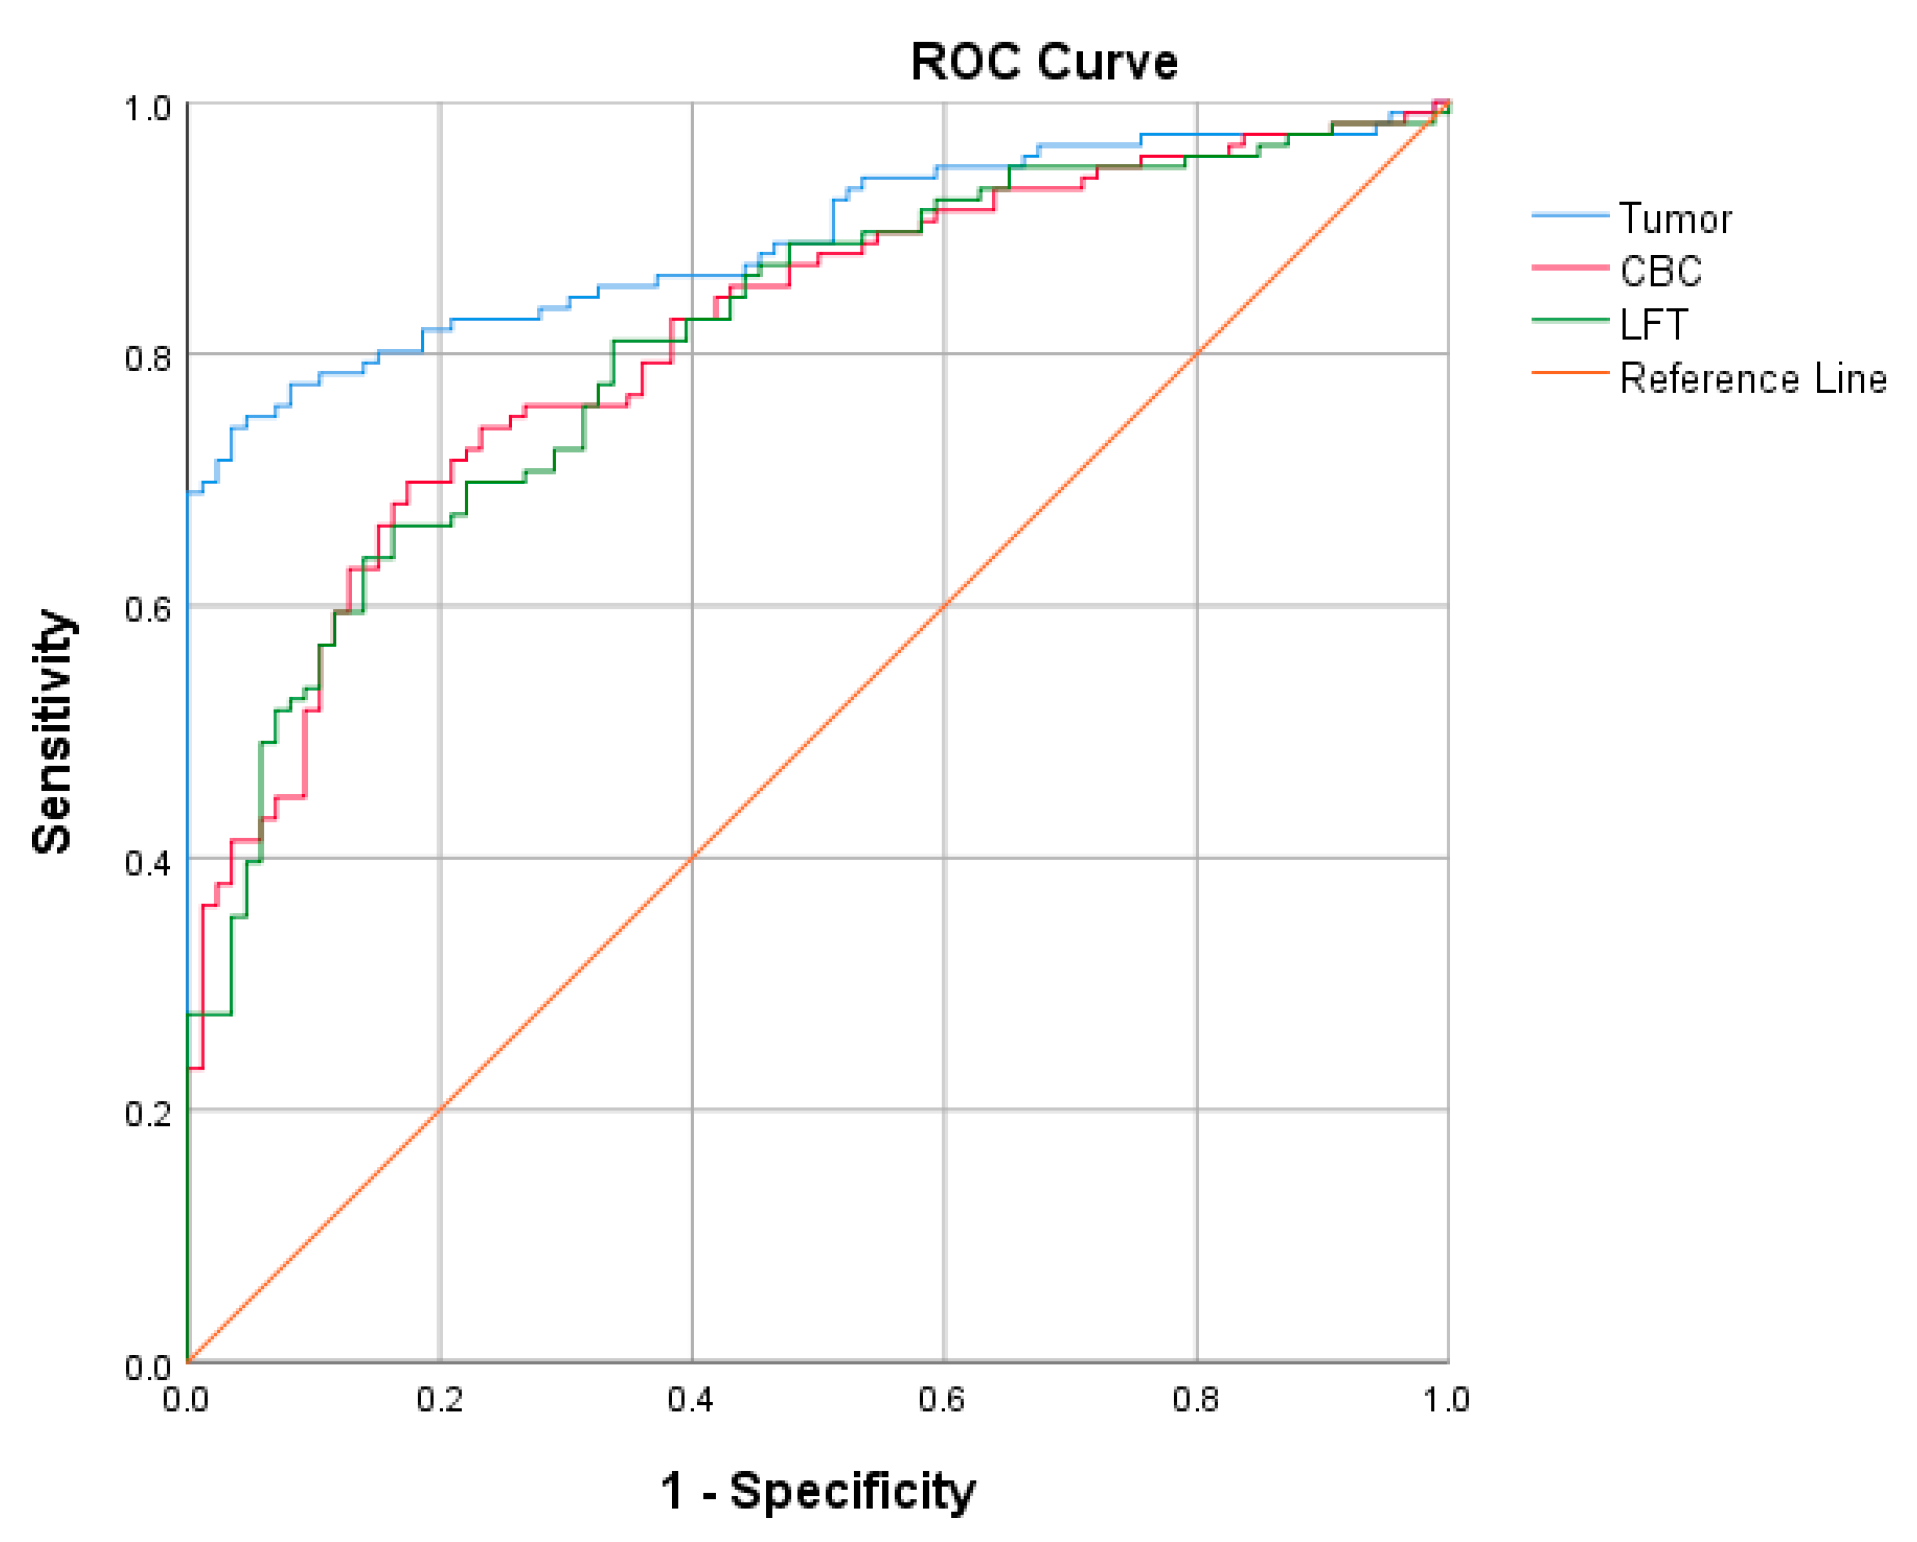
| Model | Hosmer and Lemeshow | AUROCC | 95% CI |
|---|---|---|---|
| Tumor marker group | Appropriate | 0.890 | 0.845–0.935 |
| CBC group | Appropriate | 0.813 | 0.755–0.871 |
| LFT group | Appropriate | 0.810 | 0.751–0.868 |
Disclaimer/Publisher’s Note: The statements, opinions and data contained in all publications are solely those of the individual author(s) and contributor(s) and not of MDPI and/or the editor(s). MDPI and/or the editor(s) disclaim responsibility for any injury to people or property resulting from any ideas, methods, instructions or products referred to in the content. |
© 2023 by the authors. Licensee MDPI, Basel, Switzerland. This article is an open access article distributed under the terms and conditions of the Creative Commons Attribution (CC BY) license (https://creativecommons.org/licenses/by/4.0/).
Share and Cite
Tongyib, S.; Saleewong, T. Prediction Model for Preoperative Diagnosis of Ovarian Cancer Using Tumor Markers, CBC, and LFT. Eng. Proc. 2023, 55, 54. https://doi.org/10.3390/engproc2023055054
Tongyib S, Saleewong T. Prediction Model for Preoperative Diagnosis of Ovarian Cancer Using Tumor Markers, CBC, and LFT. Engineering Proceedings. 2023; 55(1):54. https://doi.org/10.3390/engproc2023055054
Chicago/Turabian StyleTongyib, Sorawit, and Teerapol Saleewong. 2023. "Prediction Model for Preoperative Diagnosis of Ovarian Cancer Using Tumor Markers, CBC, and LFT" Engineering Proceedings 55, no. 1: 54. https://doi.org/10.3390/engproc2023055054
APA StyleTongyib, S., & Saleewong, T. (2023). Prediction Model for Preoperative Diagnosis of Ovarian Cancer Using Tumor Markers, CBC, and LFT. Engineering Proceedings, 55(1), 54. https://doi.org/10.3390/engproc2023055054