Abstract
The paper describes the development of a machine learning-based system to predict the performance of EGNOS. The system is shown to perform considerably better than existing simple geometry-based ‘macro’ models developed for the same purpose in the past.
1. Introduction
The European Geostationary Navigation Overlay Service (EGNOS) is a European satellite-based augmentation system (SBAS) that improves the performance of GPS by providing range corrections and protection levels as upper bounds of the position errors. It has been deployed to provide safety of life navigation services to aviation, maritime, and land-based users over most of Europe.
In aviation, pilots have, for two decades, been required to confirm that the (predicted) GPS protection levels will be sufficient to support their operations. For EGNOS, performance prediction could be equally valuable for aviation and other user communities, both from a safety and an economic standpoint. Prediction capabilities can, for example, be integrated in flight-planning services but can also serve as part of an EGNOS simulation service, for example to investigate the performance impact of changes in the EGNOS infrastructure or in the core GNSS constellations.
A decade ago, the European Organisation for the Safety of Air Navigation (EUROCONTROL) developed an EGNOS performance prediction tool (‘EURONOTAM’) to provide a similar prediction for EGNOS-based operations, based on a simplified so-called ‘meta model’ with a limited accuracy [1]. The advent of machine-learning techniques allows EGNOS performance prediction to be predicted more accurately by moving away from the simplified macro-model (which is based largely on satellite and EGNOS reference station (RIMS) network geometries only) and incorporating other factors that are known to impact performance. This has, for example, been performed in [2], which uses a similar approach to ours, but with significant differences, for example, in terms of the selected feature sets and the algorithms used.
Funded by the European Space Agency under a NAVISP contract, we have implemented an EGNOS performance prediction system that employs state-of-the-art machine-learning techniques to forecast EGNOS performance using a wide variety of parameters, including weather and space-weather. As we will show, our prediction system yields significantly more accurate predictions than the currently employed macro models, which is not unexpected as the approach in [2] already yielded similar outcomes. Note that at the time of writing, the project was still ongoing and the reported results reflect the minimum achievable performance.
2. EGNOS Performance Prediction
2.1. The EGNOS System
EGNOS improves the performance of GPS L1 signal accuracy by providing range corrections and associated quality metrics to achieve the required level of reliability for Safety of Life applications. To do so, it provides users with protection levels as upper bounds of their position errors. The current version of EGNOS is called EGNOS v2 and has been declared ‘Safety of Life’ capable since 2011. Since then, several EGNOS v2 releases have been deployed to improve the EGNOS service. The next version of EGNOS called EGNOS v3 is under development and will provide Dual-Frequency Multi Constellation (DFMC) services by augmenting GPS L1/L5 and Galileo E1/E5a signals to enable more demanding service levels beyond what EGNOS v2 can provide. The work presented in this paper addresses EGNOS v2 and not EGNOS v3.
EGNOS v2 uses L1C/A and L2P(Y) GPS measurements, collected by accurately located reference stations (RIMS) deployed across Europe and remotely. All GPS measurements are transferred to a central computing centre hosting the Central Processing Facility (CPF), which runs the navigation algorithms to calculate differential corrections and integrity messages are calculated. Two types of corrections are provided: corrections for satellite orbit and clock errors, and corrections for ionospheric delays. Consequently, two types of integrity indicators are provided:
- The User Differential Range Error Index (UDREI). An integer in the range [0–15], which characterizes the residual range errors due to orbit and clock inaccuracies after applying the clock and orbit corrections. Below index 13, a lower UDREI value means that the GPS signal is more accurate, while a higher UDRE value means that there is a greater chance of error in the GPS signal. When the satellite is not observed by sufficient RIMS, a UDREI value of 14 is broadcast to indicate that the satellite is Not Monitored, while a UDREI value of 15 indicates that the satellite is not to be used by the users (Do Not Use status as per MOPS) because a problem has been detected on this satellite (for example, the presence of a failure);
- The Grid Ionospheric Vertical Error Index (GIVEI), an integer in the range [0–15], which characterizes the residual error of the ionospheric delays after application of the ionospheric corrections. As for the UDREI, The lower the GIVEI value, the more accurate the ionosphere corrections and vertical position measurement from the GNSS signal.
These corrections and integrity indicators are broadcast to users using geostationary satellites that serve as an augmentation to the original GPS signals [3]. Over the period considered in this paper, between 34 and 38 Reference and Integrity Monitoring Stations (RIMS) were deployed to monitor the GPS constellation. This number varies because of new RIMS deployments or RIMS decommissioning over the last decade.
2.2. EGNOS Outputs
Users of EGNOS use the additional information to improve their positioning accuracy by applying the corrections and excluding Not Monitored or Do Not Use satellite measurements. In addition, they can use the GIVEI and UDREI to compute horizontal and vertical protection levels (HPLs and VPLs) that can be seen as a measure of the integrity of their position [4]. Protection levels can be seen as upper bounds to the position error and are typically expressed as a distance, such as a radius, within which the actual position of the user is expected to be located with a high level of probability. The size of the protection levels thus characterizes the overall EGNOS performance.
The protection levels are updated regularly based on the GIVE and UDRE values received from the EGNOS system. Users can determine in real-time whether their operational needs are met based on the protection levels, which should be sufficiently low to allow for specific safe operations.
The prediction of the protection levels in the future (in the next one or two days) thus serve the purpose of allowing for users to anticipate whether EGNOS will provide sufficient performance. This prediction can be particularly interesting in the case of planed operations (satellite decommissioning, satellite maneuvers, RIMS reparation, etc.) that may impact the performance of EGNOS over a specific area.
To predict protection levels, it is required to predict what values of the UDREI and GIVEI will be broadcast by EGNOS. Based on these predicted values, as well as the predicted satellite positions, predicted protection levels can be obtained as a function of time and user location. The GPS satellite positions can simply be computed from the GPS almanacs published by the U.S. Coast Guard. With the most recent almanac, the satellite positions can be determined quite accurately and predicted for the next few days. Hence, the remainder of this paper only focuses on the prediction of the UDREI and GIVEI values, which can benefit from machine learning (ML) using a variety of inputs.
3. EGNOS Performance Prediction
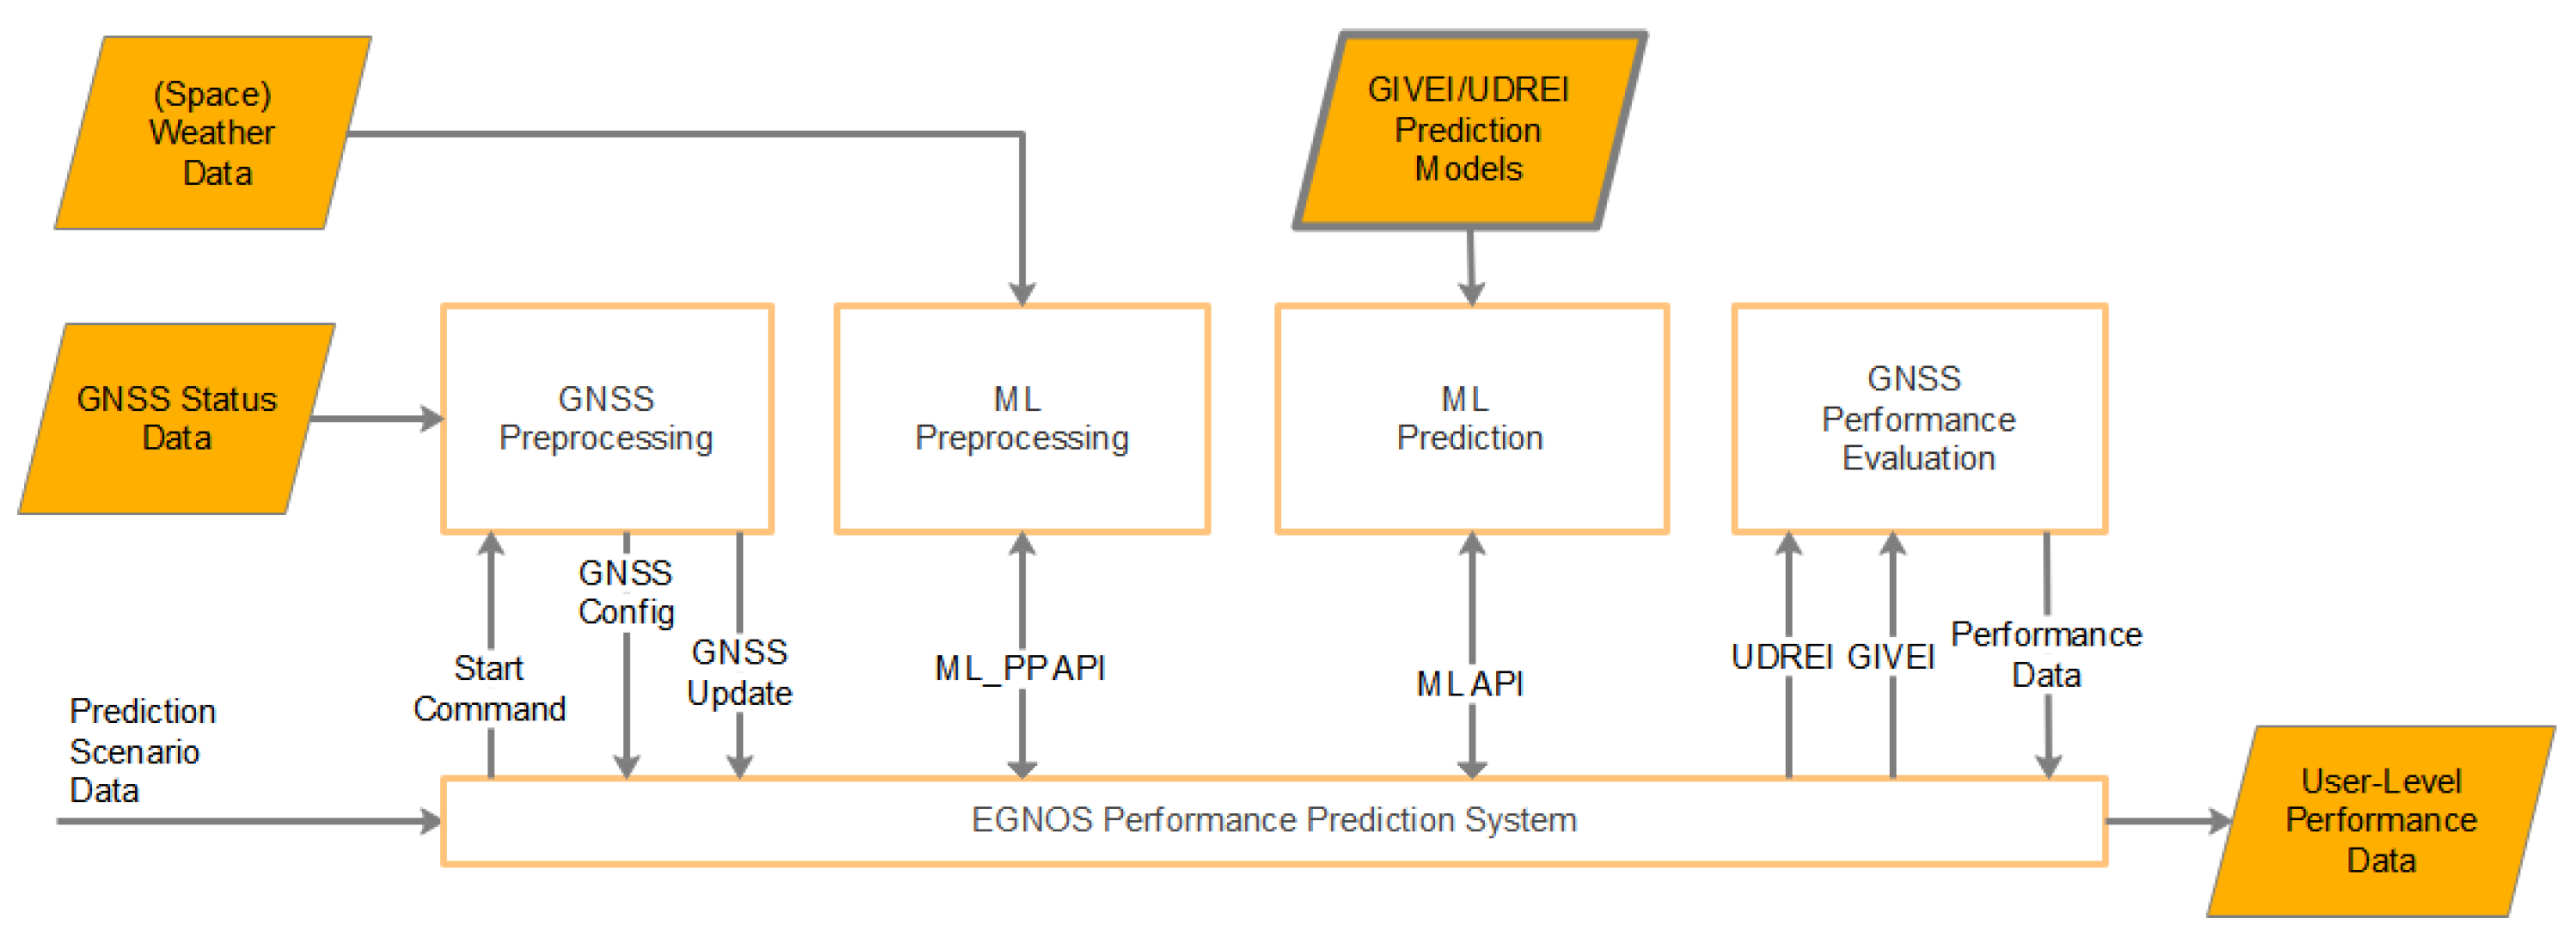
Predicted EGNOS performance relies on predicting the UDREI and GIVEI values as computed by the EGNOS ground segment’s processing facilities. These are complicated data processors of which only some characteristics are public [5,6], while many implementation details are proprietary. Prediction models thus need to mimic the internal workings of the ground segment’s processing, as well as consider the expected status of the GPS space segment and the expected signal reception conditions to the extent possible. An overview of a prediction system’s architecture is shown in Figure 1.

Figure 1.
The operational EGNOS Performance Prediction system uses trained GIVEI and UDREI prediction models in combination with preprocessed GNSS and (space)weather data to produce predicted UDREI and GIVEI timeseries. These are then translated into the user-level performance indicators such as protection levels and EGNOS availability for the user’s operations.
The Use of Macro Models
Several macro models are in use to predict EGNOS performance. We used a proprietary macro model provided to us by the ESA to compare our results against. The European Satellite Services Provider (ESSP) also employs a (proprietary) macro model [2], which possibly builds on the model from [1]. Finally, our partner Iguassu employs a macro-model in their SBAS simulator [7]. These models mainly rely on satellite and ground segment geometry, and a simple relation (e.g., in the form of tables) with the UDREI and GIVEI to the set of RIMS stations tracking the satellites and the set of ionospheric piercing points (IPPs) around the ionospheric grid point (IGP) to which the GIVEI relates. Due to their simplicity, these models are easy to implement and fast to run. Their simplicity is expected to limit their performance, and we would expect that machine learning can improve prediction performance considerably.
4. Machine Learning Approach
We followed an agile CRISP-DM method to find the best models with the best hyper parameters, by starting with simple models and then gradually increasing the number of features and the model’s complexity. The key components of CRISP DM-based agile holistic machine learning approach include the following steps:
- The Domain and Data Understanding step involves gaining understanding of the EGNOS performance prediction problem. See also Section 5.1 below;
- The Data Collection and Preprocessing step gathers relevant data for the problem domain and preparing it for use in a machine learning model by cleaning the data and transforming them into a suitable format, see also Section 5.1;
- Feature Engineering is then performed by selecting relevant input features that are expected to help the machine learning model make accurate predictions. See also Section 5.2;
- Model Selection and Training involves selecting an appropriate machine learning algorithm and optimizing its parameters to achieve the best performance on the training data. More information is found in Section 5.3;
- Evaluation: once a model has been trained, it needs to be evaluated on a separate testing set to determine its performance. More information is found in Section 5.4;
- Deployment: the trained model is finally deployed in a production environment and monitored to ensure that it continues to perform well over time.
5. Machine Learning-Based Performance Prediction for EGNOS
Supervised machine learning is exploited to build three separate models: one to predict the UDREI, and two to predict the GIVEI models under nominal and active ionospheric conditions, respectively, as in the latter case the ionospheric corrections are known to be less accurate and higher GIVEI values can be expected. The use of two different GIVEI models allows for assessment of the expected performance of EGNOS under different ionospheric conditions. It is left up to the users to use one model or the other, depending on their assessment of the likelihood and potential impact of ionospheric storms. In the remainder of this paper, only the nominal model is considered. The nominal model is also expected to provide valid results in case of strong ionosphere since the machine learning modules have been trained during active ionosphere periods, and features related to the ionosphere activity are known by the machine learning modules.
5.1. Machine Learning Labels
To train our models, we have used data from the EGNOS Data Access Service (EDAS) offers free access to historical EGNOS data from 2013 up to the current day, including the ephemerides and range measurements collected by the RIMS, as well as the EGNOS messages that were broadcast. The latter contain the UDREI and GIVEI timeseries (labels) which the (supervised) machine learning can use to train models targeted at reproducing these labels.
Investigations of the data showed that UDREI values of 11 and 12 were hardly ever broadcast. Hence, even though we had many years of historical broadcast data available, there were insufficient cases to train the machine learning effectively. We therefore decided to define a single class to represent UDREI values of 11, 12 and 14.
5.2. Selecting Machine Learning Features
The first step in any machine learning-based model development is the careful selection of the input data features that will drive these models. Ideally, the data should contain all information that is available to the EGNOS system when it is in operation. However, there are some limitations, as the features need to be available for the period for which to predict. As a result, unpredictable quantities or events (such as the raw RIMS observations of the unexpected occurrences of faults in satellites or RIMS) cannot be incorporated.
Important factors in determining the UDREI and GIVEI that can be predicted are the quality of the range measurements, as well as geometric aspects which impact the observability of satellite orbit and clock errors or ionospheric delays.
For UDREI prediction, the following features have been selected:
- A list of locations of the RIMS tracking the satellite;
- Satellite position;
- Geometry metrics, such as DOP, number of RIMS in view;
- Elevation-dependent multipath variances;
- Weather indicators (from OpenWeather);
- Local space-weather indicators, including vertical TEC values and its gradients over time and space (IONEX files from CDDIS and CODE);
- Satellite and satellite clock generation.
For GIVEI, the following features have been selected:
- IGP location;
- A list of IPP locations of IPP near the IGP;
- Elevation-dependent multipath variances;
- Satellite positions.
- Satellite block and satellite clock generation;
- Global space-weather indicators (from the NOAA Space Weather Prediction Center, Space Weather Canada, GFZ German Research Centre for Geosciences, Royal Observatory of Belgium);
- Local space-weather indicators (as for UDREI).
To train our models, we obtained most feature data, as well as UDREI and GIVEI labels from EDAS. For actual predictions, the machine learning model can use forecasted equivalents, based on GPS almanacs and weather and space-weather predictions.
5.3. Algorithm Selection and Training
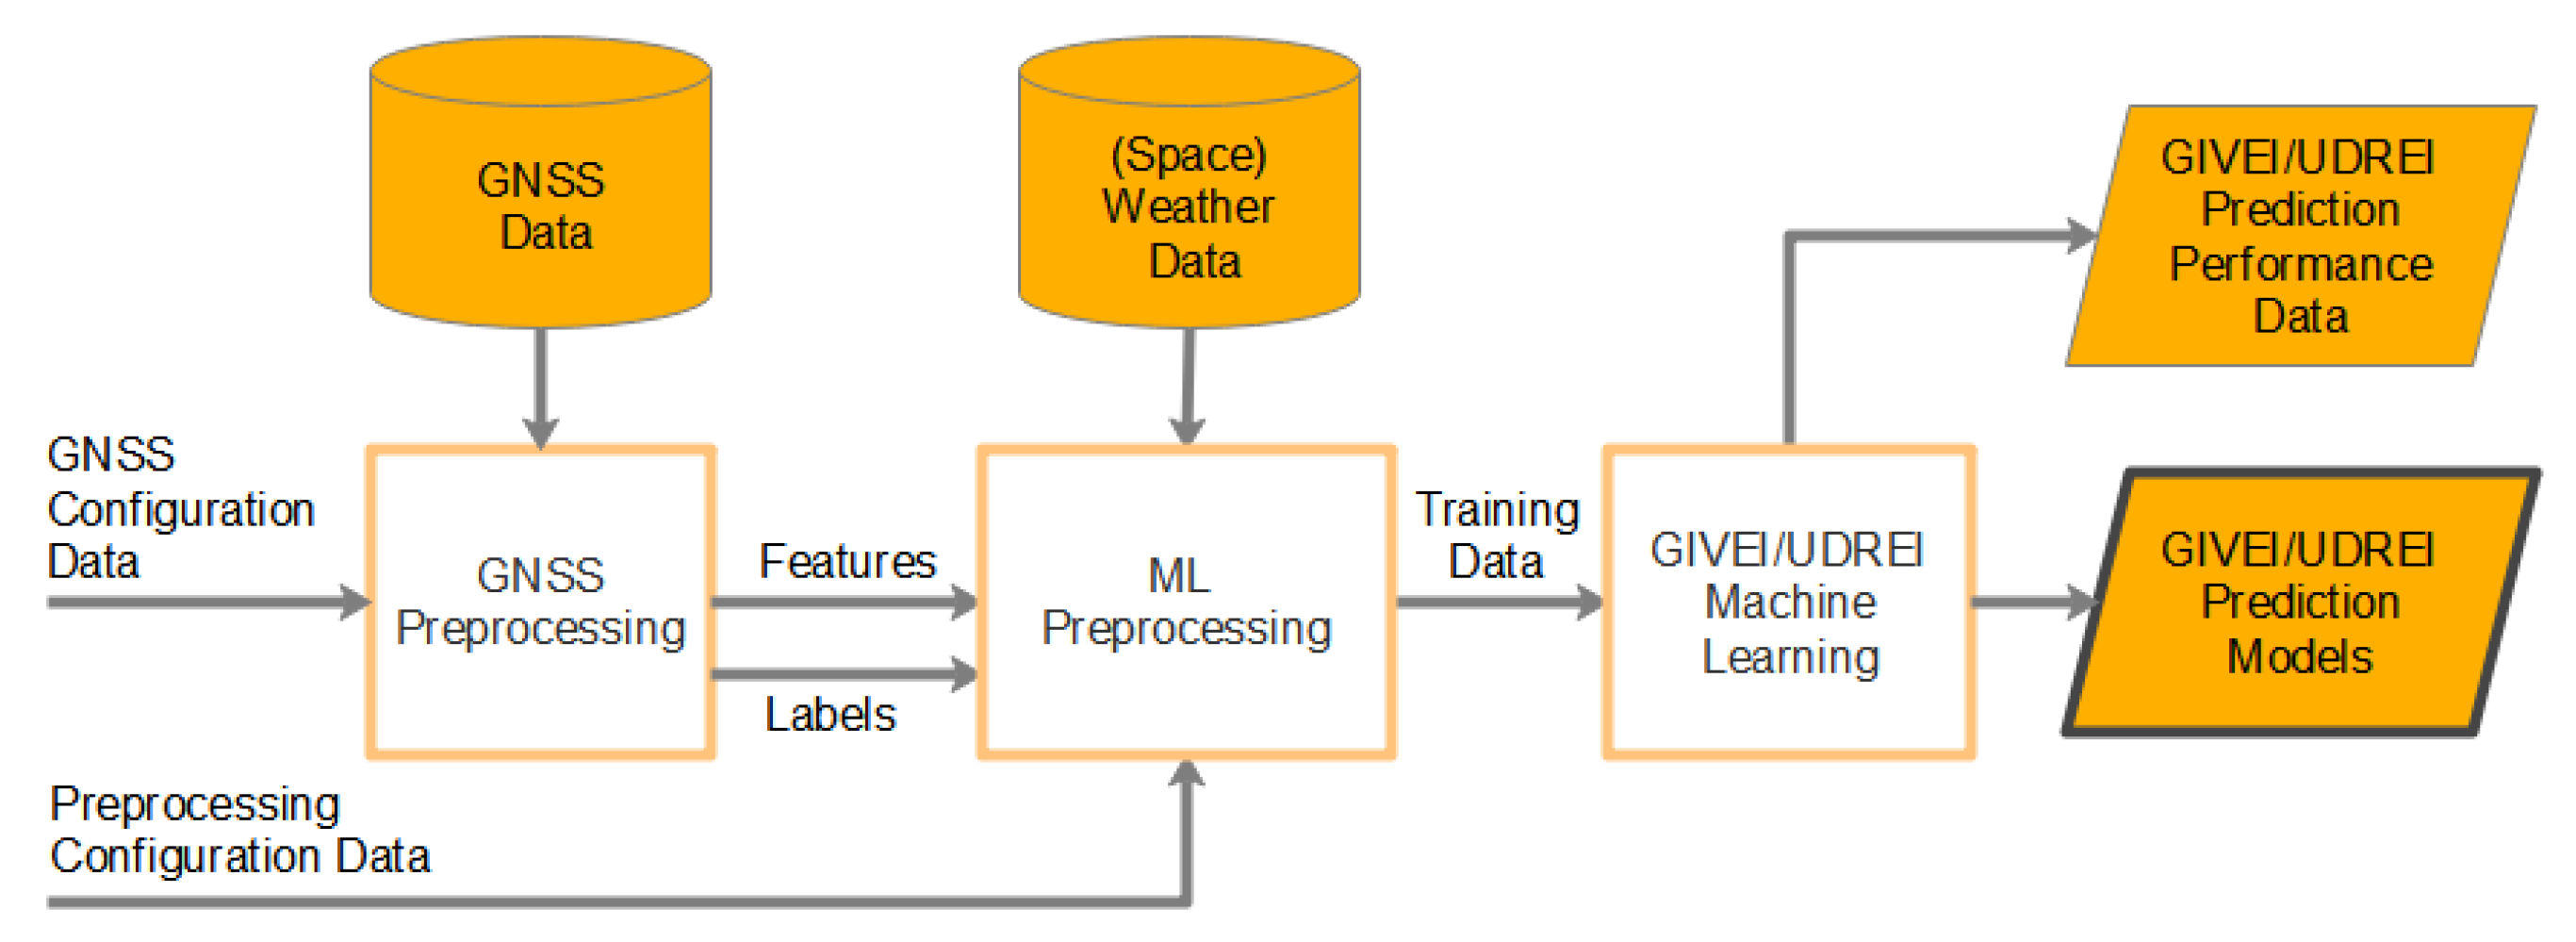
Figure 2 shows the training process, for which we used over five years of data. The features (preprocessed historical GNSS and (space)weather data) were used in conjunction with the labels (historical UDREI and GIVEI broadcast values) to train different prediction algorithms, of which the best performing one was eventually selected for the product to be developed in the frame of this project.
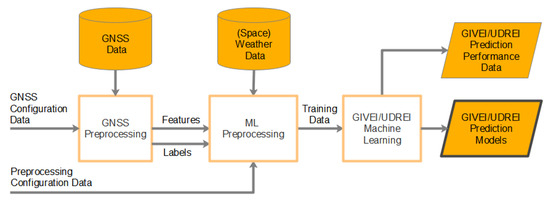
Figure 2.
The training process. GNSS and (space)weather data are gathered and pre-processed before being fed to the training module. The training produces both GIVEI and UDREI prediction models that will become part of the operational prediction system and related performance data.
Machine learning algorithms are quickly evolving and there is an obvious ‘best’ algorithm for predicting the UDREI and GIVEI values based on our selected input features. Both UDREI and GIVEI values are categorical labels representing a given (discrete) class, the prediction of which can be based on regression, time-series, and classification algorithms. Because the ‘unmonitored’ UDREI and GIVEI values are assigned based on special rules, regression algorithms were deemed inappropriate. Similarly, the use of time-series was excluded due to the impact of sudden changes in geometry when satellites go in- and out of view of the RIMS stations. We therefore decided to focus only on multiclass classification algorithms. The multiclass classification problem type narrowed down the potential algorithms that are applied as part of best practices.
There are two main approaches for classification: decision tree-based methods and (deep) neural network-based algorithms. We tested both types of algorithms, as well as mixed architectures running deep-learning models, and ended up trying the following algorithms: decision tree, gradient boosted decision trees, XGBoost, LightGBM, CatBoost, CNN and CNN + MLP. For the deep-learning models, which were tried for GIVEI only, we have tested multiple values for number of layers, number of units per layer, pool types, padding, momentum, learning rates, optimizers, and architectures.
For both GIVEI and UDREI, the decision tree algorithms were fast to train, but their accuracy figures are not impressive. LightGBM provided the best performance overall and an acceptable training time and therefore was the algorithm we ended up using for both UDREI and GIVEI prediction. Catboost, XGBoost, and deep-learning methods also provided acceptable performances and training times. The LightGBM models were eventually trained using over 5 years of training data, which were subsampled to provide 50,000 examples of each UDREI and GIVEI outcome.
5.4. Performance Evaluation
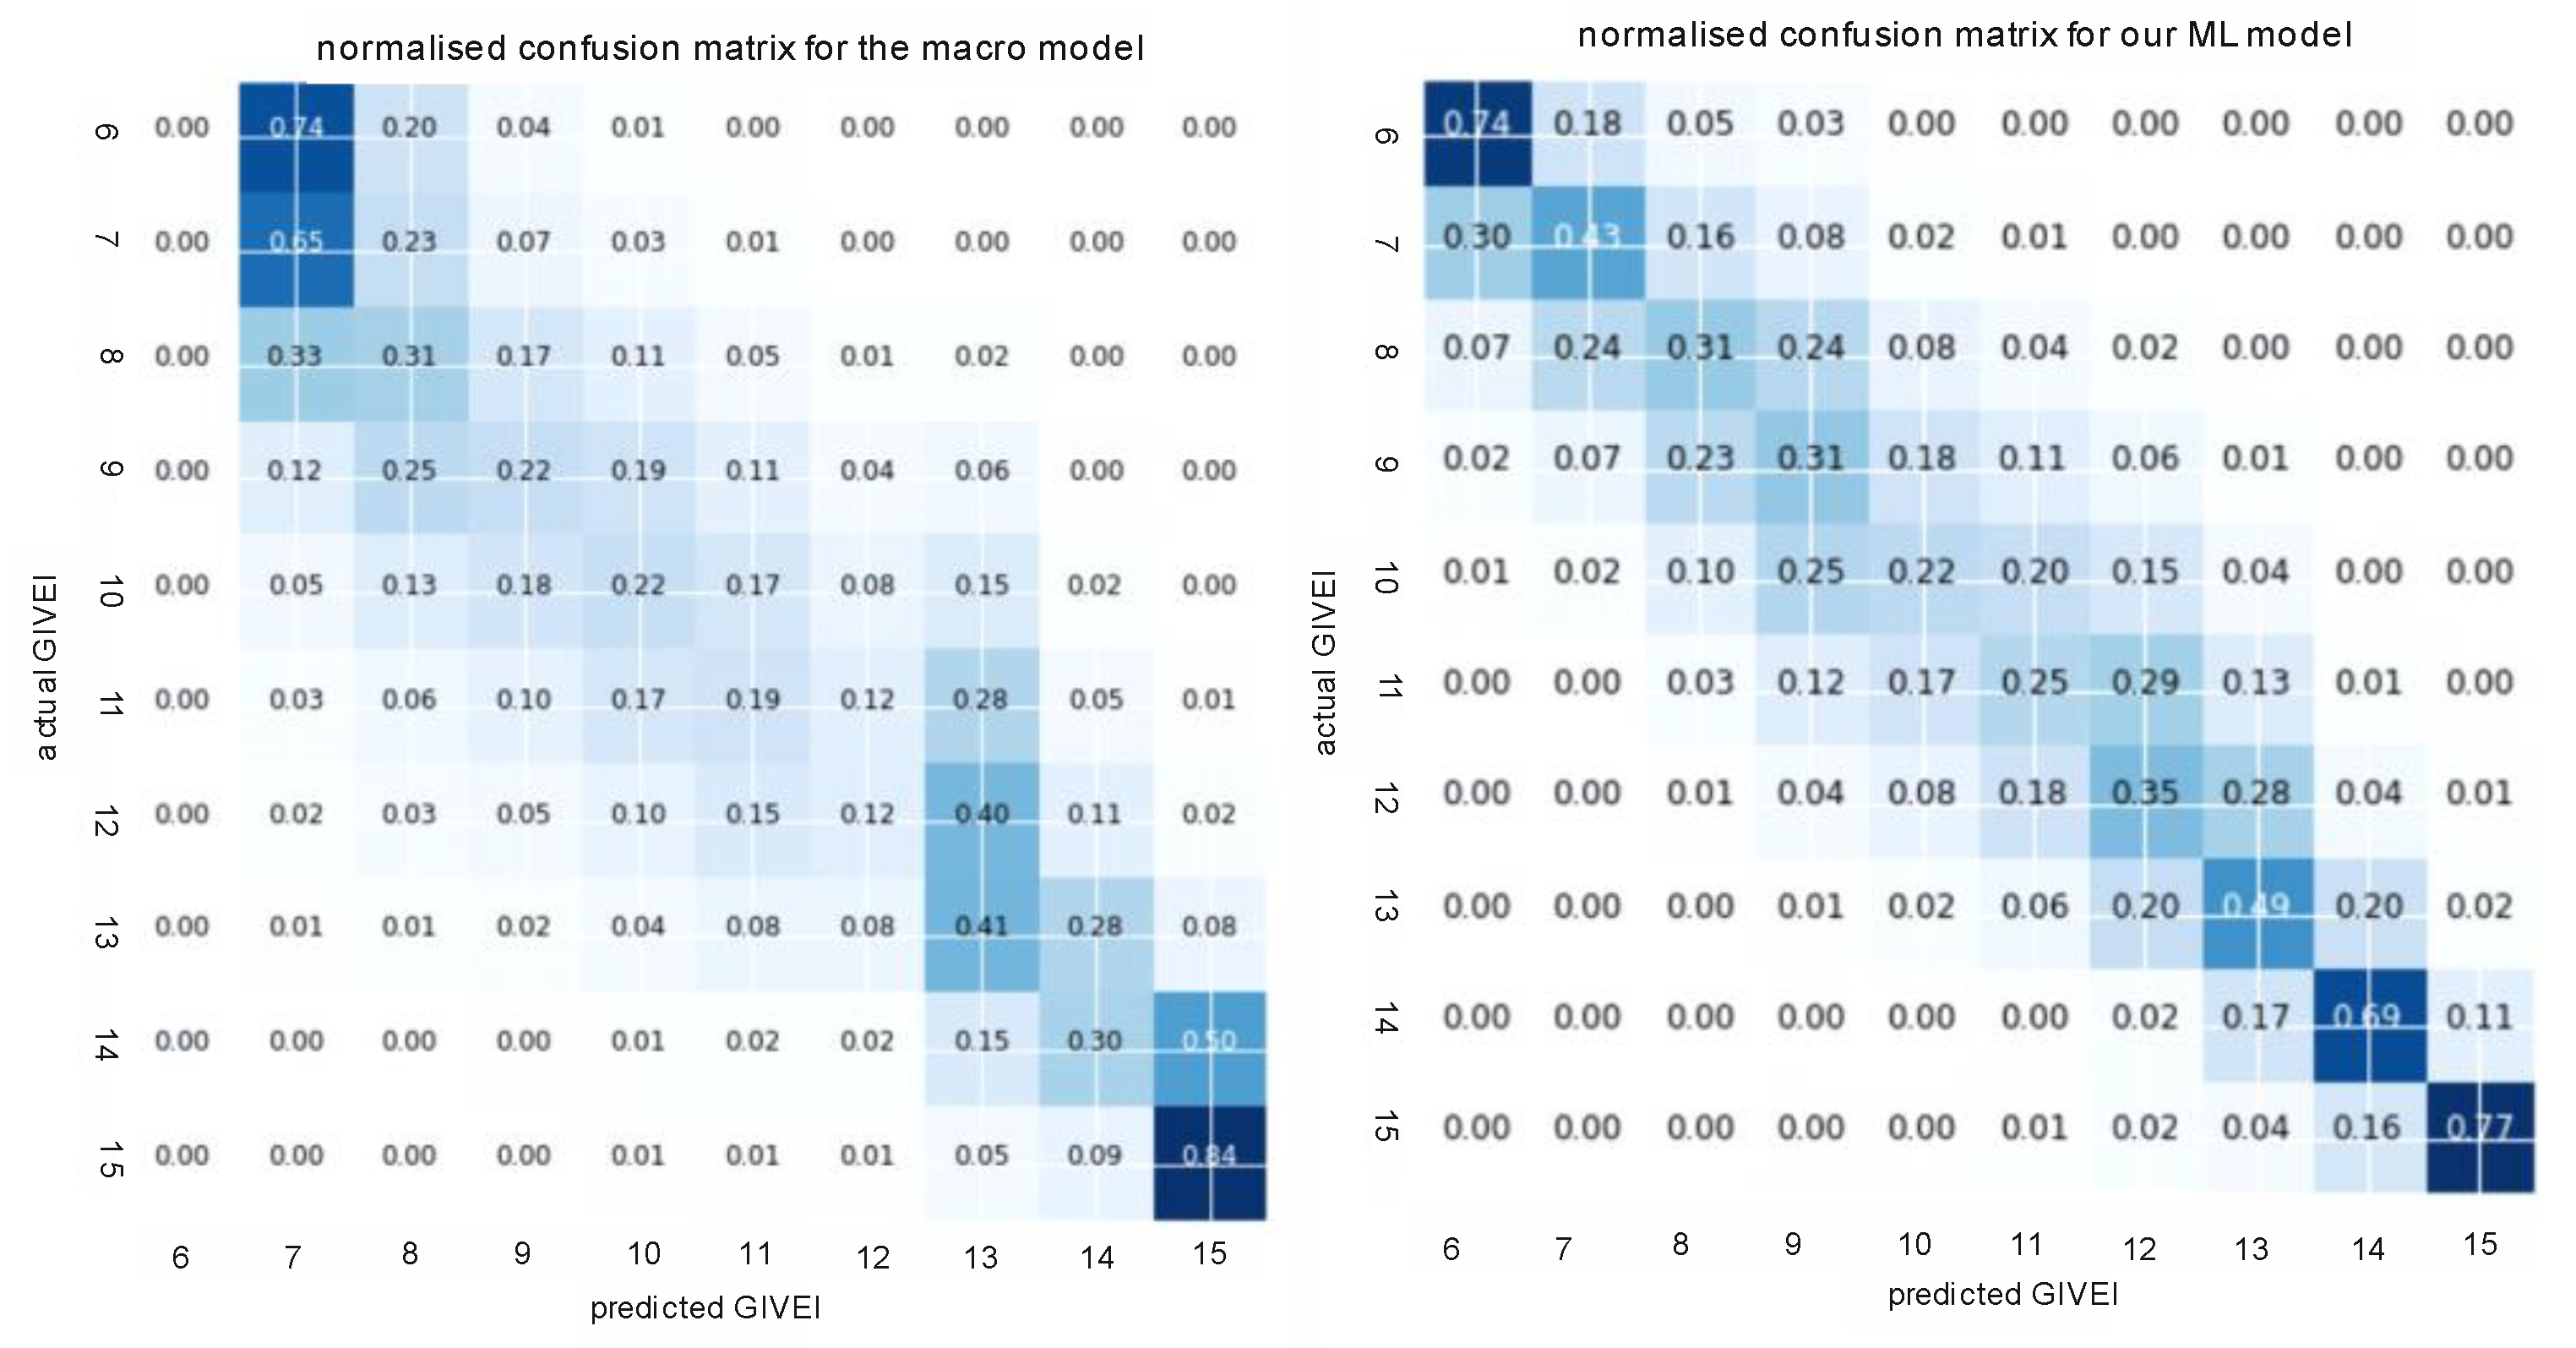
The performance of our LightGBM models was evaluated using k-folding cross-validation using 30% of the training data. LightGBM’s performance can be compared to that of the macro models provided by ESA by computing confusion matrices that show to what extent actual (observed) GIVEI and UDREI values match the predicted values for the validation data. Ideally, only the diagonals of the matrices would be populated, see Figure 3 and Figure 4. The figures clearly show that our model outperforms the macro model significantly and the outcomes are clustered significantly more around the diagonal. The percentual improvements on the correct estimations are also provided in Table 1 and Table 2.

Figure 3.
Confusion matrices for GIVEI prediction of the macro model and our ML model. Darker colors correspond to higher percentages of outcomes falling into the tile.
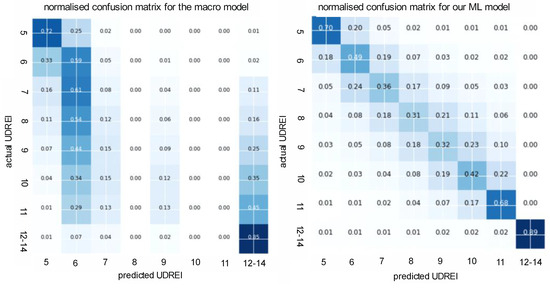
Figure 4.
Confusion matrices for UDREI prediction of the macro model and our ML model. Darker colors correspond to higher percentages of outcomes falling into the tile.

Table 1.
GIVEI prediction: percentages of correct outcomes for each class.
Table 2.
UDREI prediction: percentages of correct outcomes for each class.
6. User-Level Results
An assessment was conducted for three example scenarios to evaluate the accuracy of the machine learning application for different ground- and space-segment configurations. The metric used is the protection level, as calculated from the UDREI and GIVEI, for users located on a regular grid across Europe:
- Scenario 1 (“nominal case”) runs from the 17th to the 19th of September 2016, with a nominal ionospheric environment and no RIMS or GPS satellite outages;
- Scenario 2 (“GPS outages”) equals Scenario 1 but with GPS satellite outages (loss of G18 on 17/9, loss of G18 and G20 on 18/9, and loss of G18, G20 and G21 on 19/9);
- Scenario 3 (“RIMS outages”) equals Scenario 1 but with RIMS outages (loss of Golbasi on 17/9, Golbasi and Sofia on 18/9 and Golbasi, Sofia and Athens on 19/9).
To investigate cases with assumed GPS and RIMS outages, the GIVEI and UDREI values actually broadcasted from EDAS are invalid, and reference GIVEI and UDREI values were therefore produced by the European Space Agency using their EGNOS v2 Performance Engineering Platform (SPEED), which uses the same algorithms as the actual EGNOS ground segment.
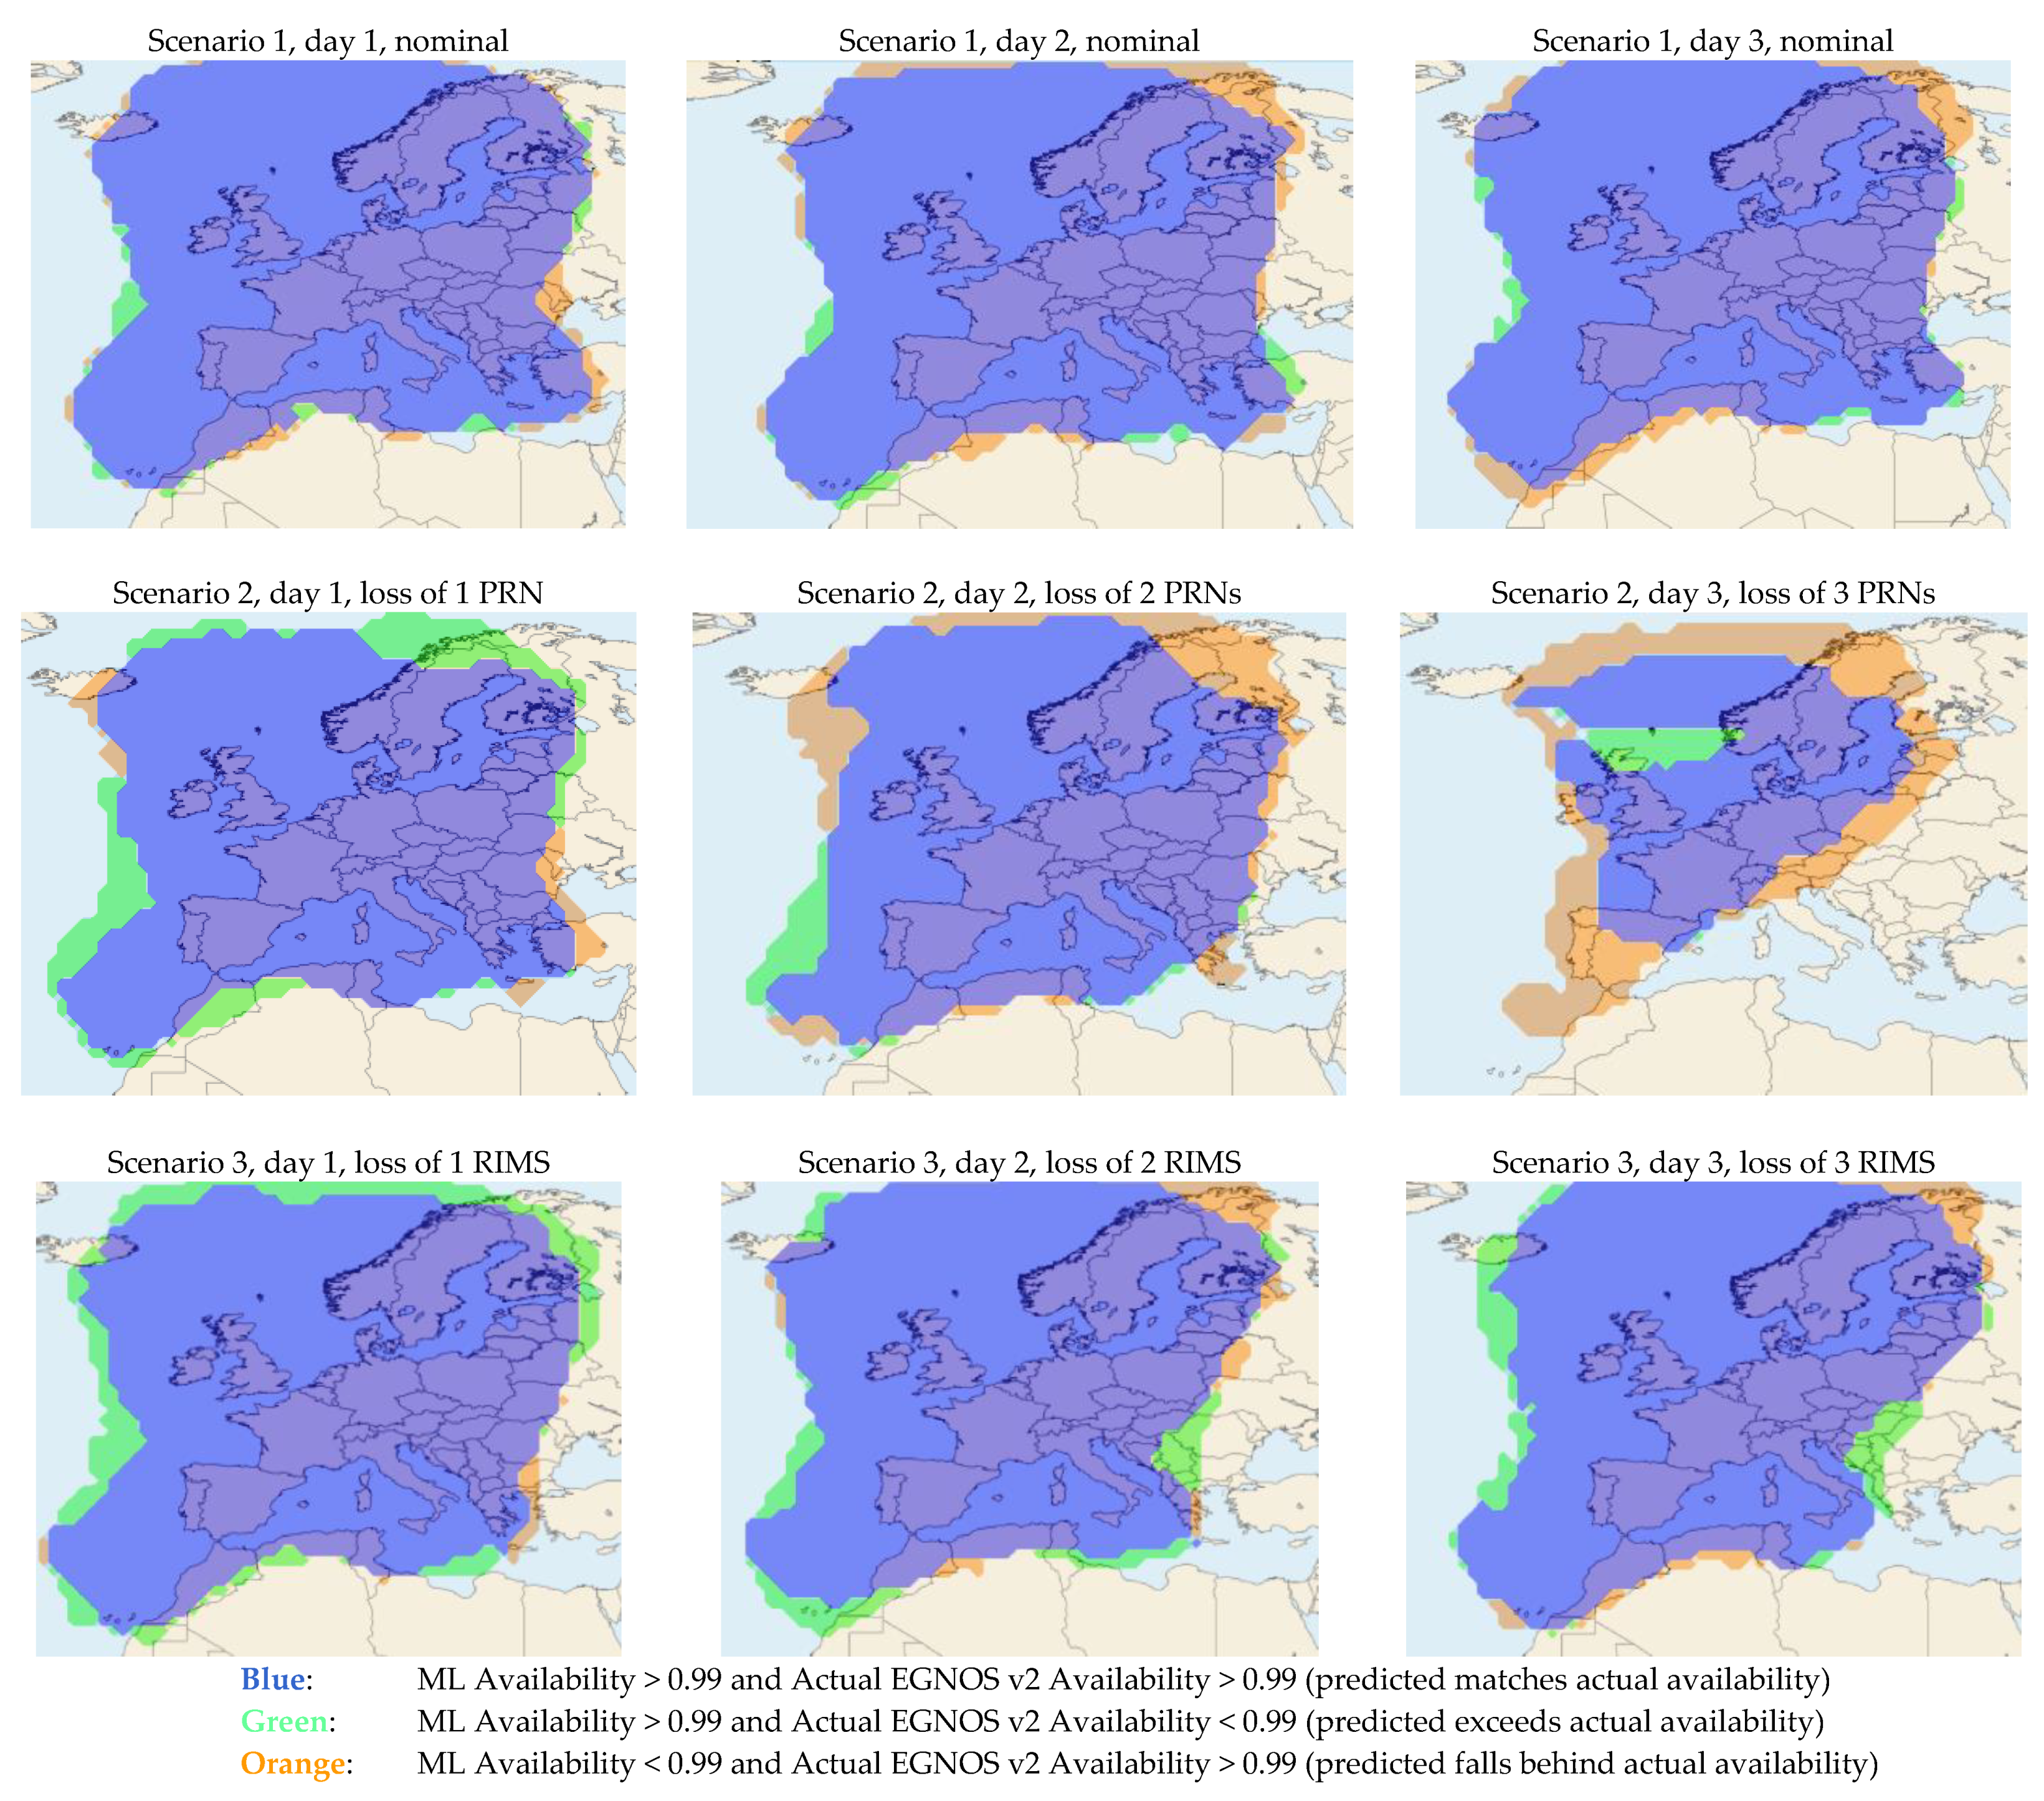
To compare how close the machine learning predictions are to the real EGNOS v2 performances, we first compare predicted and actual the EGNOS LPV200 availability service areas. This is the area where the protection levels are below the Alert Limits (40m horizontally and 35m vertically). This criterion is quite sensitive to UDREI and GIVEI changes. The resulting availability map comparisons are shown in Figure 5. The availability prediction at the centre of the service area is excellent, but towards the borders of the coverage the performance degrades somewhat and the availability is both over- and underestimated in some areas. When the satellite constellation is degraded, the availability at the edges becomes underestimated in more cases and some degradation near the core of the coverage area can be seen. A reduced number of RIMS makes the predictions only slightly worse at the edges of the coverage, with some additional over- and underestimated regions of limited size.
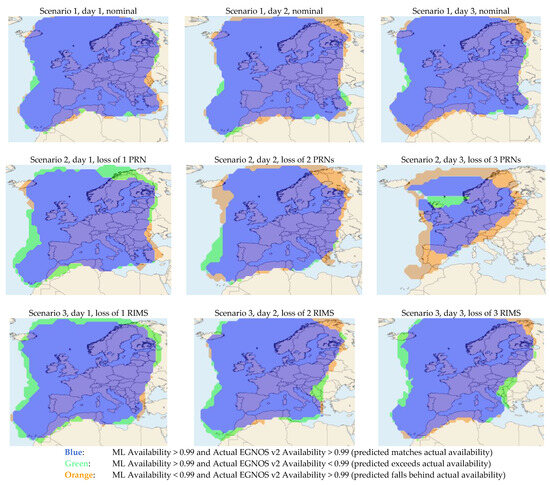
Figure 5.
Machine learning vs. EGNOS v2 (LPV200 99% availability differences). In the green areas, EGNOS performance is overestimated, while in the orange areas it is underestimated.
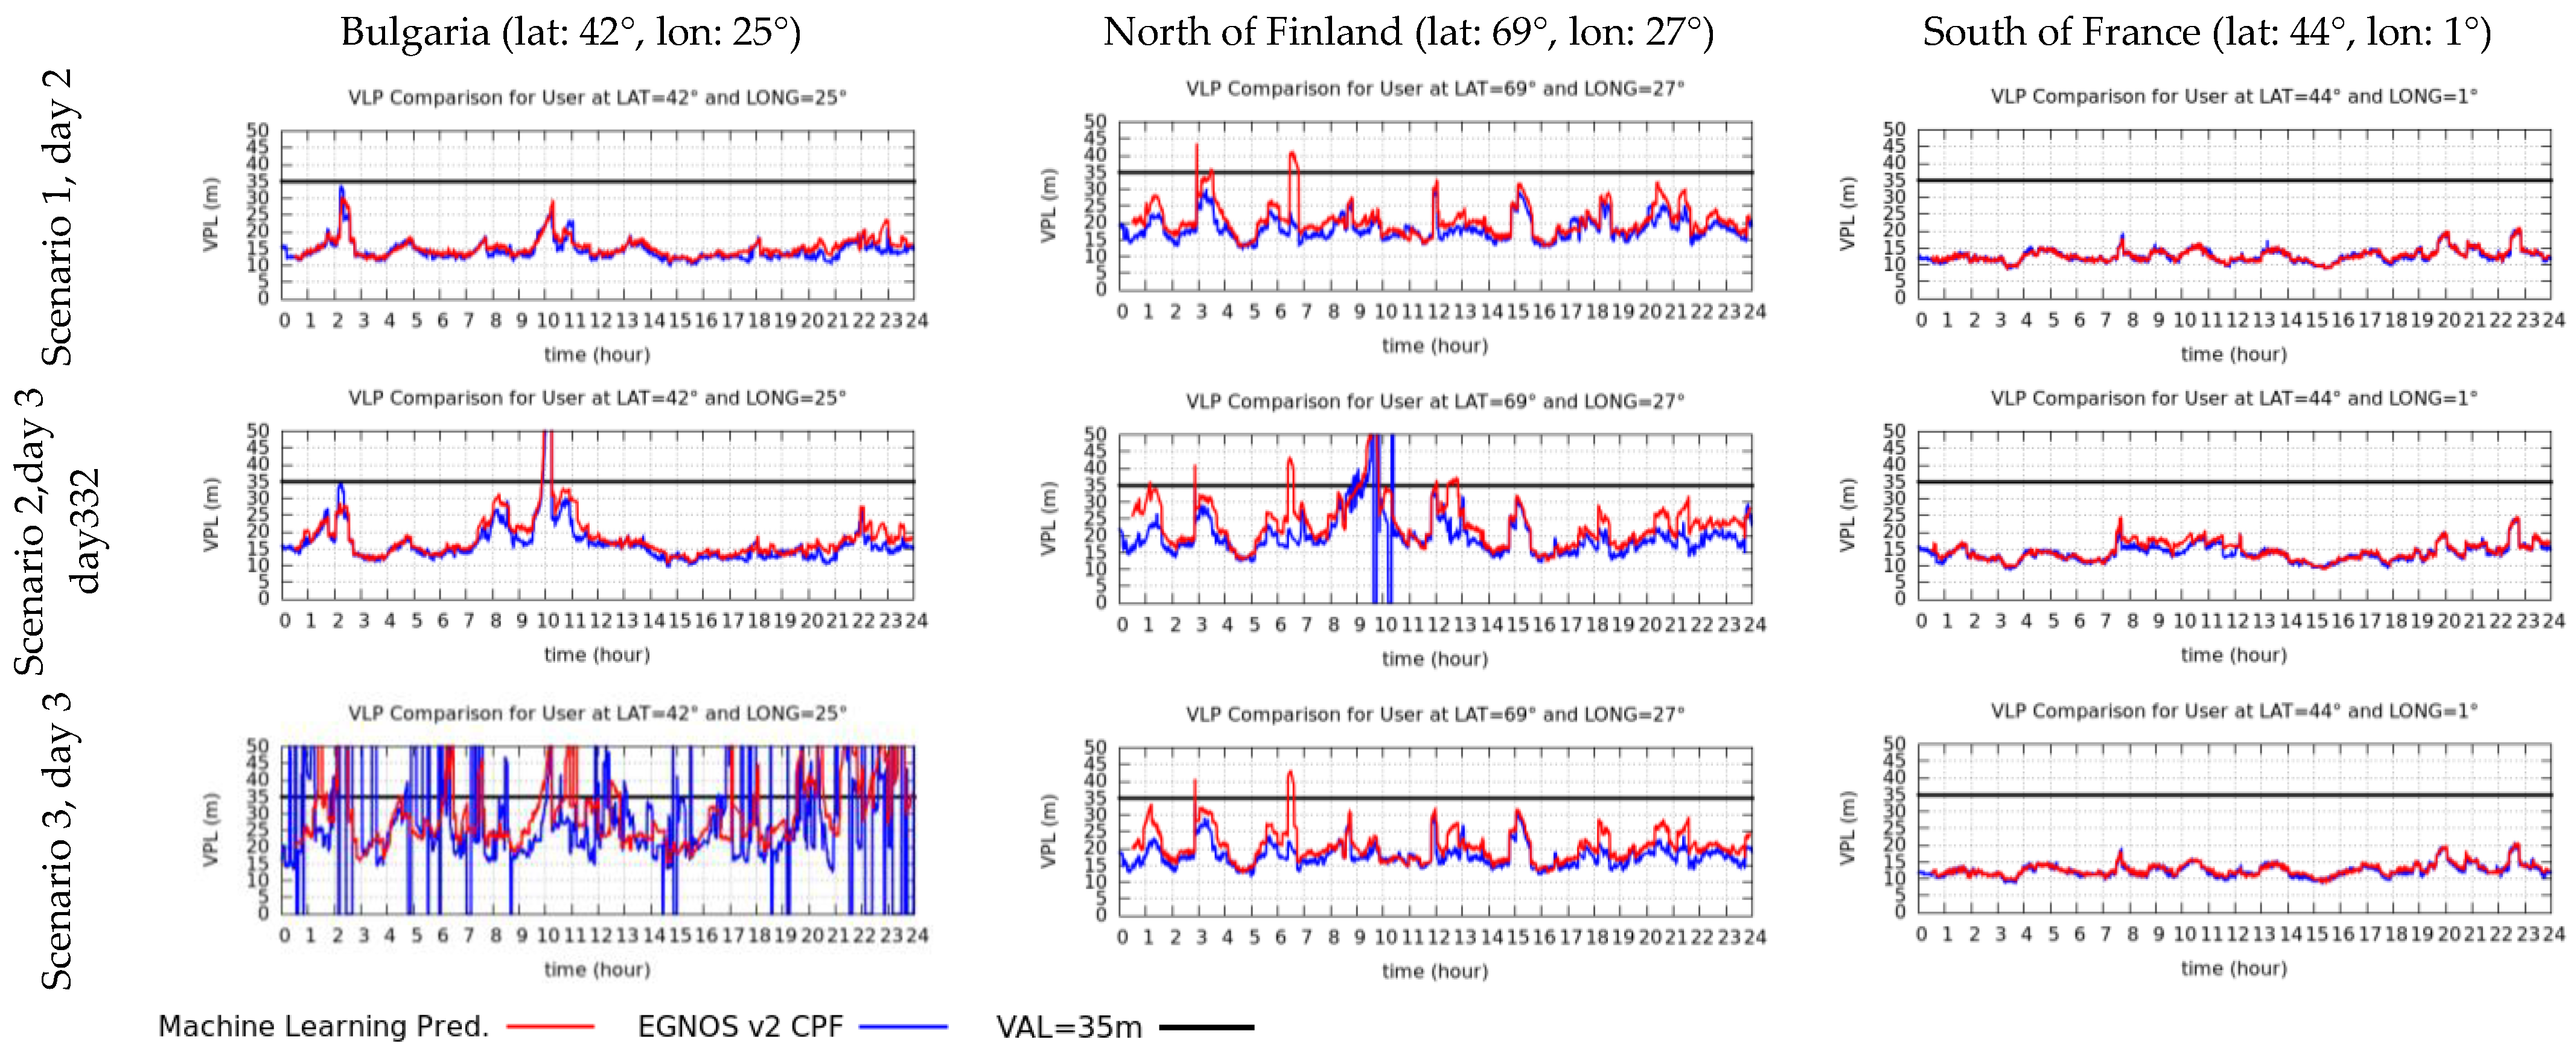
As a second comparison, some time series of vertical protection levels for users near the east and north borders of the service area (Bulgaria and the north of Finland), as well as the centre of this area (South of France) have been produced, see Figure 6. The protection levels from the core of the service area can be predicted well, as was also found in [2]. This is likely because low values of UDREI and GIVEI are common and these are predicted with high accuracy as evident from Figure 3 and Figure 4. Towards the edges of the coverage area, our algorithm tends to be somewhat conservative and predict larger-than-actual protection levels. The conservatism increases somewhat in the presence of satellites and RIMS outages. In some cases, the actual protection level is unavailable, while the prediction still produces valid protection levels. This has been investigated by ESA and corresponds to rapid GIVEI variations with short periods of ‘Not Monitored’ status, which is not reproduced by the machine learning module due to the relatively large sampling time used in these simulations. A reduction in the sampling time could improve the prediction of such events.
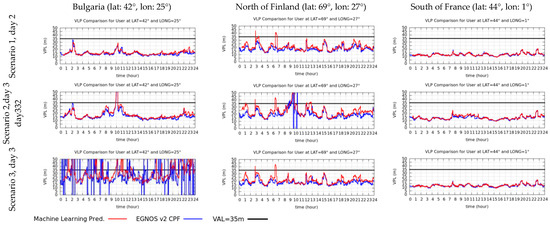
Figure 6.
Daily VPL time series for three different locations: ML versus EGNOS v2.
7. Conclusions
We have presented a machine learning-based solution to predict the performance of the current version of the EGNOS system called EGNOS v2. Our solution provides a considerably better performance than the macro model that we compared it against, in terms of the accuracy of the predicted UDREI and GIVEI. To what extent this translates into operational gains and reduced risks for actual users of EGNOS will be investigated in the next (and final) phase of the project, during which the user-level performances of the macro model and our machine learning approach will be assessed more thoroughly.
Author Contributions
Conceptualization and methodology, P.B.O., J.D., T.P., J.N.; C.F., M.D. and G.B.; software, J.N. and C.F.; validation, P.B.O. and M.D.; writing—original draft preparation, review and editing, P.B.O.; visualization, P.B.O. and M.D.; project administration, P.B.O.; funding acquisition, P.B.O. All authors have read and agreed to the published version of the manuscript.
Funding
The reported work was carried out under ESA NAVISP Element 1, which is devoted to the development of innovative PNT, systems, technologies, algorithms, and techniques.
Institutional Review Board Statement
Not applicable.
Informed Consent Statement
Not applicable.
Data Availability Statement
Data sharing is not applicable to this article.
Acknowledgments
Thanks to our anonymous reviewer for the constructive suggestions.
Conflicts of Interest
The authors declare no conflicts of interest. The research received funding from the European Space Agency, who have assisted in providing the visualization of the results.
References
- Vázquez, J.; Sánchez, M.A.; Cegarra, J.; Tejera, P.D.; Martínez, P.G. The EGNOS NOTAM Proposals Service: Towards Full ICAO Compliance. In Proceedings of the ION GNSS+ 2013, Nashville, TN, USA, 16–20 September 2013; pp. 301–315. [Google Scholar]
- Pérez, R.R.; Moreno, V.C.; García, J.M.; Rojo, E.R.; Sánchez, M.Á. Enhanced EGNOS NOTAM Predictions Through Machine Learning Techniques. In Proceedings of the ION GNSS+ 2021, St. Louis, MO, USA, 20–24 September 2021; pp. 364–384. [Google Scholar]
- ESSP Website. Available online: https://egnos-user-support.essp-sas.eu/services/safety-of-life-service/forecast-performance/ (accessed on 11 September 2023).
- RTCA DO-229E; Minimum Operational Performance Standards (MOPS) for Global Positioning System/Satellite-Based Augmentation System Airborne Equipment. RTCA, Inc.: Washington DC, USA, 2020.
- Westbrook, J.; Rerolle, A.; Blomenhofer, H.; McAnany, I.; Cosmen, J.; Werner, W. An Introduction to the EGNOS Central Processing Facility (CPF). In Proceedings of the IAIN World Congress and the 56th Annual Meeting of the Institute of Navigation (2000), San Diego, CA, USA, 26–28 June 2000; pp. 6–13. [Google Scholar]
- Sardon, E.; de la Fuente, J.A.; Zarraoa, N.; Nieto, J.; Cosmen, J. UDRE computation: A key issue for space-based augmentation system performance. In Proceedings of the 11th International Technical Meeting of the Satellite Division of The Institute of Navigation (ION GPS 1998), Nashville, TN, USA, 15–18 September 1998; pp. 2091–2100. [Google Scholar]
- SBAS Simulator. Available online: http://iguassu.cz/wp-content/uploads/2015/10/SBAS-Simulator2-brochure.issue0rev1.pdf (accessed on 11 September 2023).

Disclaimer/Publisher’s Note: The statements, opinions and data contained in all publications are solely those of the individual author(s) and contributor(s) and not of MDPI and/or the editor(s). MDPI and/or the editor(s) disclaim responsibility for any injury to people or property resulting from any ideas, methods, instructions or products referred to in the content. |
© 2024 by the authors. Licensee MDPI, Basel, Switzerland. This article is an open access article distributed under the terms and conditions of the Creative Commons Attribution (CC BY) license (https://creativecommons.org/licenses/by/4.0/).