1. Introduction
Worldwide, buildings are responsible for approximately 40% of primary energy consumption. In the Middle East region, buildings account for an even greater proportion of primary energy usage [
1]. Take Kuwait, for instance, where the climate is characterized by extreme heat and aridity, with a lengthy summer season from April to October. Here, the maximum dry bulb temperature can soar as high as 50 °C. Kuwait experiences a substantial 4967 cooling degree days (based on 21 °C), constituting a staggering 57% of the total annual hours [
2].
Following the discovery of oil in Kuwait in 1938, the nation embarked on a remarkable era of economic prosperity, profoundly impacting the residential building sector and its energy consumption patterns [
3]. Presently, the residential building landscape predominantly comprises large villas and smaller flats within mid-to-high-rise apartment buildings. The majority of Kuwaiti nationals reside in approximately 105,764 government and private villas [
4]. Notably, the average energy consumption share for these residential building types is 145,444 kWh per dwelling per annum (88%) and 20,278 kWh per dwelling per annum (12%), respectively. Analysis of the peak load distribution among these building typologies reveals that the residential sector accounted for more than 57% of Kuwait’s peak electrical power demand in 2011 [
5].
Despite the substantial magnitude of residential energy consumption in Kuwait, there exists limited data and research that dissects energy usage within the housing stock. This includes understanding the contributions of various factors such as the building envelope, plug-in loads, HVAC systems, and occupant behavior to overall energy consumption.
In the current study, an in-depth monitoring process has been conducted on a representative house, encompassing the measurement of both the overall household consumption and the consumption of each active system component, including the air-conditioning system, lighting system, hot water boiler, and plug-load. This endeavor aims to provide a comprehensive understanding of the energy consumption patterns of individual components within the house on an hourly, monthly, and annual basis. By identifying the most significant contributors to energy consumption, this research sets the stage for the development and implementation of effective energy conservation measures in Kuwaiti houses, as well as potential improvements to the Kuwaiti national energy conservation code.
2. Materials and Methods
This study aims to employ inverse uncertainty analysis to identify uncertain parameters based on comprehensive monitored data, particularly in the context of building design. This method allows for the prediction of unknown design parameters such as thermal bridges, infiltration rates, and HVAC performance. The key steps involved in this research methodology include the measurement of deterministic design parameters using energy meters, calibration of a building energy model using measured data, defining the range of values for undetermined design parameters, determining these parameter values through inverse uncertainty analysis using DesignBuilder software, and finally, analyzing the results obtained through these methods. This approach proves effective when the range of uncertain parameters is accurately defined, incorporating insights from previous studies and expert knowledge in the field.
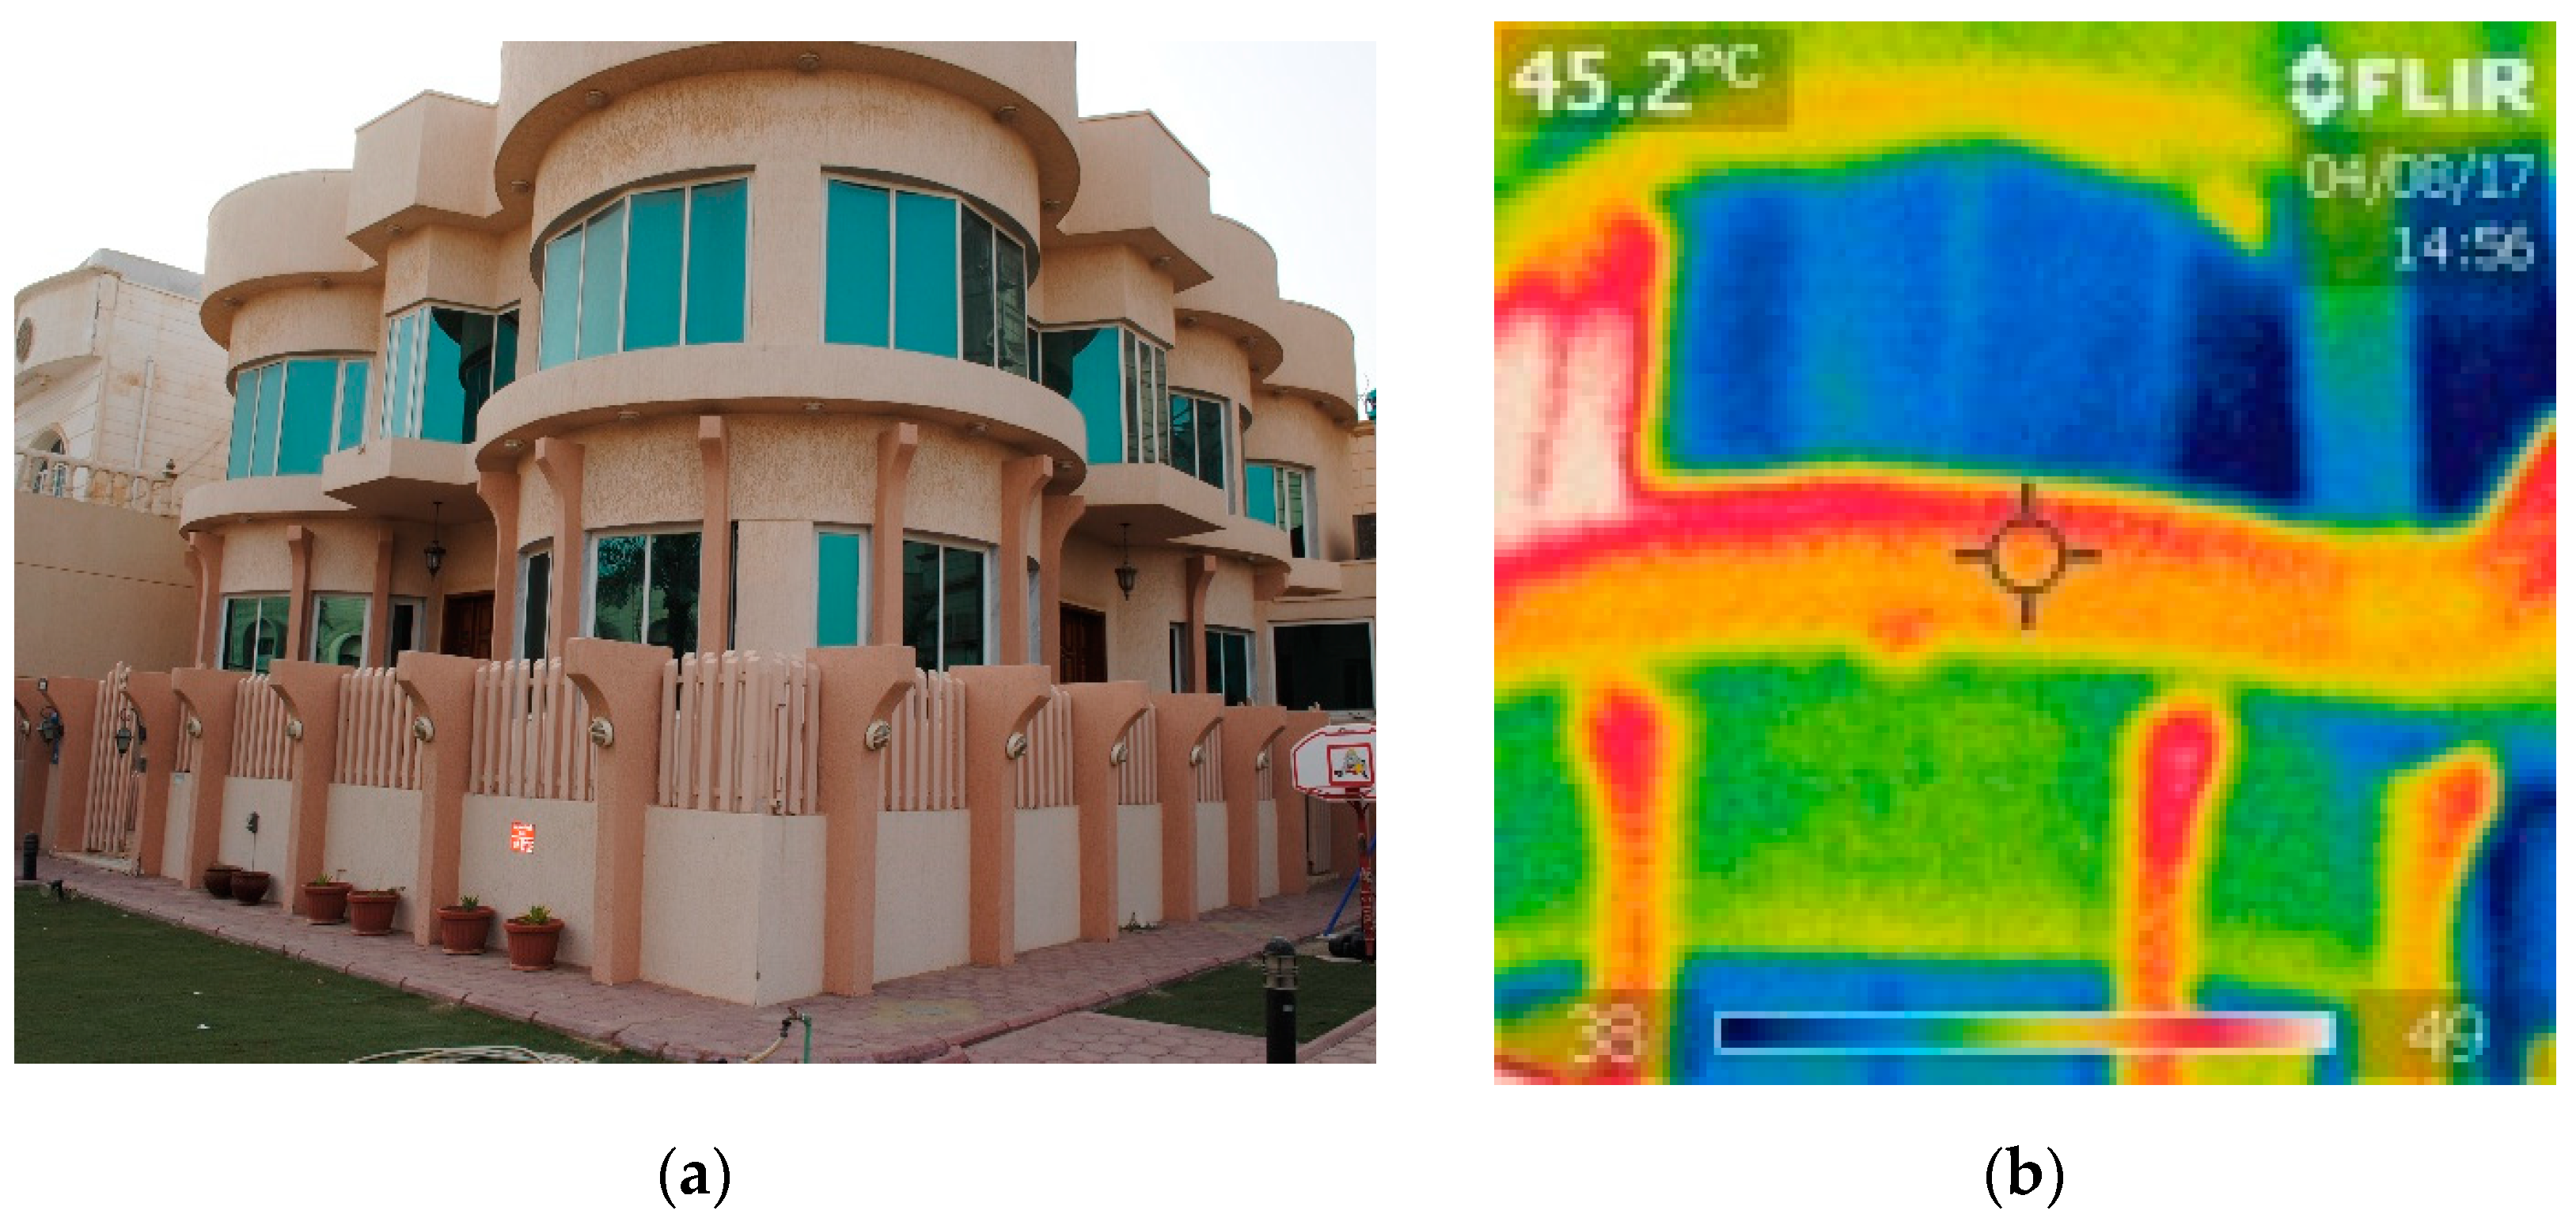
The selected monitored house was designed and constructed in accordance with the local energy code released in 1983 (MEW R-6) and many updated versions since then [
6]. The structure has an aspect ratio of 0.7, with the primary facades facing south and east, both featuring a significant amount of glazing, as depicted in
Figure 1. To mitigate direct sunlight penetration during summer sunrises and sunsets, there are side fins installed along the windows.
The house is comprised of three main floors: the basement, ground floor, and first floor, in addition to a rooftop area used for various services. The total plot area of the house covers 833.6 m2, with a total volume of 3127 m3. The basement floor is primarily used for gatherings and communal activities, while the ground floor includes a gathering room (hall), dining area, kitchen, and storage space. The first floor houses four bedrooms and a master room. The rooftop serves as a laundry area, additional storage, and includes a bedroom for a housemaid.
3. Results
The energy meters are tasked with monitoring six air conditioners, plug-load, and lighting on each floor, as well as the overall house consumption. The distribution of energy consumption among the primary components is illustrated in
Figure 2. Notably, it is evident that air conditioning accounts for approximately 79% of the total consumption. Additionally, a portion of the “5% others” category is allocated to the rooftop mini split unit (used for air conditioning) and a water cooler in that energy meter. The remaining contributors to the “other” category encompass lighting and plug-loads, constituting roughly 8%, while domestic hot-water consumption makes up 9%.
The monthly energy consumption distribution in
Figure 3 reveals that the primary energy demand is driven by the air-conditioning systems, peaking as expected during the summer months. Interestingly, the air-conditioning systems operated continuously throughout the entire year in the monitored year, 2017. However, their energy consumption was notably lower during the months of January, February, March, and December. This can be attributed to the relatively mild weather experienced during that year, which resulted in reduced demand for active cooling inside the house.
3.1. Validation and Calibration of Energy Model
A simulation model has been developed using DesignBuilder programs [
7], where the characteristics of the building envelope, air-conditioning systems, lighting, plug-load, and other miscellaneous items are inputted into the program. The weather data for the year 2017, as recorded by the weather station, are incorporated into the program.
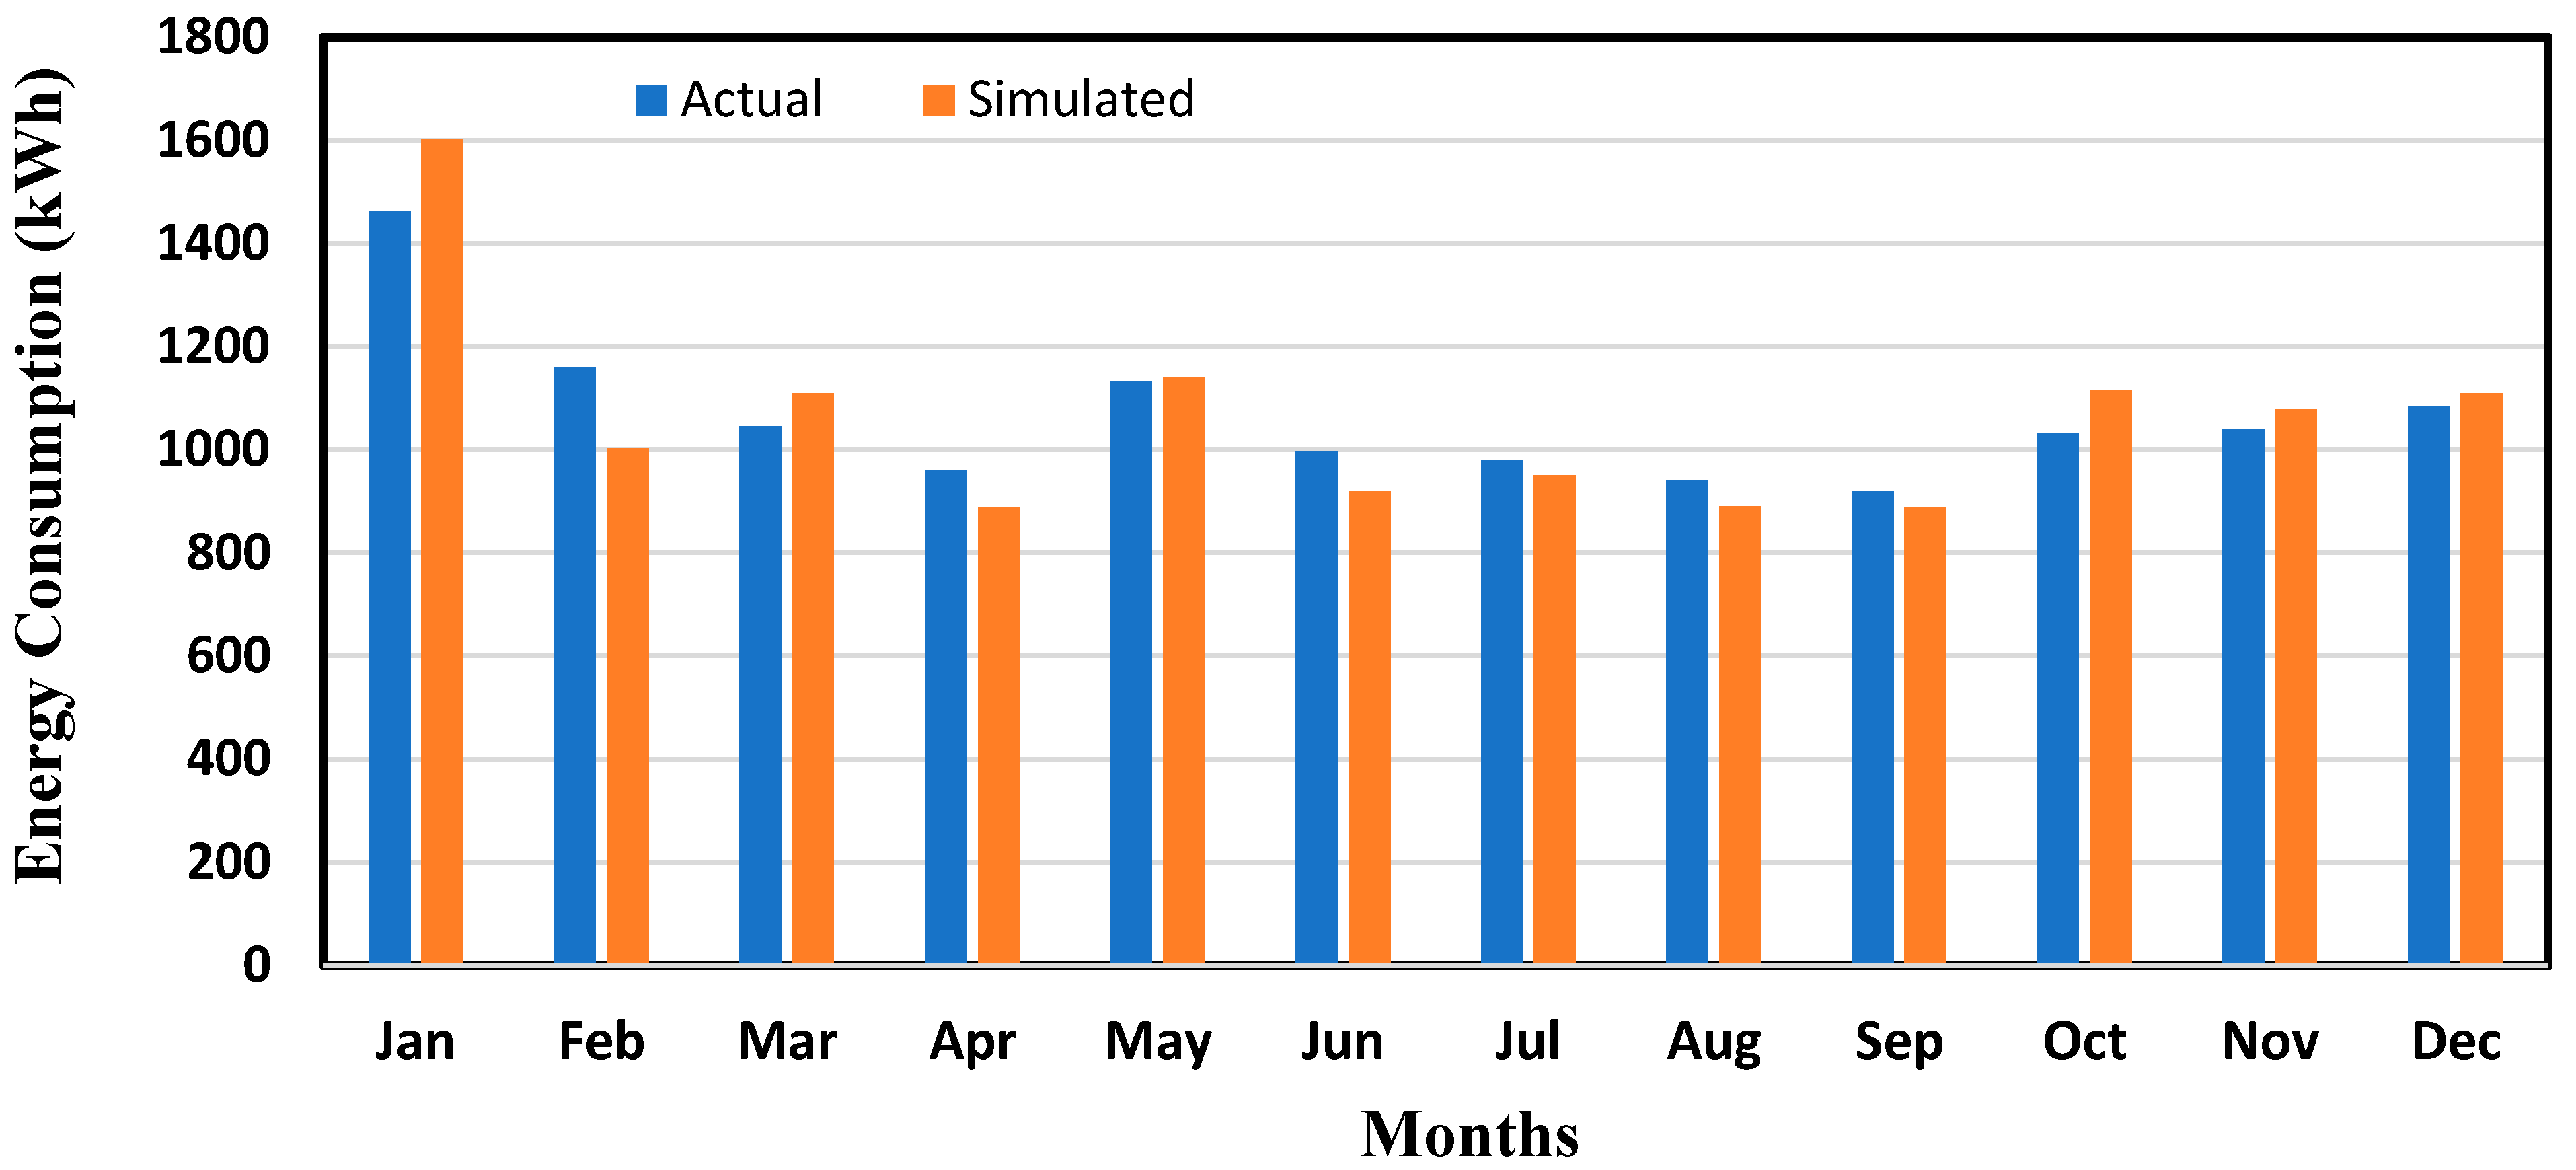
Figure 4 presents a comparison between the actual consumption measurements and the results obtained from the simulation model, using lighting and plug-load as a sample. Additionally, the hot water, miscellaneous items, and air-conditioning systems are also included in the comparison. The model’s predictions closely align with the actual measurements for the first three components.
3.2. Inverse Analysis Method
The inverse analysis method is utilized to determine uncertain parameters based on measured data with associated uncertainty values. The results indicate that the most influential design variable is the infiltration rate, which ranged from 1.7 to 2.3 air changes per hour (ac/h), with an average selection of approximately 2.0. Furthermore, it was evident that the thermal bridges in the external wall and floor could not be effectively addressed when creating the energy model. Among the deterministic parameters, the type of glazing had the least significant impact, as it fluctuated among the possible solutions. The coefficient of performance of the air-conditioning system (COP) averaged around 2.5. Additionally, regarding the roof, the presence or absence of thermal bridges leaned toward the exclusion of thermal bridges since their effect was mostly accounted for in the external wall’s intersection with the roof. For a complete set of calculated values for the uncertain design parameters, please refer to the rows highlighted in red, where the simulated consumption compared to the actual measurements showed less than a 2% difference.
4. Conclusions
The results revealed that the primary energy consumer by a significant margin is the air-conditioning system, which implicitly encompasses other building components such as the envelope, fenestration, infiltration, and the performance of the air conditioner. The main outcome of the study is to establish a strategy for ensuring compliance with energy conservation code recommendations in constructed houses. Additionally, a procedure for testing the airtightness of the house needs to be considered.
Author Contributions
Conceptualization, A.A. and H.A.-Z.; methodology, A.A.; software, A.A.; validation, A.A.; formal analysis, H.A.-Z.; investigation, H.A.-Z.; resources, H.A.-Z.; data curation, A.A.; writing—original draft preparation, A.A. and H.A.-Z.; writing—review and editing, A.A. and H.A.-Z.; visualization, A.A.; supervision, H.A.-Z.; project administration, A.A.; funding acquisition, A.A. All authors have read and agreed to the published version of the manuscript.
Funding
This research was funded by PUBLIC AUTHORITY FOR APPLIED EDUCATION AND TRAINING (PAAET), grant number TS-22-05.
Institutional Review Board Statement
Not applicable.
Informed Consent Statement
Not applicable.
Data Availability Statement
No new data were created or analyzed in this study.
Conflicts of Interest
The authors declare no conflict of interest. The funders had no role in the design of the study; in the collection, analyses, or interpretation of data; in the writing of the manuscript; or in the decision to publish the results.
References
- IEA. Key World Energy Statistics; Report for the Organization for Economic Cooperation and Development; International Energy Agency: Paris, France, 2014. [Google Scholar]
- Shaban, N. Development of Typical Meteorological Year for Kuwait; Report KISR 5857; Kuwait Institute for Scientific Research: Shuwaikh, Kuwait, 2000. [Google Scholar]
- Krarti, M.; Hajiah, A. Analysis of impact of daylight time savings on energy use of buildings in Kuwait. Energy Policy 2011, 39, 2319–2329. [Google Scholar] [CrossRef]
- Badria, J.; Tadj, O.; Rokia, R.; Alex, S. Understanding energy demand in Kuwaiti villas: Findings from a quantitative household survey. Energy Build. 2018, 165, 379–389. [Google Scholar] [CrossRef]
- IEA. IEA Statistics: CO2 Emissions From Fuel Combustion; Report for the Organization for Economic Cooperation and Development; International Energy Agency: Paris, France, 2012. [Google Scholar]
- MEW Energy Conservation Code of Practice, MEW/R-6/2010, 2nd ed.; Ministry of Electricity and Water: South Al Sourra (Shuada) Ministries Zone, Kuwait, 2010.
- DesignBuilder Version 5.3.0, DesignBuilder LTD. UK. Available online: www.designbuilder.co.uk (accessed on 10 June 2023).
| Disclaimer/Publisher’s Note: The statements, opinions and data contained in all publications are solely those of the individual author(s) and contributor(s) and not of MDPI and/or the editor(s). MDPI and/or the editor(s) disclaim responsibility for any injury to people or property resulting from any ideas, methods, instructions or products referred to in the content. |
© 2023 by the authors. Licensee MDPI, Basel, Switzerland. This article is an open access article distributed under the terms and conditions of the Creative Commons Attribution (CC BY) license (https://creativecommons.org/licenses/by/4.0/).

