Proceeding Paper

Cooling Simulation on Woven Polyester by Finite Elements for Improving Quality Inspection †

1
InViLab Research Group, University of Antwerp, Groenenborgerlaan 171, 2020 Antwerp, Belgium
2
Centexbel, Technologiepark 70, 9052 Gent, Belgium
*
Author to whom correspondence should be addressed.
Presented at the 17th International Workshop on Advanced Infrared Technology and Applications, Venice, Italy, 10–13 September 2023.
Eng. Proc. 2023, 51(1), 27; https://doi.org/10.3390/engproc2023051027
Published: 6 November 2023

Abstract

:
The aim of this research was to investigate the application possibilities of thermal simulations in the textile industry, focusing on simulating the cooling of a woven textile. This simulation aimed to compare the inspection results with the simulated ones to find defects in textiles and examine where they critically differed. This approach would cut down the time between iterations and could be an option to detect faults in textiles in substitution of the currently used method of applying machine learning on images. The simulation was based on the finite element method. The thermograms were measured by an infrared camera setup. From these data, we extrapolated the height and texture of the weaving. In a later phase of research, the results of this simulation were benchmarked against real measurements.

1. Introduction

In the textile weaving industry, quality inspection traditionally relies on human inspection of fabrics over a lighting screen. This leaves a number of possibilities for human errors and creates difficulty in collecting and tracking data. The traditional quality inspection methods are time-consuming, labor-intensive, and often subject to human error. To address these issues, computer simulations have emerged as a valuable tool for enhancing the quality inspection processes in the textile industry. By employing advanced algorithms and modeling techniques, computer simulations offer numerous benefits such as increased efficiency, improved accuracy, and enhanced product consistency. This paper explores the application of computer simulations in the quality inspection of textiles, highlighting their potential to revolutionize the manufacturing landscape. The thermal simulations were used for a machine learning system, allowing for the detection and prediction of errors from the moment the processing parameters started deviating from the parameter window set for the specific application. This system could then be embedded within a broader predictive maintenance framework [1].

2. Methodology and Thermal Simulation

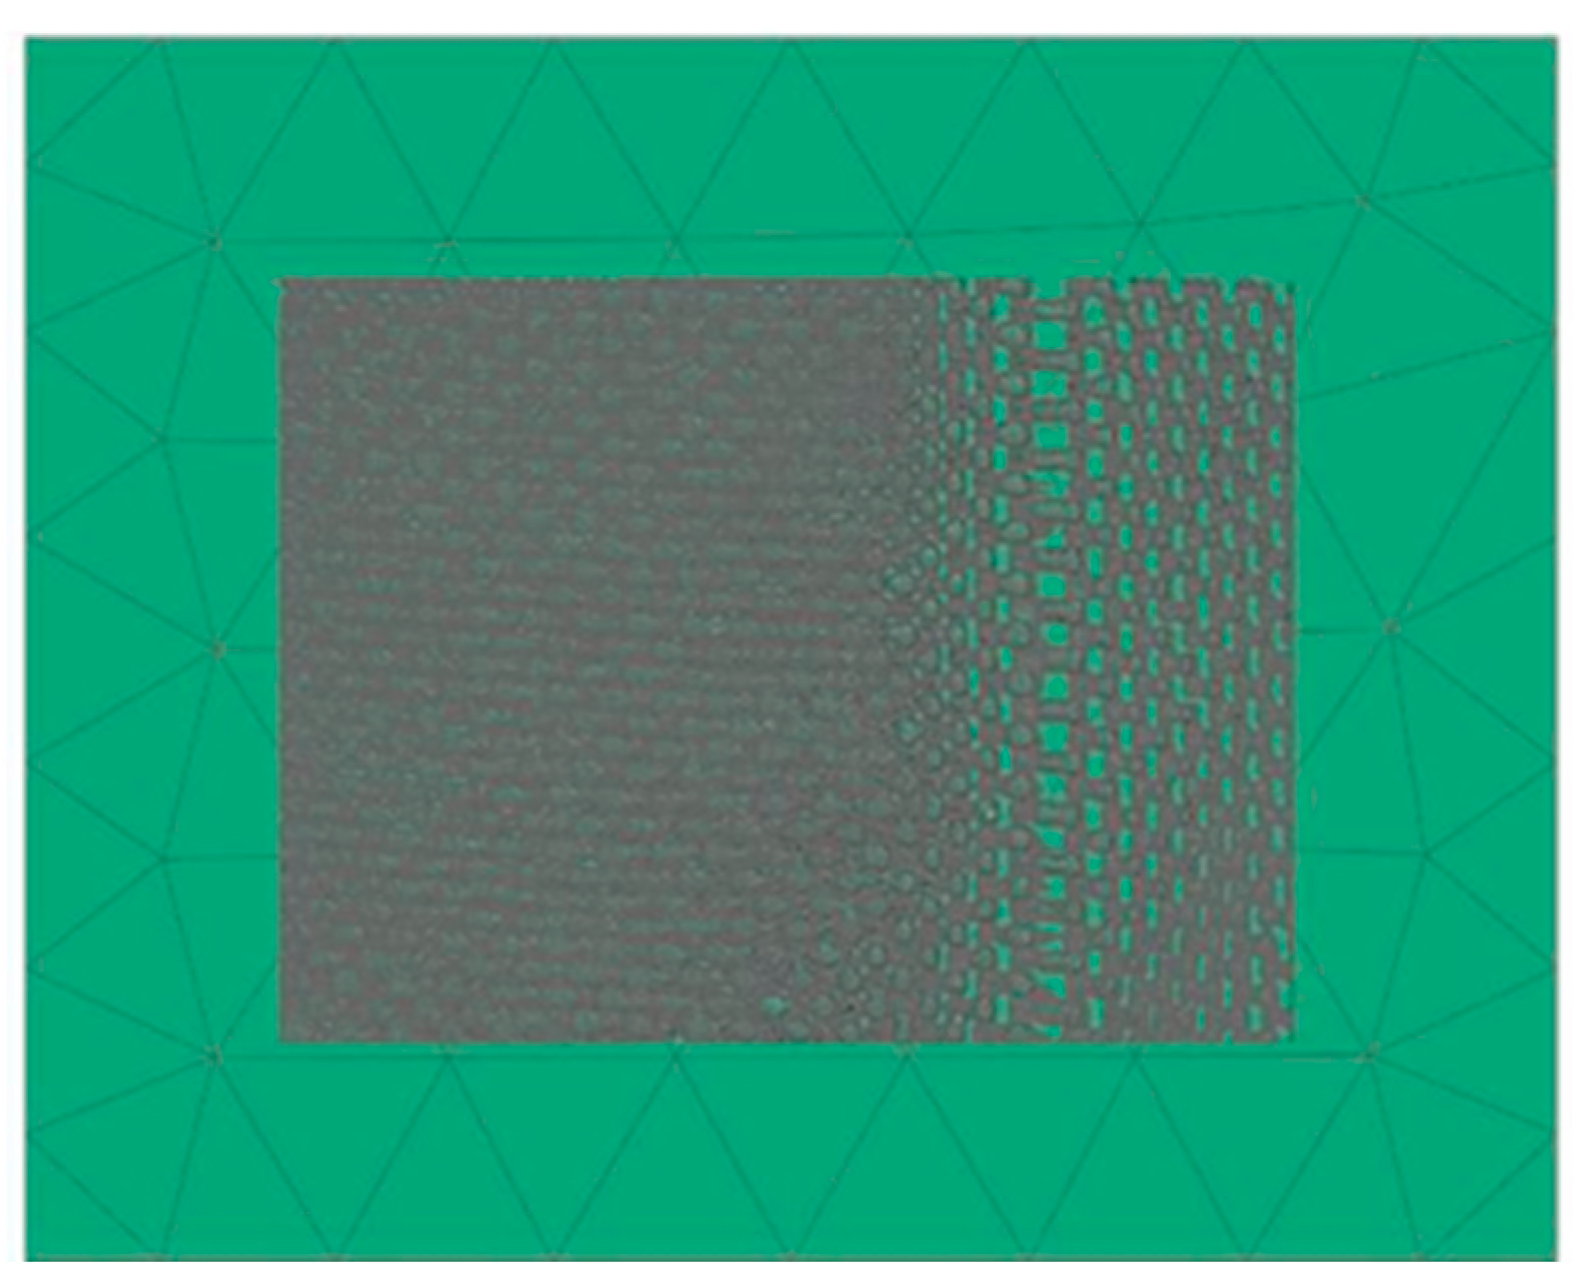
2.1. Modelling a Textile and Its Surface

To achieve a realistic model, we decided to use 3D color height mapping. This technique uses an image to extract information about the height of the examined sample. It does this by assigning bright colors to high points and dark colors to low points. This works wonderfully for textiles under illumination, as their higher portions catch and reflect more light than the lower ones. The result of this method is a point cloud in the form of an object file that can be easily imported into Siemens NX and that we used to determine the heat transfer in the textile sample. The modeling of the surface was highly simplified, as the textile was the object of interest, while the surface was just a support on which the textile was laid and towards which it dissipated part of the heat. Figure 1 visualizes the assembly of the textile and surface.

2.2. Simulation Solver and Parameters

Siemens NX Thermal/Flow was used to simulate the convection heat transfer in the modeled textile sample. To visualize the thermal results as a function of time, a transient simulation was performed. To simulate the cooling down of an object, it has first to be warmed up. Constraints allow the user to set a desired initial temperature. However, if the full heating–cooling cycle needs to be simulated, heating has to be performed too. Given that the object will not heat up at the same rate throughout its entire volume, it is important not to set the initial temperature at the desired maximum temperature of the thermal exchange mechanism (convection, radiation, conduction, etc.) that is analyzed. As for the thermal properties, Table 1 provides the values of the most important parameters of pure polyester [2].
A mesh size of 2.5 mm was chosen, based on a convergence analysis. We also opted for a 3D hybrid mesh, as it is the easiest to fit and is suggested by NX software. The mesh can be seen in Figure 1. As regards loads and constraints, we applied a temperature of 45 °C to the textile and to the surface. We also thermally coupled the surface and the textile, so that they could exchange heat. With respect to the mechanism of heat dissipation, we chose radiation and convection, since these are the main mechanisms by which samples with a small volume, like the examined textile, lose their warmth. According to Stefan–Boltzmann’s law of radiation, the amount of heat transfer by emitted radiation is directly proportional to the surface area of an object. As for convection, we chose a convection coefficient of 5 W/mm2 C, within the range of free convection in ambient air.

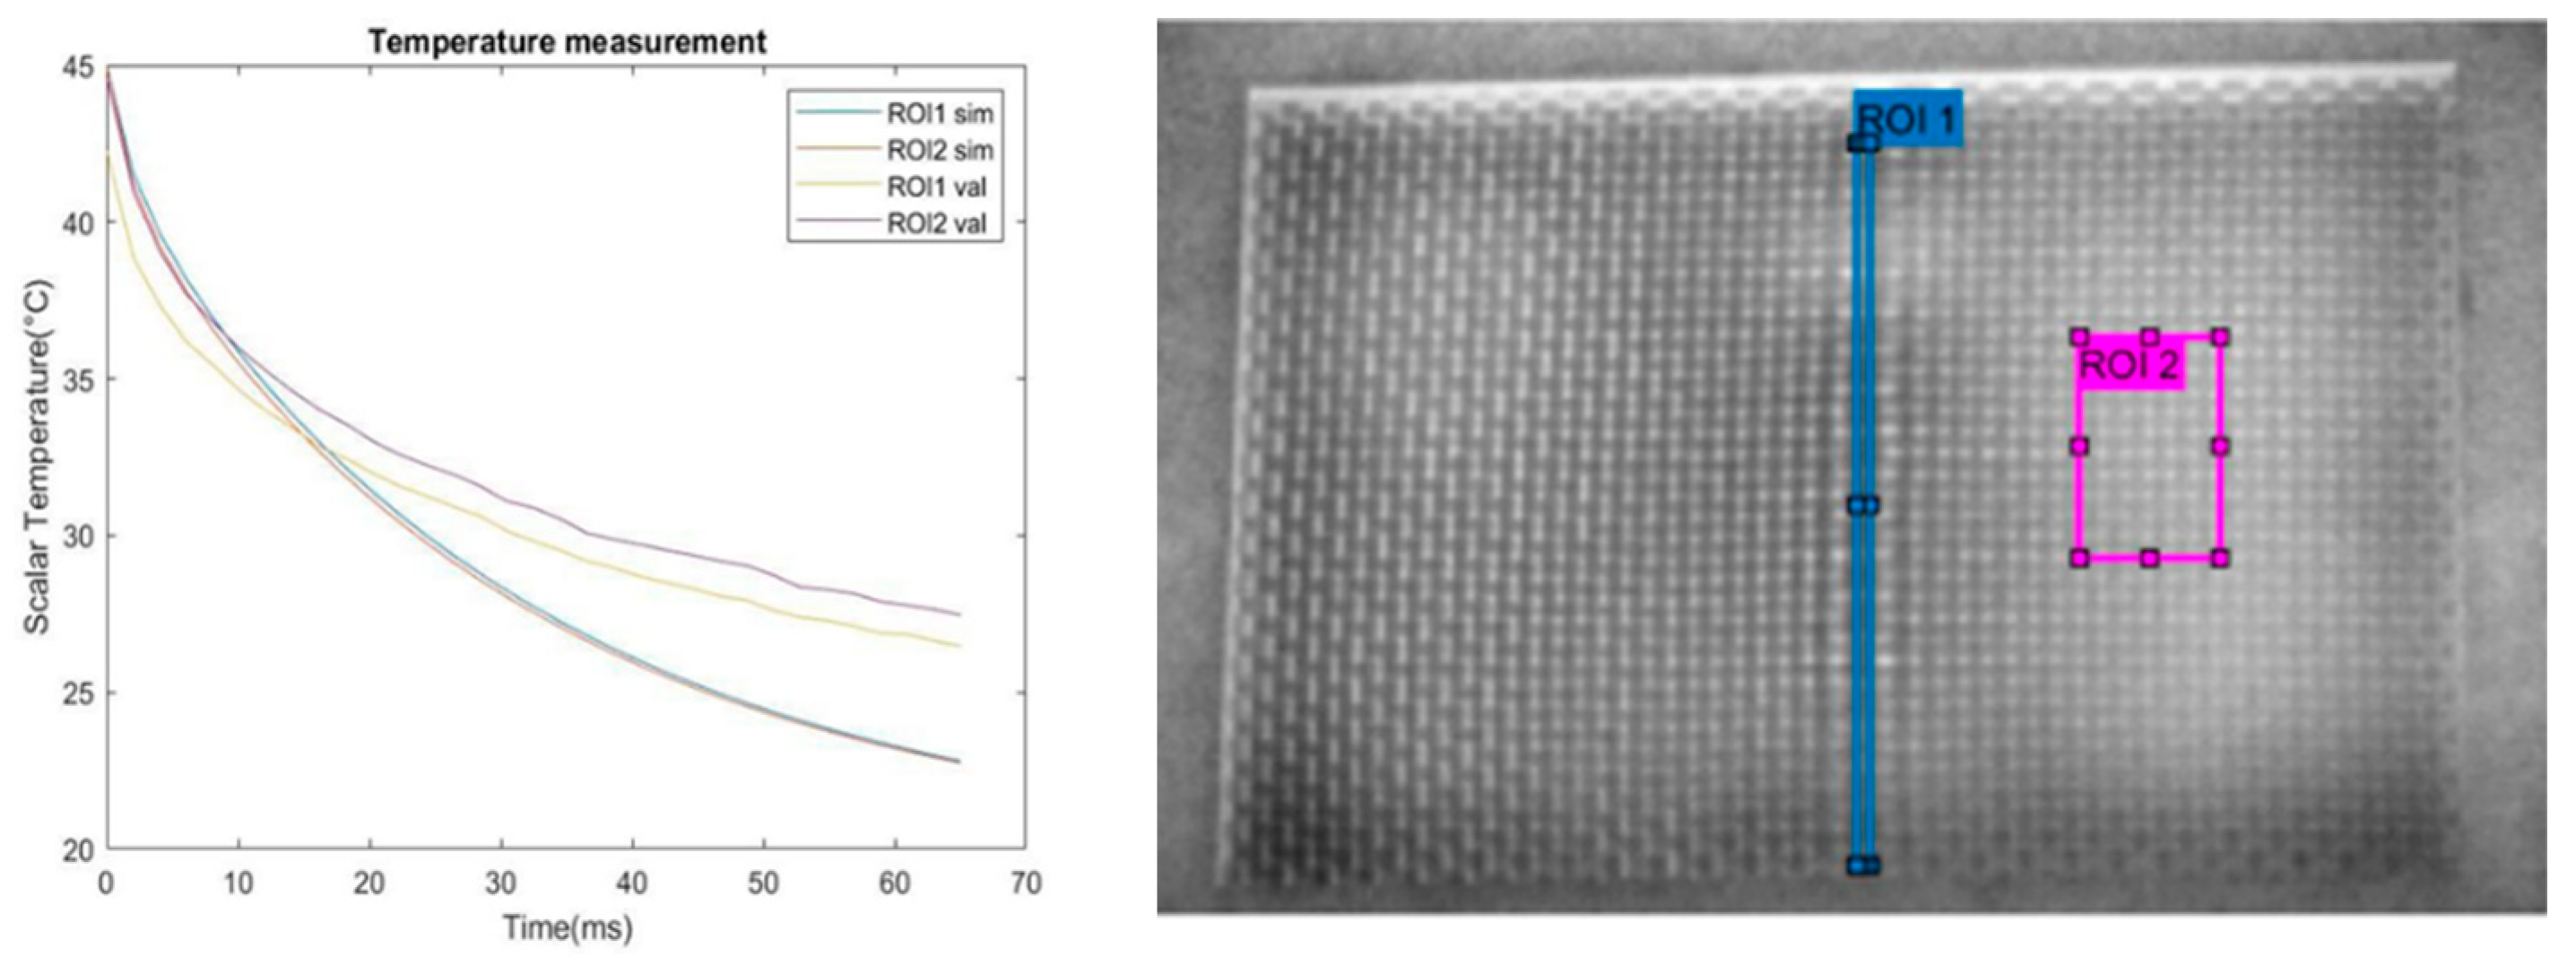
2.3. Infrared Measurements

The infrared camera used to measure the samples in the lab was a FLIR X6540sc. Two 2 kW halogen lamps were used to heat the textiles (Figure 2). The heat from the lamps warmed the camera, which affected the measurements. Therefore, we shielded the lens to ensure the heating of the camera was significantly reduced.
Specifications of the FLIR X6540sc infrared camera:
-
Resolution of 640 × 512 pixels;
-
Sample rate of 20 frames/s;
-
Warm-up time of 3 s by means of 2 × 2 kW halogen lamps;
-
Cool-down time of 8 s.

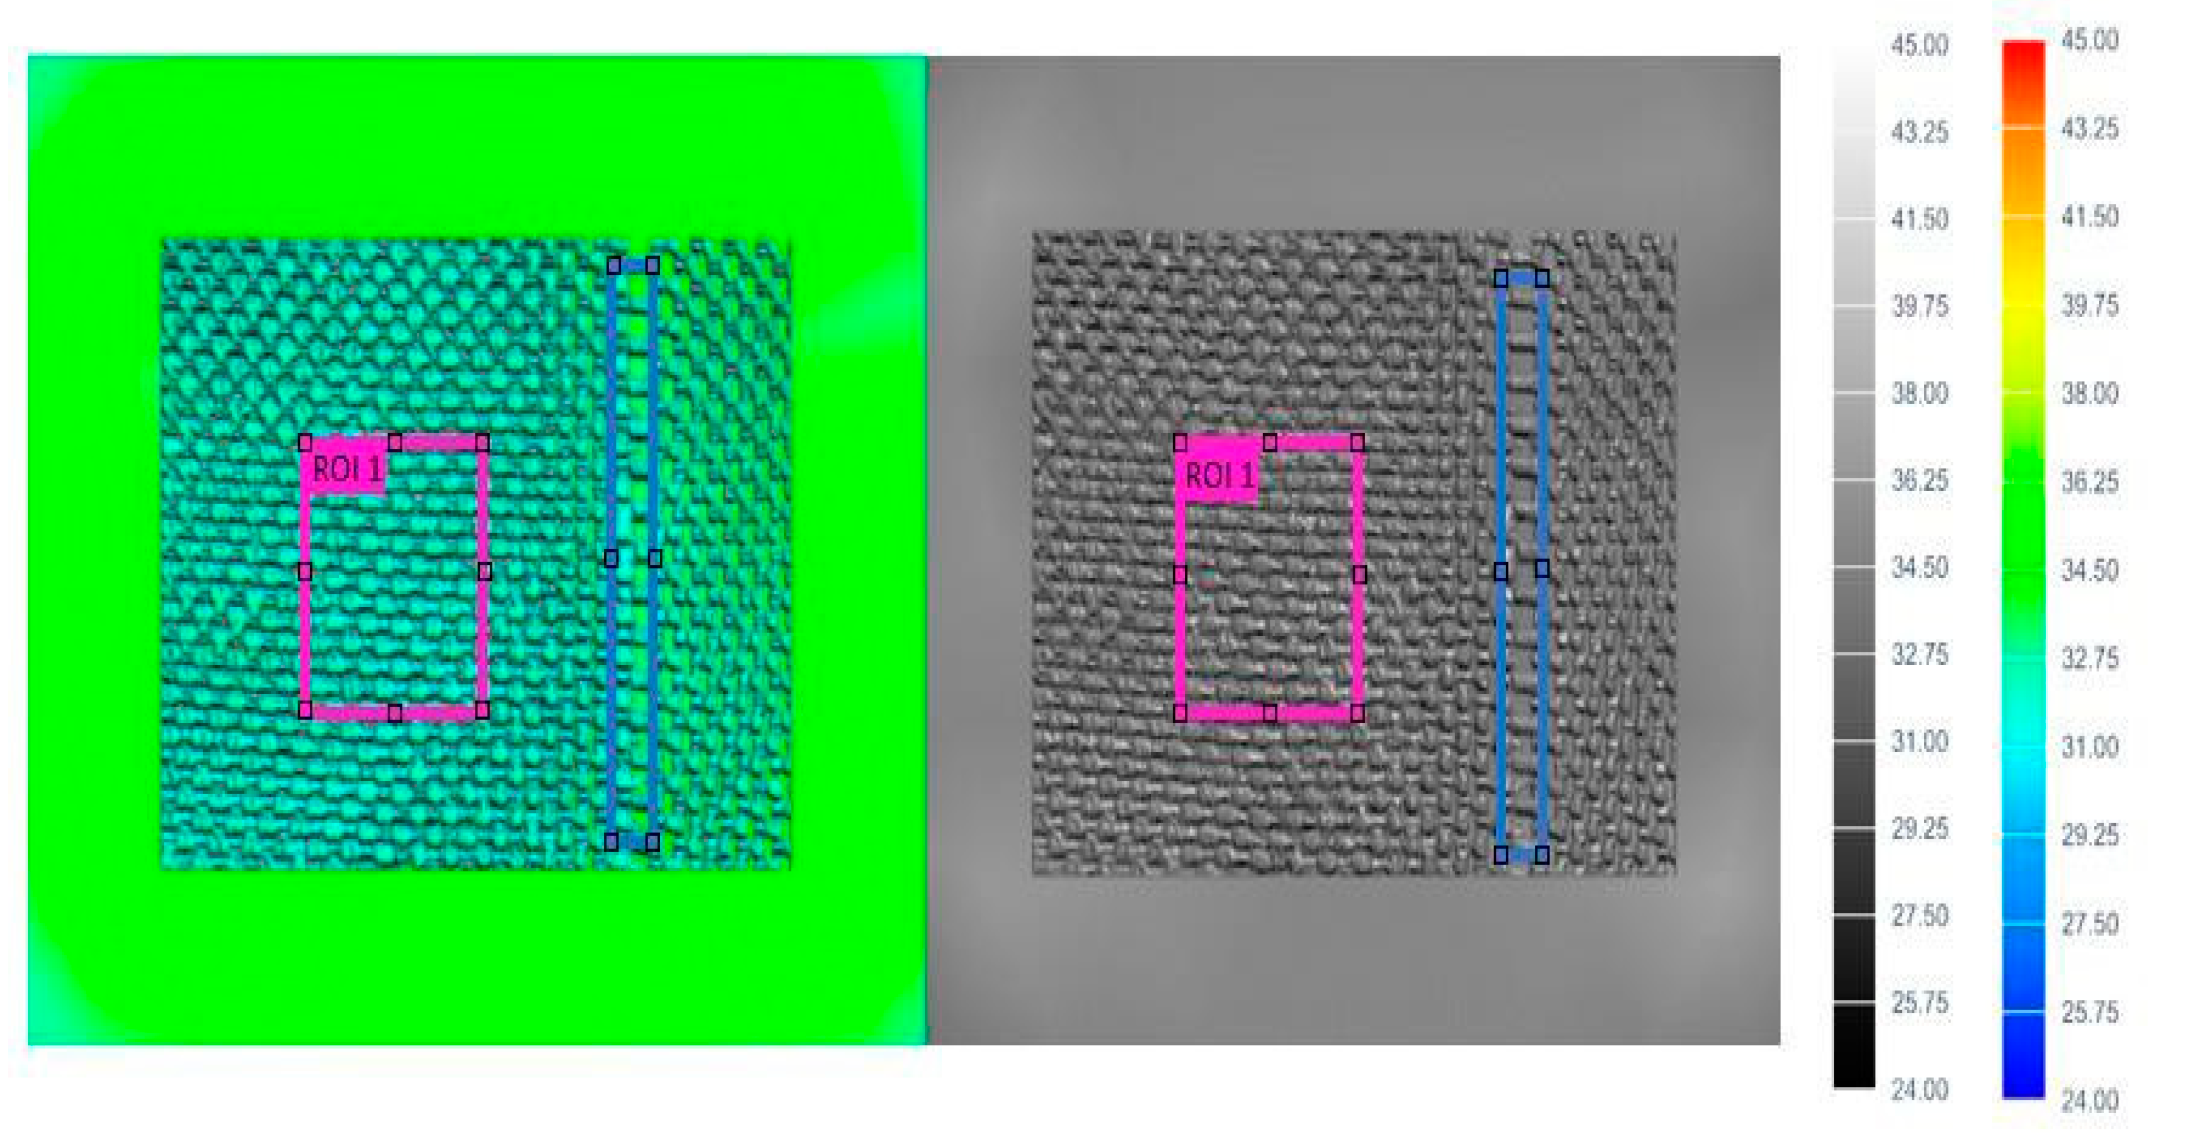
3. Results and Discussion

To validate our results, we conducted a thermography measurement (Figure 2) on our real textile using a FLIR x6540 sc camera. This infrared camera has an accuracy of 18 mK NEDT4 and measures every wavelength between 4.1 and 5 micrometers. Using it, we could measure the temperature on every point on the sample for 60 s with a frame rate of 20 Hz, resulting in 1200 measurements. We heated the textile to 45 °C using halogen lamps (the temperature was measured with the thermal camera). After this, we started our capture while the sample was cooling down. We repeated this process a second time to ensure our results were repeatable. For the simulation and validation measurements, we plotted the temperature as a function of time for two regions of interest (ROIs) on the textile (Figure 3). We choose one ROI including the textile defect and one including an intact/general piece of textile outside the zone that would be affected by the difference in temperature induced by the defect. ROI 1 comprised the defect, ROI 2 was a general area. We used these ROIs for both the real measurement and the simulation to make sure we could accurately compare the results, as shown in Figure 2 (right). In the simulation, as shown in Figure 2 (left), we observed that both ROIs started to cool down very rapidly, then their temperature steadily declined towards a steady state corresponding to room temperature. However, in our simulation, the temperature of ROI 1 (including the defect) decreased somewhat more quickly than that of ROI 2, reaching lower values at each time. This made it possible to accurately discriminate between the defective textile and the intact textile. In Figure 2 (left), it is shown that the temperature in the real measurements followed exactly the same trend: it started to decline fast and then slowly converged towards the steady-state temperature of the room. Also in this case, the temperature of the defective area remained lower than the average temperature over the intact textile surface. We then validated the accuracy of the simulation measurements with respect to the validation measurements by calculating the root-mean-square error (RMSE) between the two curves. The lower the RMSE value, the better. In fact, 0 would be a perfect fit, and every higher value would mean a digression from reality. Here, every RMSE value lower than 0.5 could be considered a very good fit, whereas any higher value would recommend further research. We achieved an RMSE value of 2.4.
Upon reflecting on our simulations, we identified several aspects that could enhance our results. Firstly, we propose simplifying the model to expedite parameter fine-tuning during iterations. This approach would allow more efficient adjustments. Secondly, we observed that during the validation measurements, the textile tended to transfer a significant amount of heat to the underlying base. To address this, we suggest implementing a steady-state temperature for the base instead of using a constant temperature of 45 °C, as in our presented model simulation. Lastly, we utilized specific values for the convection coefficient of still air, although various situations present a wide range of potential values, as found by an internet search. Exploring and experimenting with different coefficients may yield more accurate outcomes. Based on the thermography measurements, our simulation still differed from the reality. However, we can affirmatively answer the research question and state that thermal simulation can be used to detect defects in textiles. Importantly, this detection is financially feasible, as the temperature difference between ROI 1 and ROI 2 consistently remained within 1 degree Celsius, which is well below the accuracy threshold of modern thermal cameras (0.2 °C).

Author Contributions

Conceptualization, G.S.; software, S.V.; resources, M.V.; original draft preparation, R.H.; writing—review and editing, S.D.V.; supervision, B.R.; project administration, G.S. All authors have read and agreed to the published version of the manuscript.

Funding

This research was funded by the University of Antwerp and the Institute for the Promotion of Innovation by Science and Technology in Flanders (VLAIO) via support for the TETRA project, “Inspect 4.0,” project number HBC.2021.0070.

Institutional Review Board Statement

Not applicable.

Informed Consent Statement

Not applicable.

Data Availability Statement

Not applicable.

Conflicts of Interest

The authors declare no conflict of interest.

References

  1. Heirmans, R.; De Moor, O.; Verspeek, S.; De Vrieze, S.; Ribbens, B.; Vanneste, M.; Steenackers, G. Improving Quality Inspection of Textiles by an Augmented RGB-IR-HS-AI Approach. Eng. Proc. 2021, 8, 21. [Google Scholar] [CrossRef]
  2. Jhanji, Y.; Gupta, D.; Kothari, V.K. Thermo-physiological properties of polyester–cotton plated fabrics in relation to fibre linear density and yarn type. Fash. Text. 2015, 2, 16. [Google Scholar] [CrossRef]
Figure 1. Three-dimensional hybrid mesh on a textile–surface assembly.
Engproc 51 00027 g001
Figure 2. IR measurements (left) and ROI (right).
Engproc 51 00027 g002
Figure 3. ROI simulation.
Engproc 51 00027 g003
Table 1. Thermal parameters of pure polyester.
MaterialThermal
Conductivity λ
Thermal
Absorptivity
Thermal ResistanceHeat Flax Density
Pure Polyester0.05 W/mK47.5 ± 2.02
W/m2K
27.74 ± 0.63
Km2/W
0.0088 ± 0.00025
W/m2
Disclaimer/Publisher’s Note: The statements, opinions and data contained in all publications are solely those of the individual author(s) and contributor(s) and not of MDPI and/or the editor(s). MDPI and/or the editor(s) disclaim responsibility for any injury to people or property resulting from any ideas, methods, instructions or products referred to in the content.

