Proceeding Paper

Bimodal Active Shape Models for Cervical Vertebrae and Spinal Canal Boundary Extraction †

by
Meletios Liaskos
1,
Michalis A. Savelonas
2,*,
Pantelis A. Asvestas
1 and
George K. Matsopoulos
3
1
Department of Biomedical Engineering, University of West Attica, 12243 Athens, Greece
2
Department of Computer Science and Biomedical Informatics, University of Thessaly, 35131 Lamia, Greece
3
Department of Electrical and Computer Engineering, National Technical University of Athens, 15780 Athens, Greece
*
Author to whom correspondence should be addressed.
Presented at the Advances in Biomedical Sciences, Engineering and Technology (ABSET) Conference, Athens, Greece, 10–11 June 2023.
Eng. Proc. 2023, 50(1), 1; https://doi.org/10.3390/engproc2023050001
Published: 26 October 2023

Abstract

:
Cervical spine pathologies often stem from deformations of the intervertebral discs and spinal canal. This work introduces a computational method for boundary extraction of these structures. The proposed method employs an active shape model (ASM) and is bimodal, in the sense that computed tomography (CT) images are used for ASM training and magnetic resonance (MR) images are used for ASM testing. The proposed method is less dependent on large amounts of training samples than deep learning methods, whereas it involves limited user intervention. Still, it is comparable to state-of-the-art methods in terms of segmentation quality, as demonstrated in our experimental comparisons.

1. Introduction

The human cervical spine consists of the first seven vertebrae. Pathologies of adjacent structures include intervertebral disc (IVD) herniation and spinal canal (SC) stenosis. These conditions are associated with lower back and neck pain. Magnetic resonance imaging (MRI) is the modality of choice for assessing the soft tissues, such as IVD and SC, whereas computed tomography (CT) is preferable for vertebrae imaging. The extraction of the boundaries of these structures is an important step for assessing such conditions.
The most common modality for the imaging of degenerative discs is MRI, due to its superiority for soft-tissue anatomical structures [1]. On the other hand, computed tomography (CT) is often used for vertebrae and hard tissue imaging [2,3,4]. Some bimodal methods, i.e., methods analyzing both MRI and CT data, have appeared in the literature. Although these methods benefit from complementary information provided by the two different modalities, in clinical practice it is rare to have both CT and MRI data acquired from the same patient.
There is a large amount of spinal cord segmentation methods based on the dependency of spinal diseases and the shapes of anatomical structures. Chen et al. [5] proposed a method that uses deformable atlas and topology constraints to extract the boundaries of the cervical and thoracic vertebrae from C1-C5 and C1-T4, respectively, when applied on T1- and T2-weighted MR images. Yiannakas et al. [6] evaluated a fully automated active surface-based method for boundary extraction of the cervical cord, when applied on T1-weighted MRI. Lemay et al. [7] proposed a method for tumor boundary extraction on the cervical spinal cord. Among three types of tumors, namely, astrocytomas, ependymomas, and hemangioblastomas, a cascaded U-Net-based architecture is applied in two-stages for localization and labelling. Koh et al. [8] combined active contours with a saliency-driven attention model for spinal canal localization. Asman et al. [9] proposed a multi-atlas framework for cervical spinal cord segmentation. Zhang et al. [10] adopted a neural network architecture, which is called SeUneter and is similar to U-Net. Their method extracts the boundaries of three structures: SC, vertebrae, and IVD. Moreover, Al Arif et al. [11] proposed a fully automatic method for cervical vertebrae boundary extraction, which is applied on X-ray images and is based on fully convolutional networks (FCN) and the UNet—UNet-S framework. Sahar et al. [12] employed a method based on k-means clustering in order to extract the boundaries of the thoracolumbar spinal cord and the vertebrae canal on T2-weighted MRI images.
In this work, we propose a bimodal active shape model (ASM)-based method for IVD and SC boundary extraction in the area of cervical vertebrae, from C3 to C7. The statistics of vertebrae shapes on CT images are used to train the ASM. The trained ASM is applied on each T2-weighted MR image, for IVD/SC boundary extraction. A dataset of CT images is used for ASM training, whereas datasets of T1- and T2-weighted MR images are used for evaluating the proposed method. Sagittal slices are used both from CT and MR images. Experimental comparisons with state-of-the-art methods are performed on a publicly available MR image dataset.
The rest of this article consists of four sections. Section 2 presents the materials and methods employed; Section 3 presents the experimental evaluation of the proposed method, including comparisons with state-of-the-art methods; Section 4 discusses the potential impact on health; and Section 5 summarizes the main conclusions of this work.

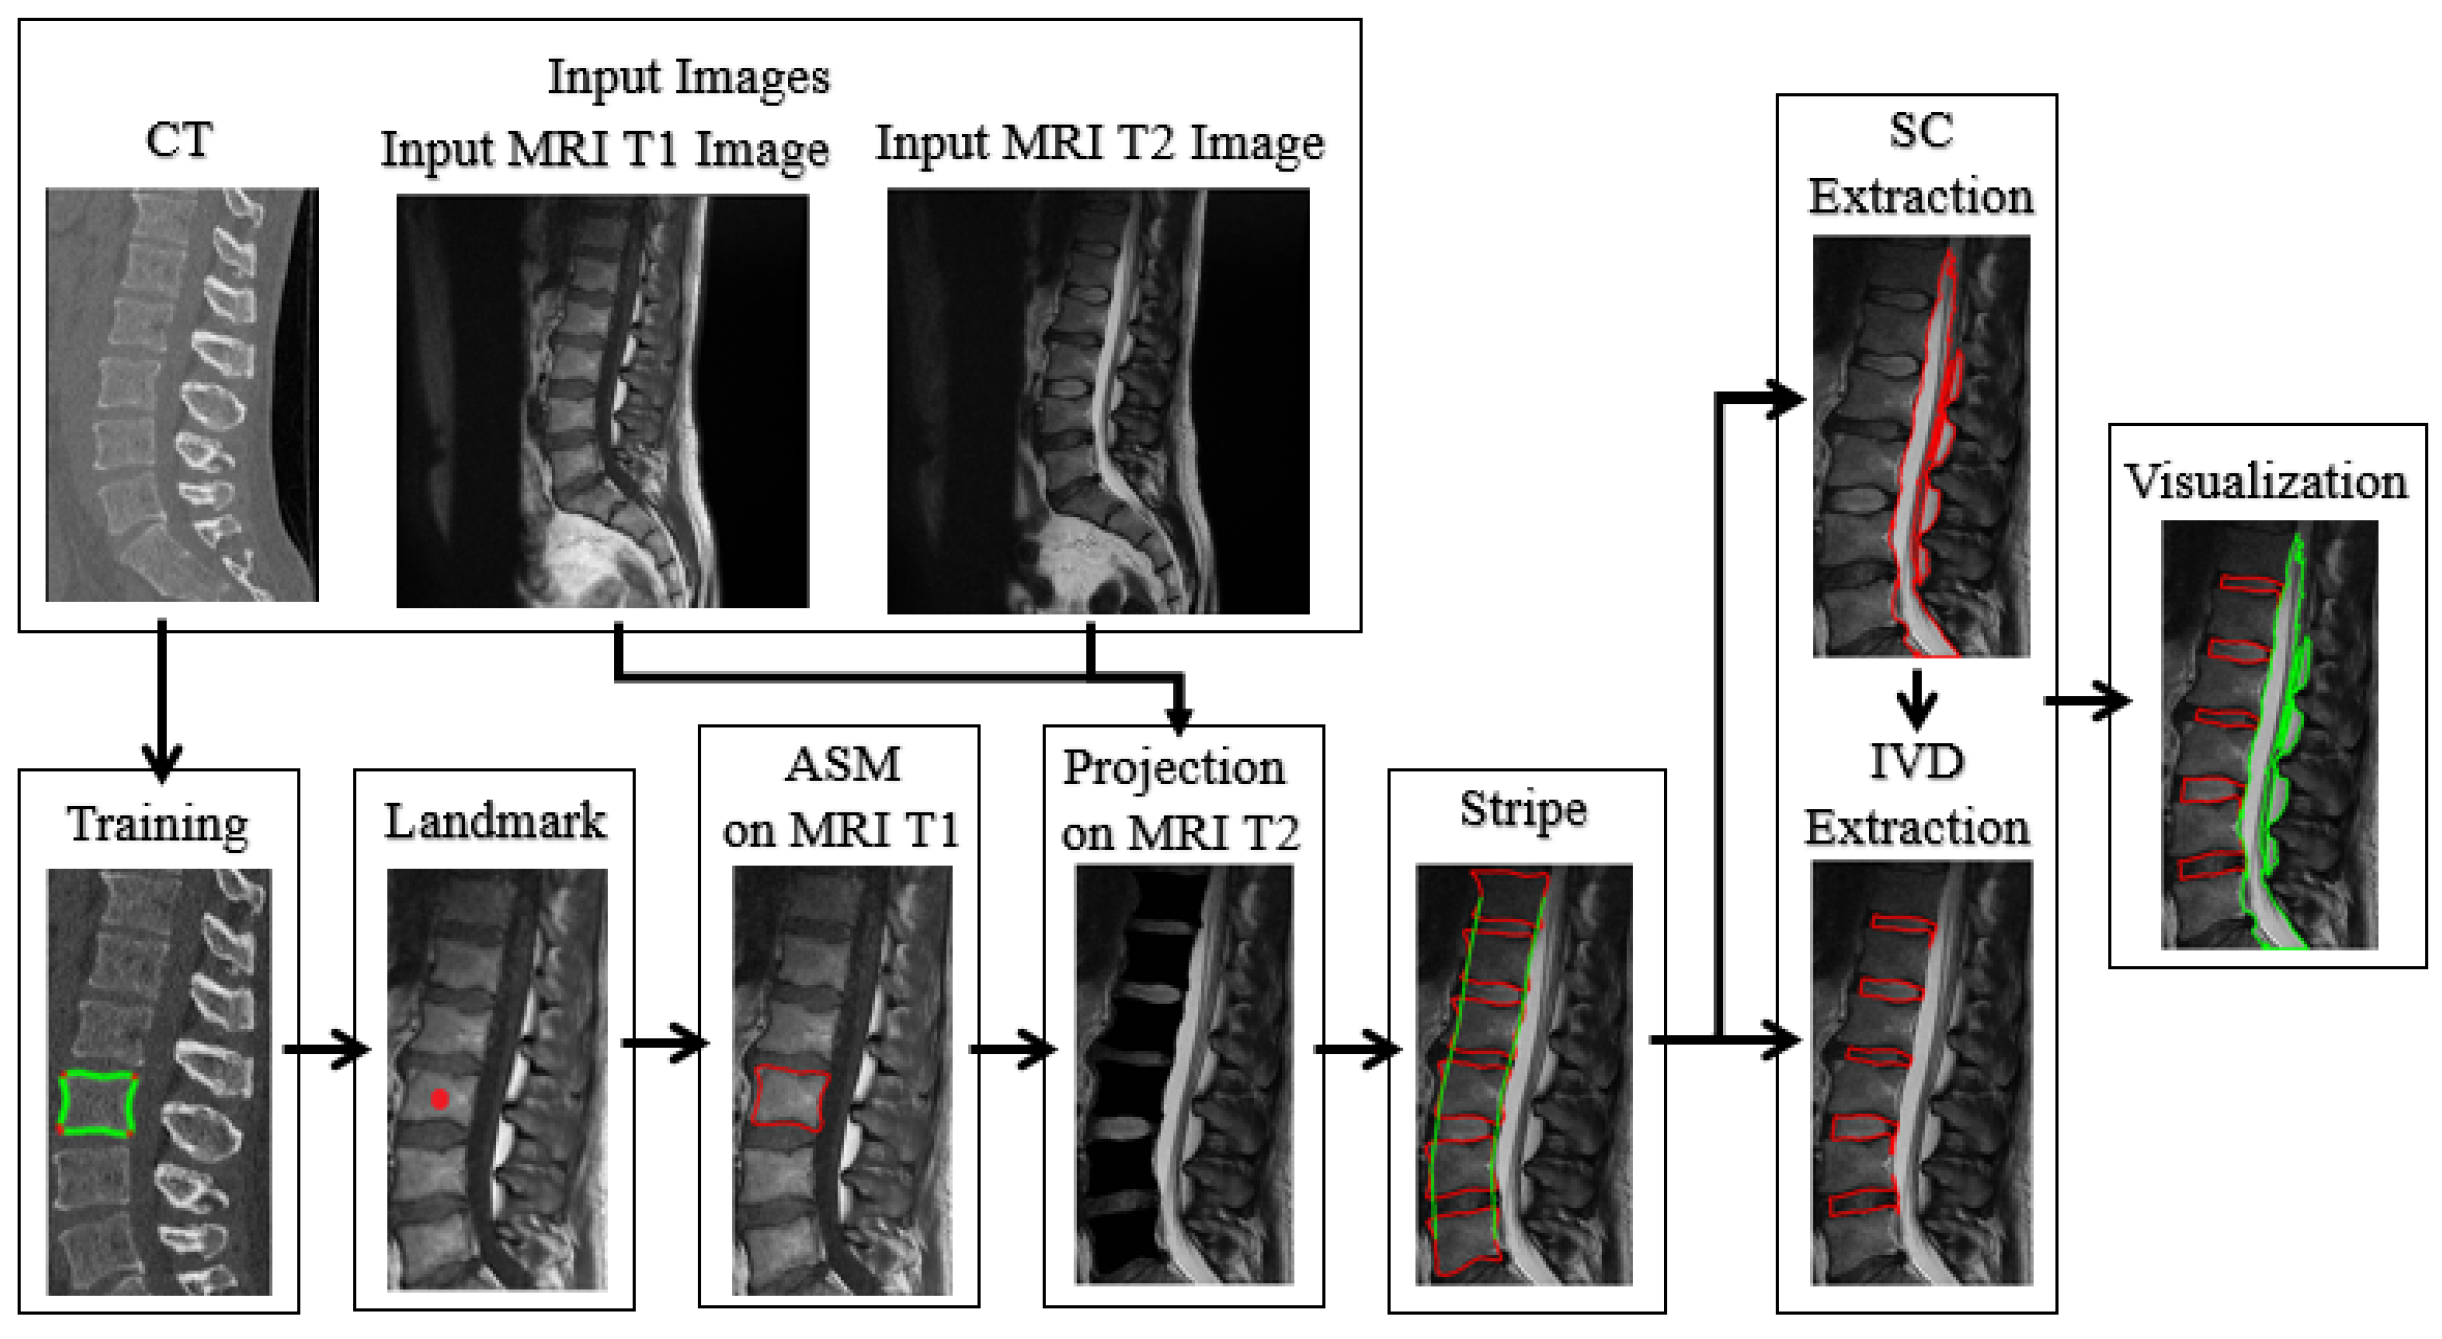
2. Material and Methods

The proposed method uses sagittal images from two modalities in order to extract vertebrae, SC, and IVD boundaries. For this, vertebrae shape statistics are extracted from a training set of CT images and are encoded by means of an ASM model. The shape information is transferred to MR images. This process facilitates an accurate extraction of vertebrae borders on T1-weighted images. In addition, the extracted vertebrae boundaries are used to guide subsequent steps of SC and IVD boundary extraction. The proposed method consists of three main stages: (1) ASM training on CT sagittal cervical images in order to obtain a model that is informed on the statistics of vertebrae shapes, (2) ASM adjustment on T1-weighted MR images and projection on T2-weighted images, and (3) SC and IVD boundary extraction. Figure 1 illustrates the pipeline of the proposed method.

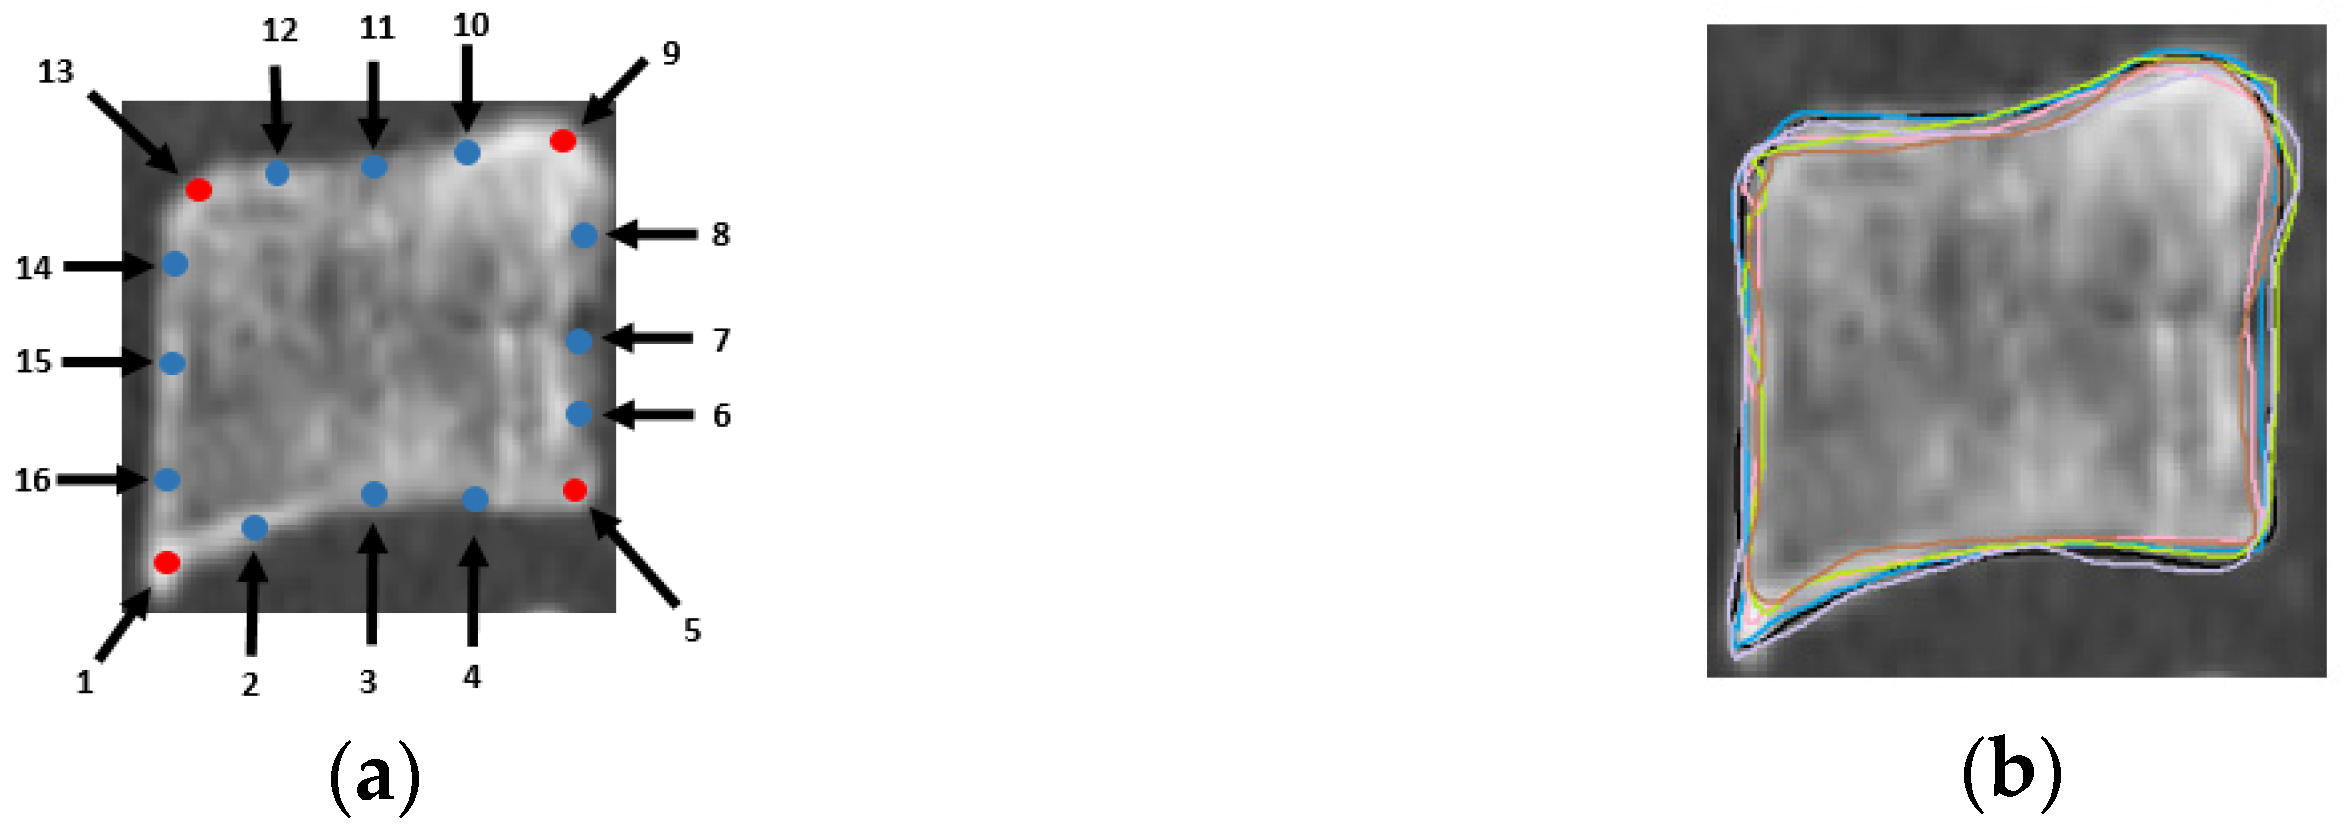
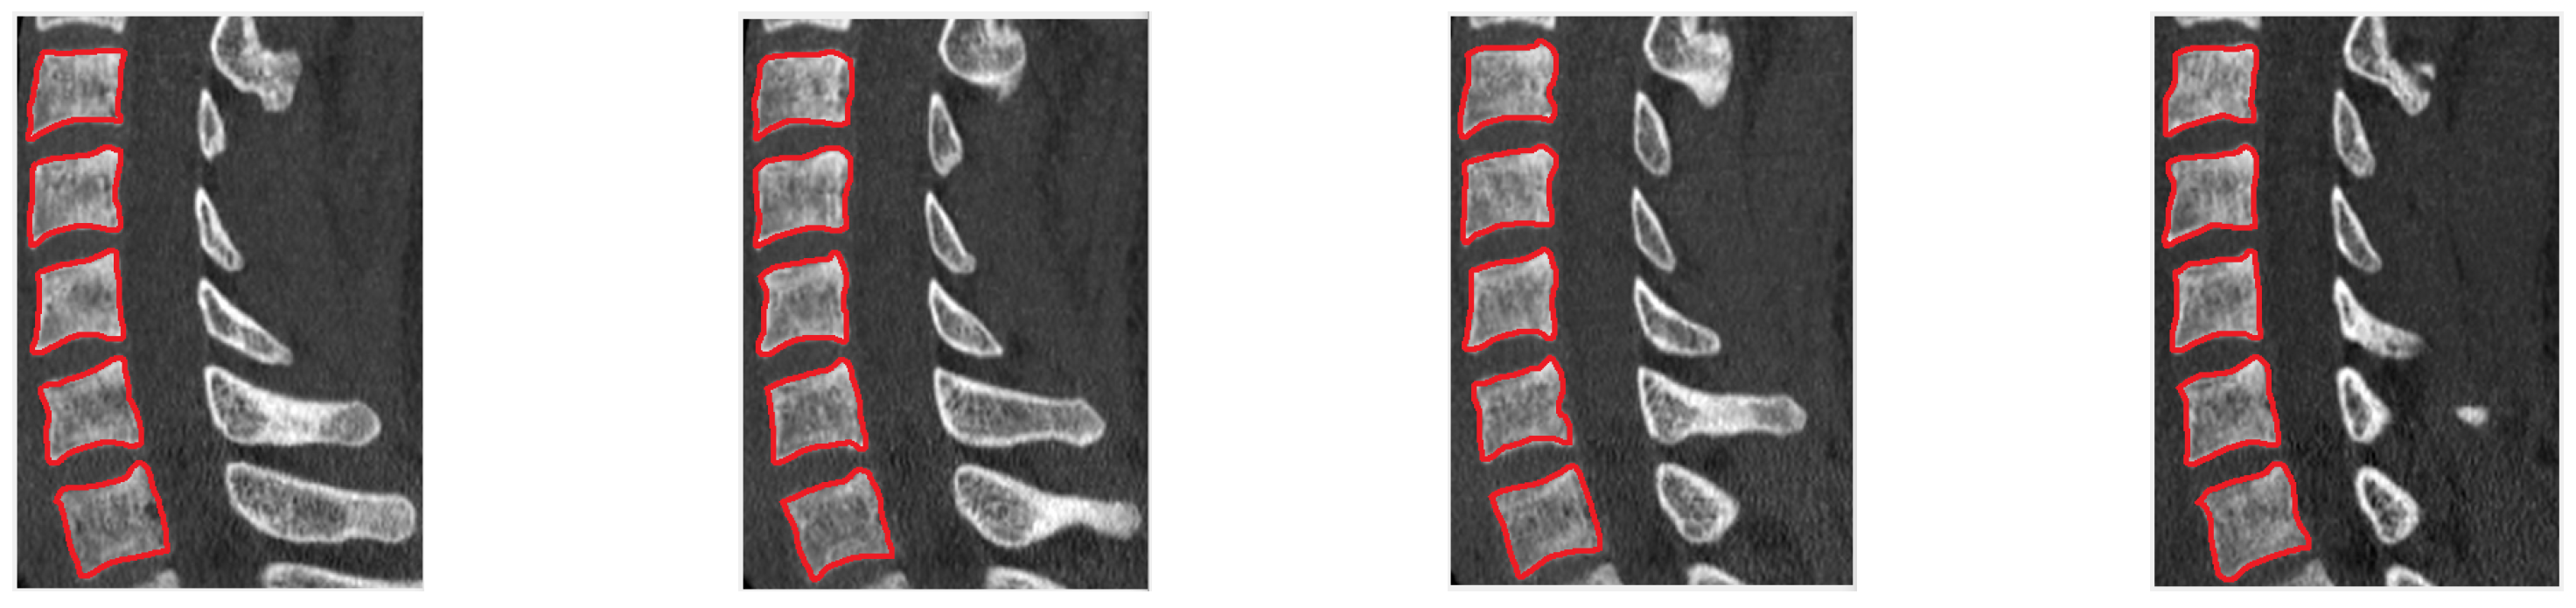
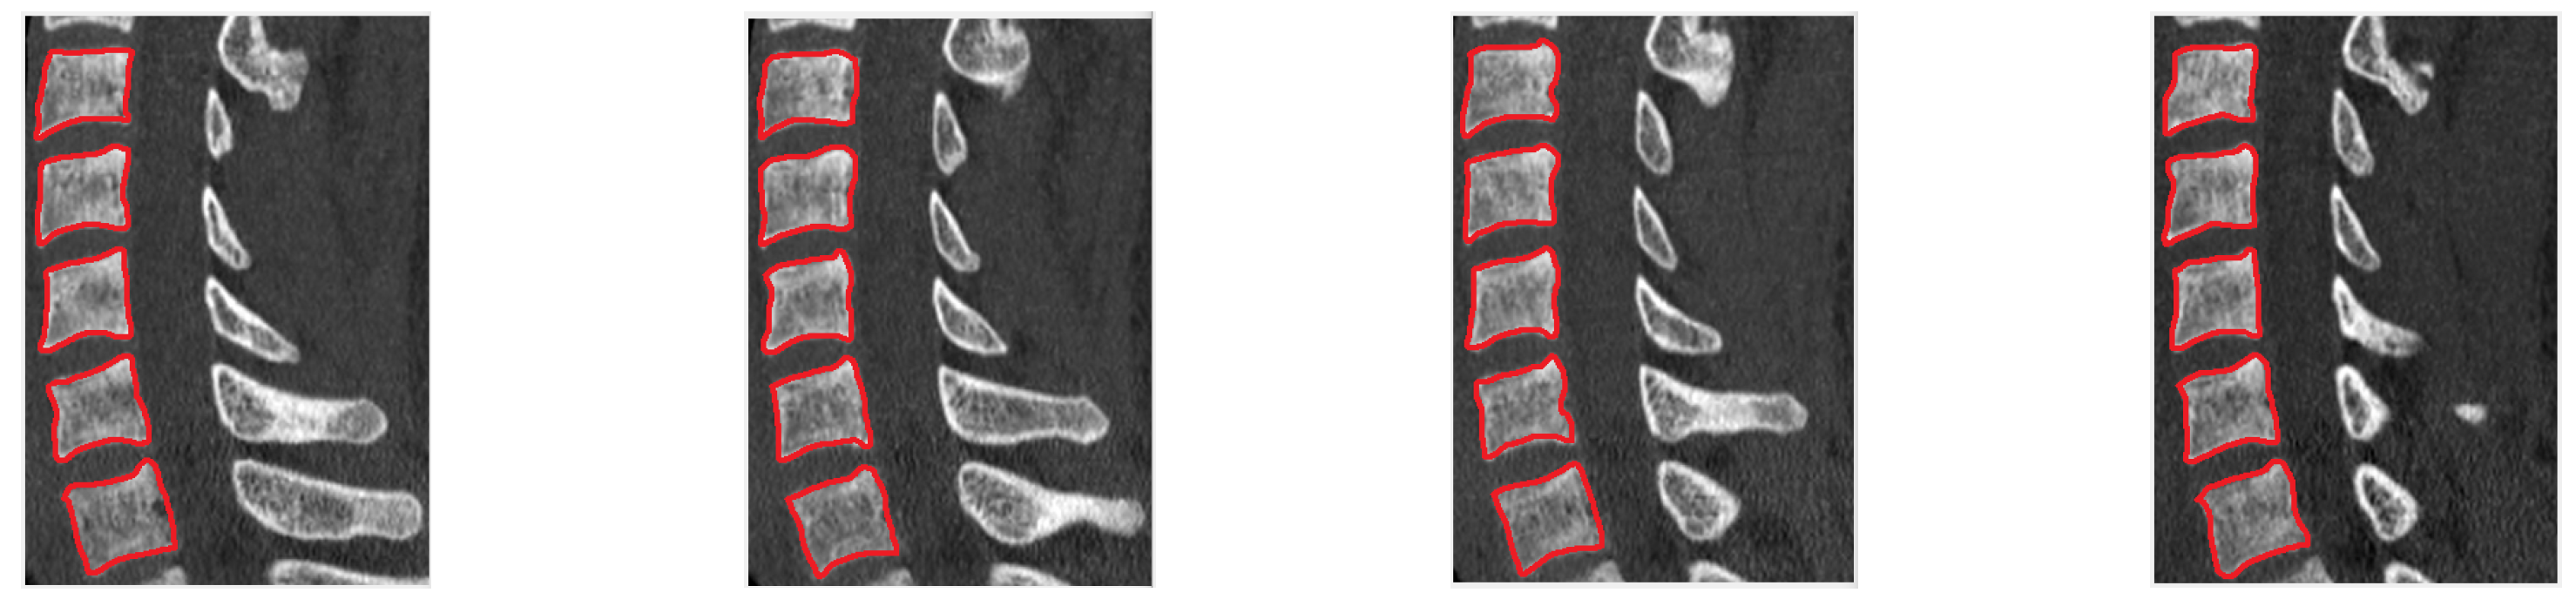
2.1. ASM Training on CT Sagittal Cervical Images

ASMs are statistical models of shape, which are established as a robust approach employing prior knowledge for boundary extraction of rigid objects, in the presence of noise, clutter, and occlusion [13]. ASMs are defined by learning patterns of variability from a training set of objects of the same class, outlined by sets of reference points. In the context of the proposed method, each shape model is trained by sagittal CT images, each one with 5 cervical vertebrae from C3 to C7. The annotation of each training CT image was performed by an expert radiologist, who marked each one of the four vertebrae corners with a reference point, as well as twelve more reference points (Figure 2). Figure 3 illustrates manually derived vertebrae delineations with red.

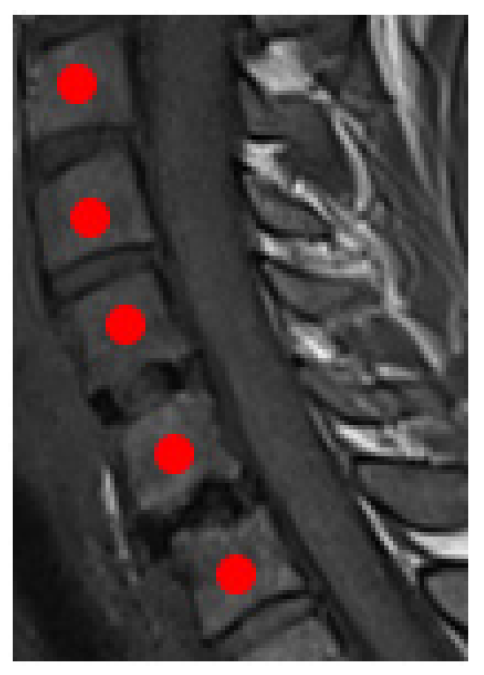
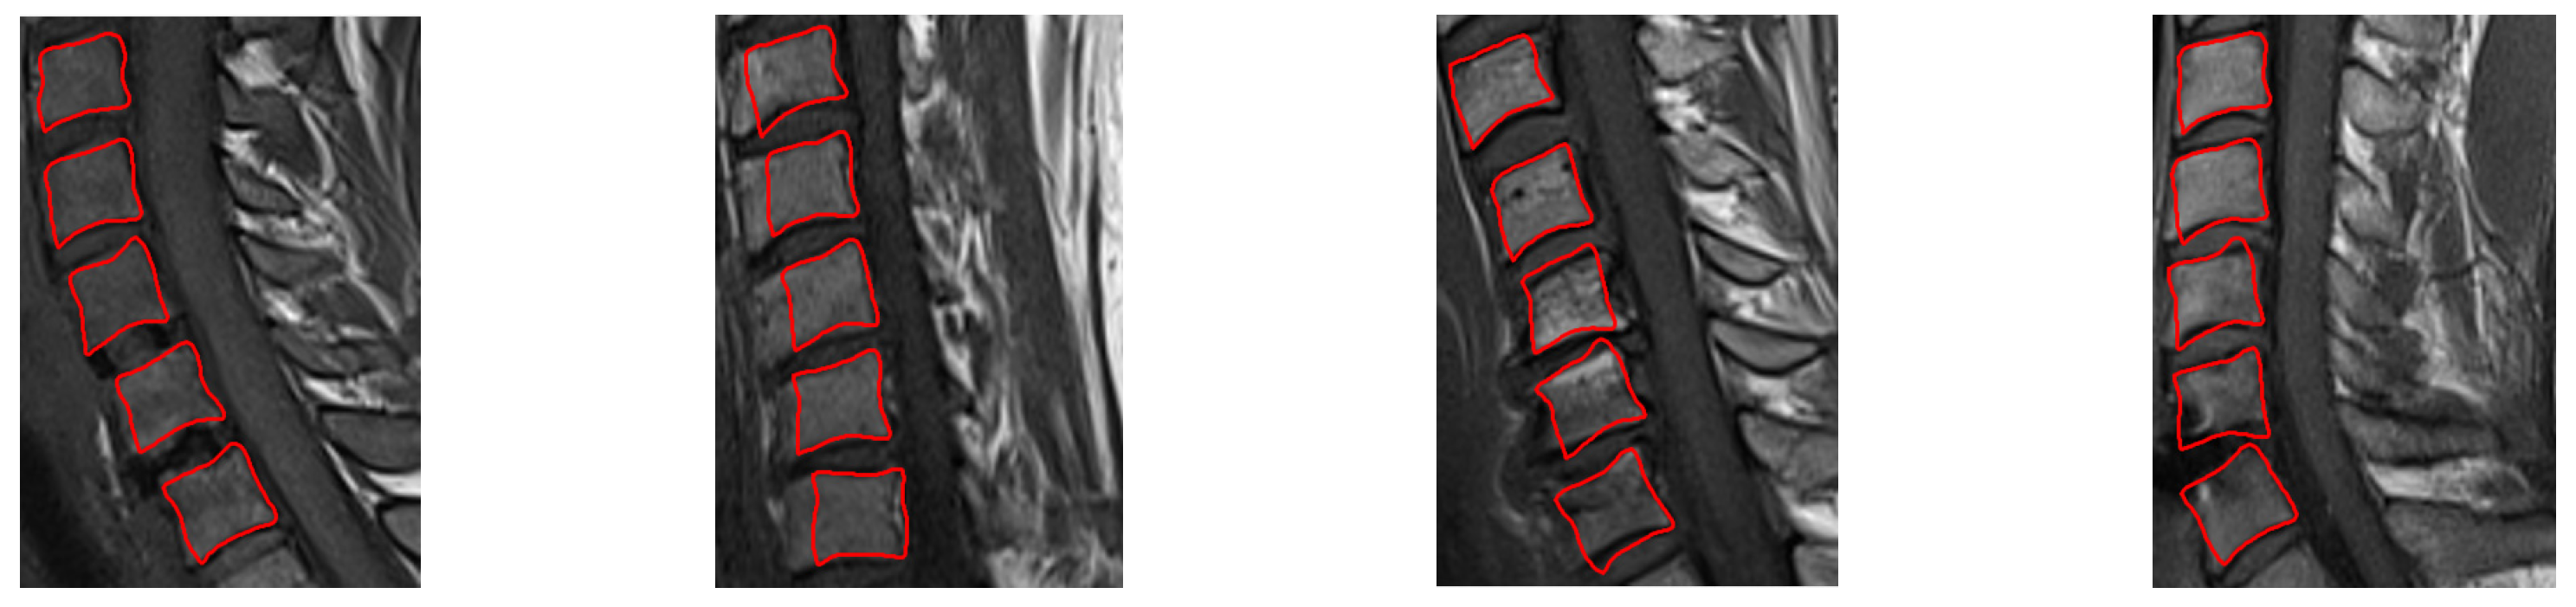
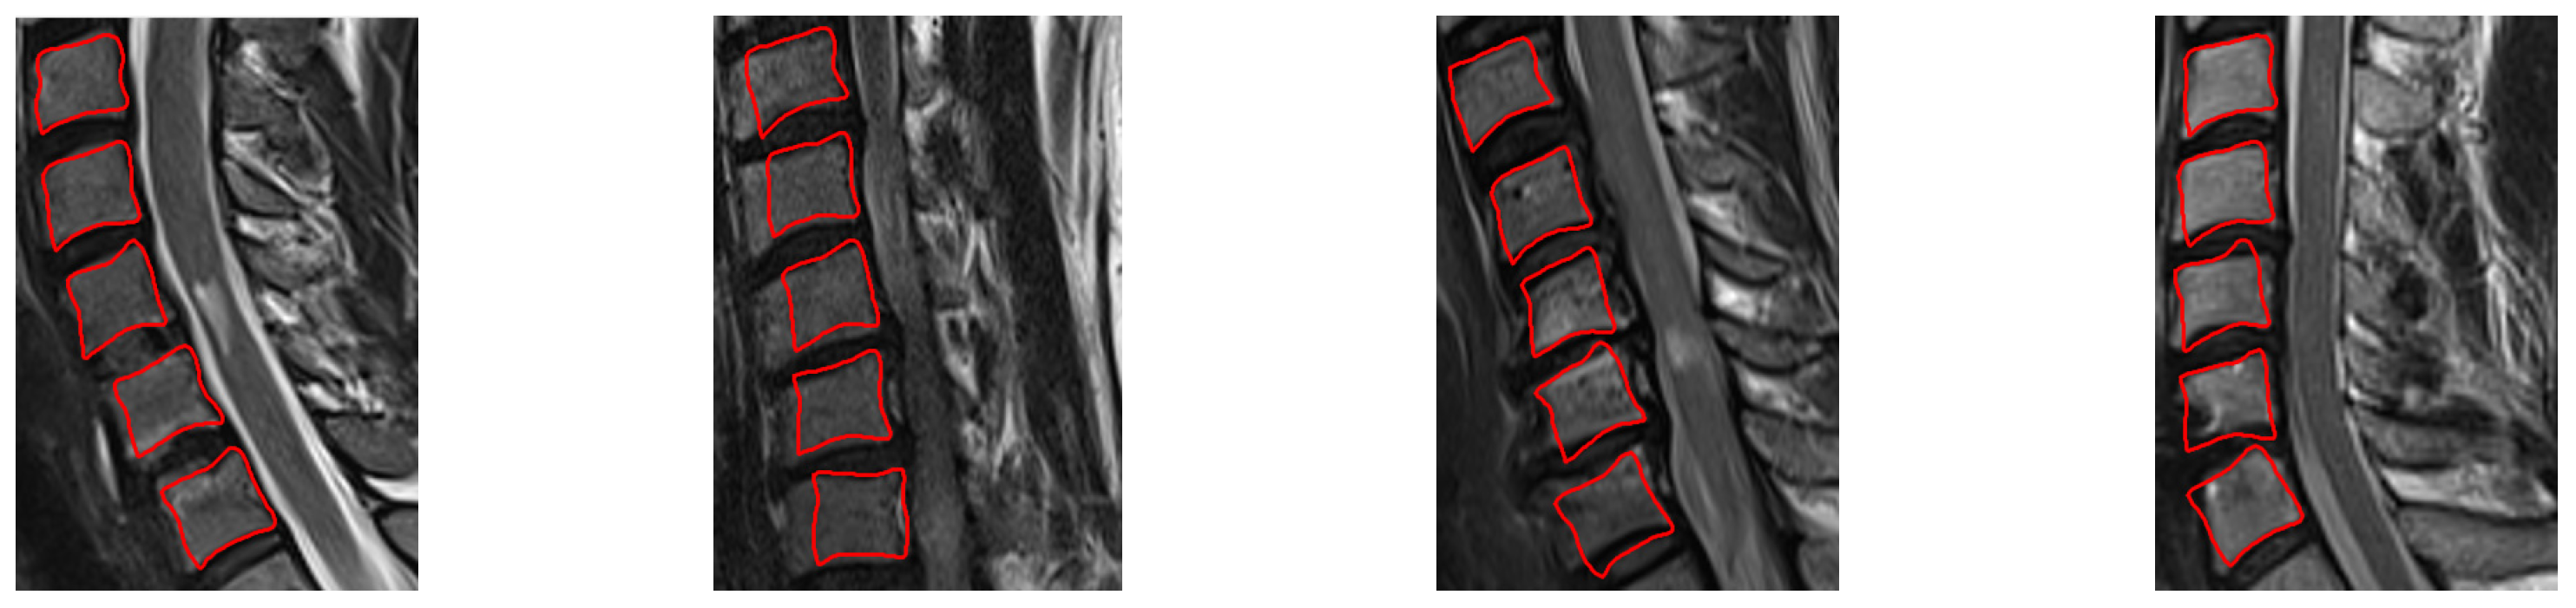
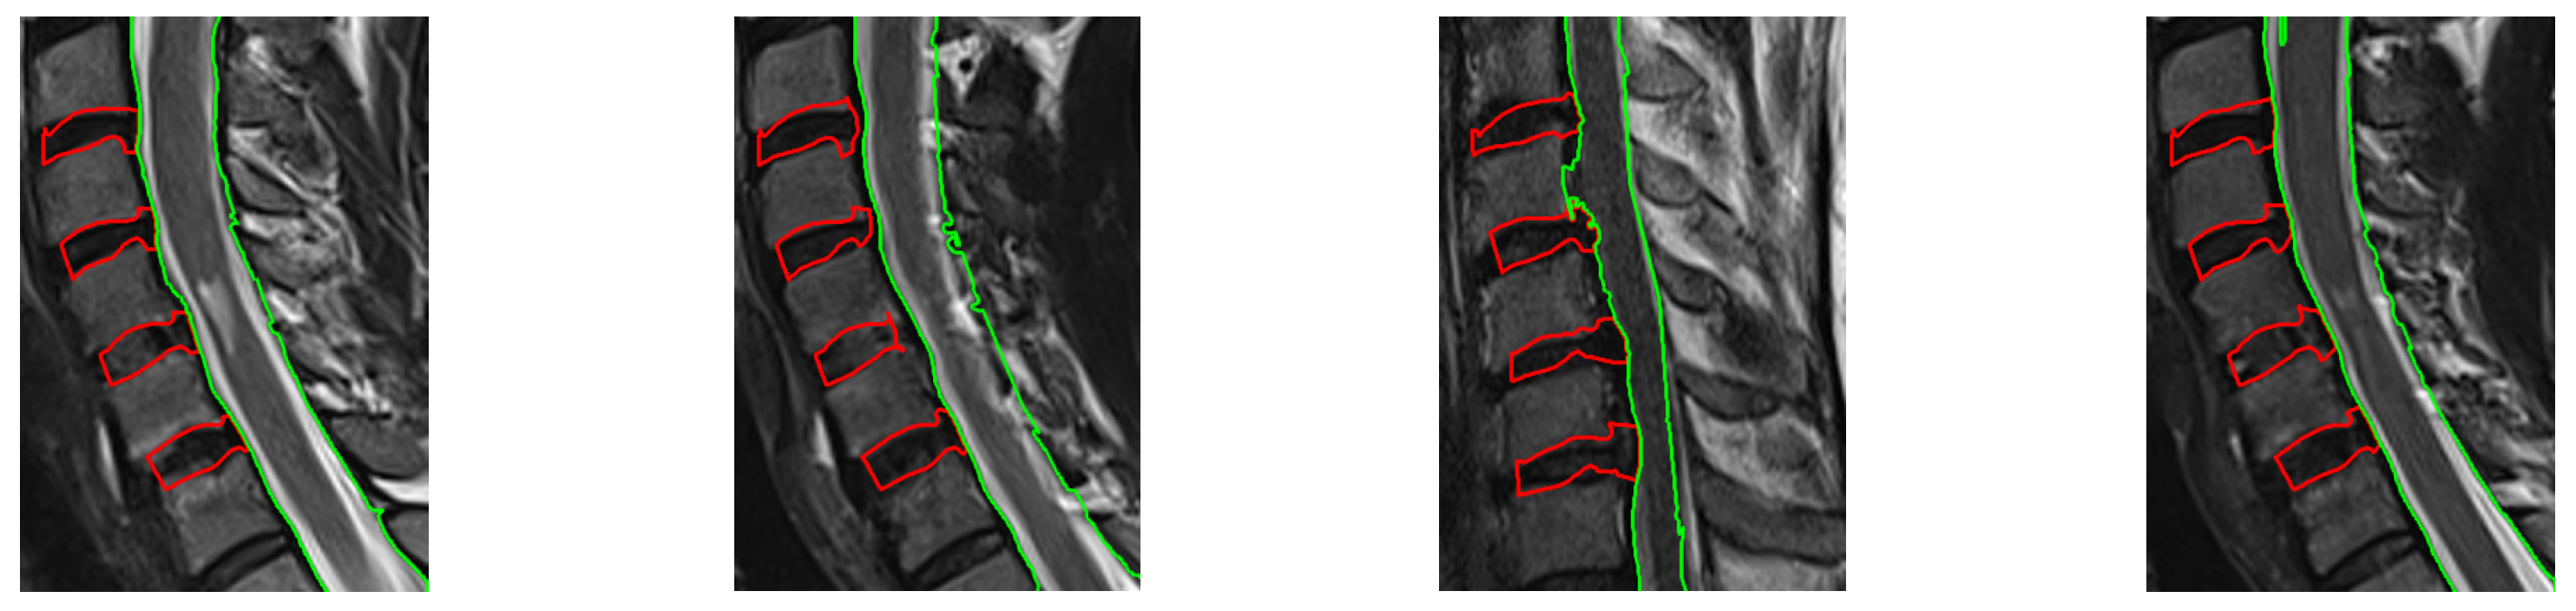
2.2. ASM Positioning on T1-Weighted MR and Transfer to T2-Weighted MR Image

The sagittal T1-weighted MR images are resized. Each one of the 5 CT-trained ASMs, which represent shapes from C3 to C7, is subsequently applied on the respective T1-weighted MR image. Although these two modalities differ, they are similar with respect to the gray levels surrounding vertebrae boundaries. This similarity enables the cross-modal application of ASMs, taking into account that these models are guided by intensity gradients [14]. Aiming to further increase gray level similarity, all images are linearly normalized with respect to gray levels. In addition, gray-level normalization aids discriminating vertebrae boundaries from IVDs. As a next step, vertebrae centers are extracted on sagittal CT images and projected on T1-weighted MR images. The projected centers are used as references to localize each ASM in the respective T1-weighted MR image (Figure 4). Figure 5 presents example results of the ASM application on T1 MR images.
The vertebrae contours are projected from T1-weighted to T2-weighted MR images, in order to aid the subsequent SC and IVD boundary extraction. These two anatomical structures are better visualized on T2-weighted MR images, due to their high water concentration. This projection is straightforward, since the respective T1 and T2 images are already registered, as dictated by the MR image acquisition protocol (Figure 6).

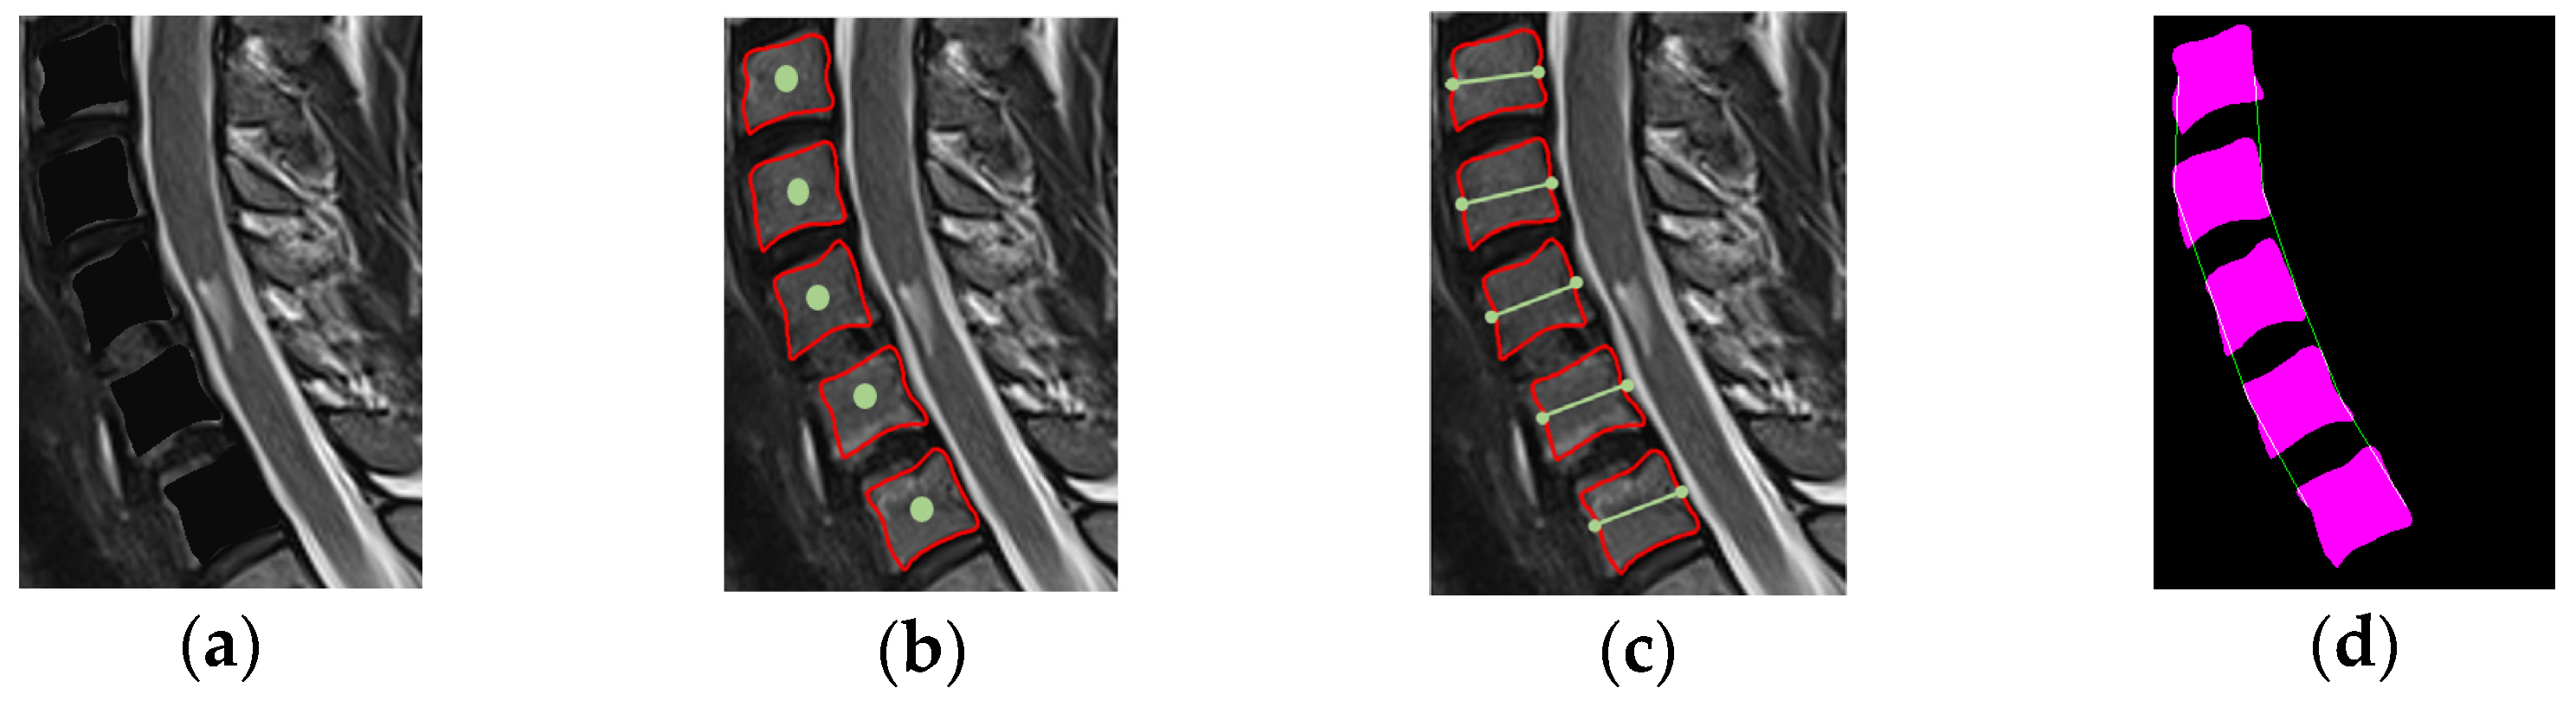
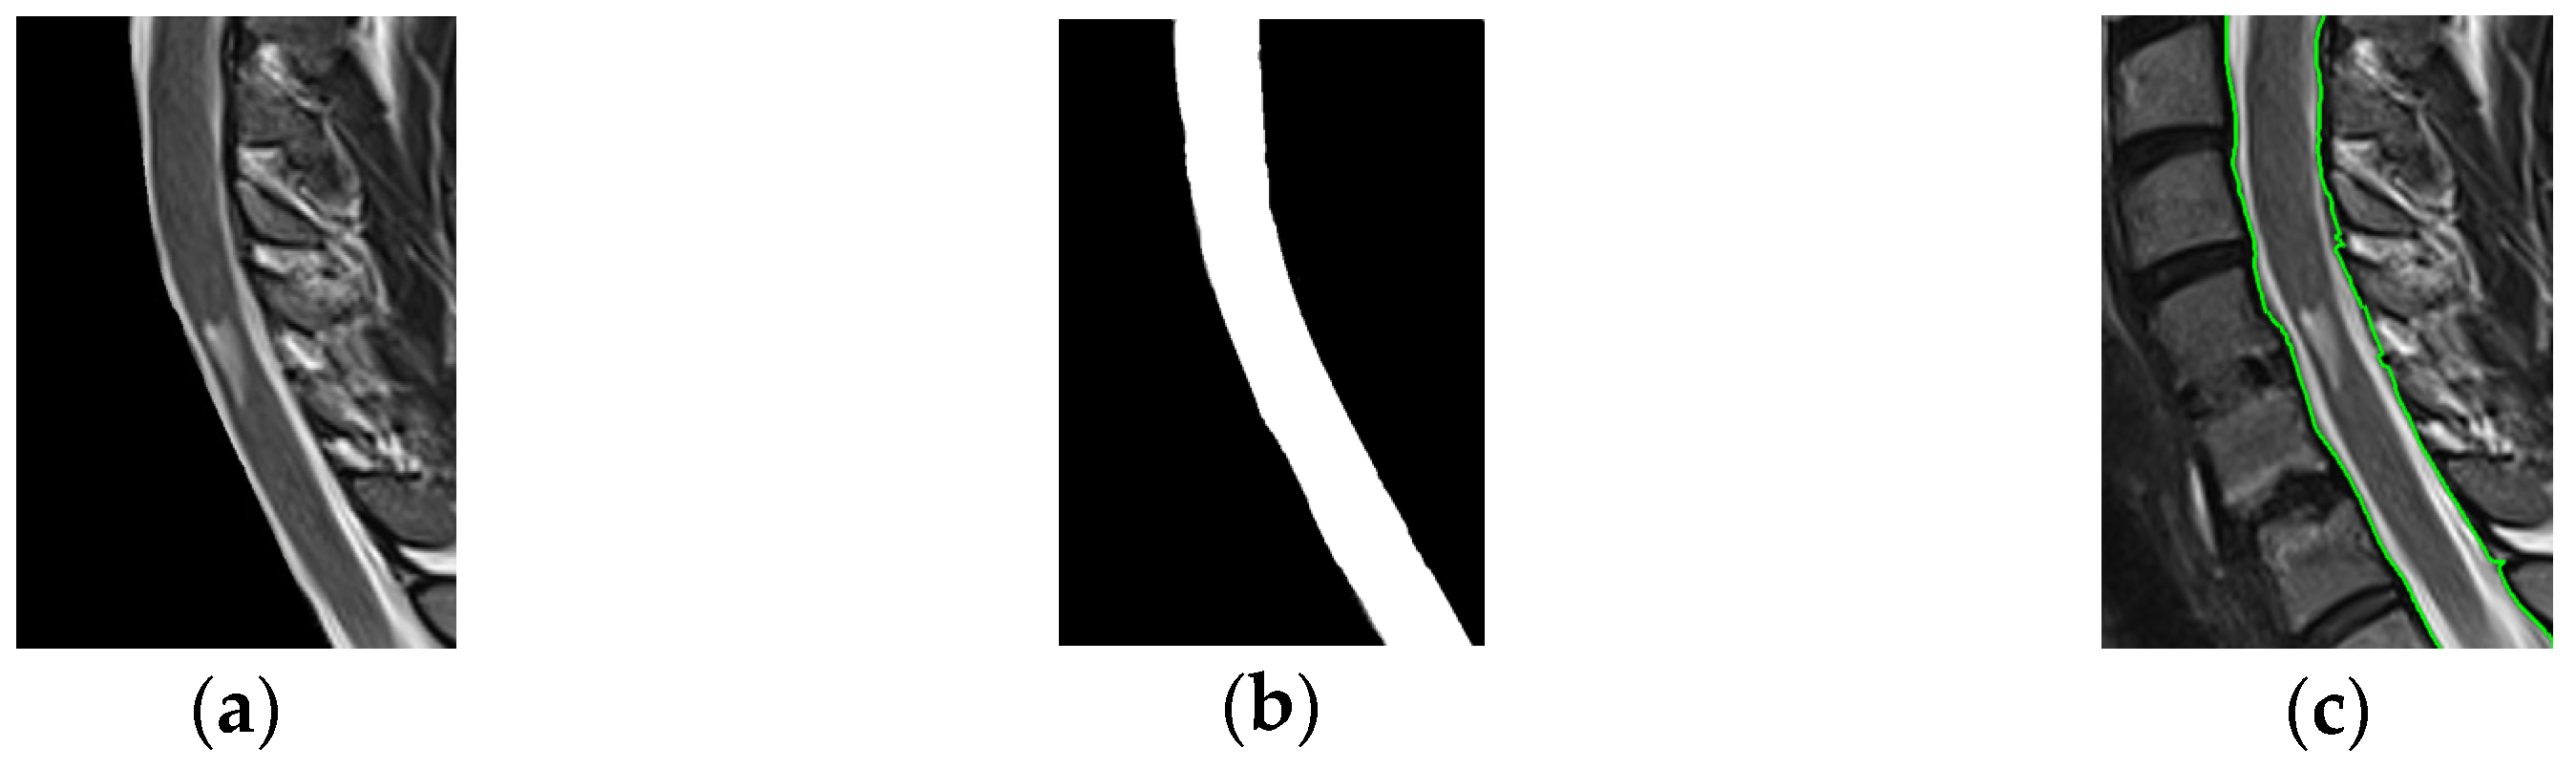
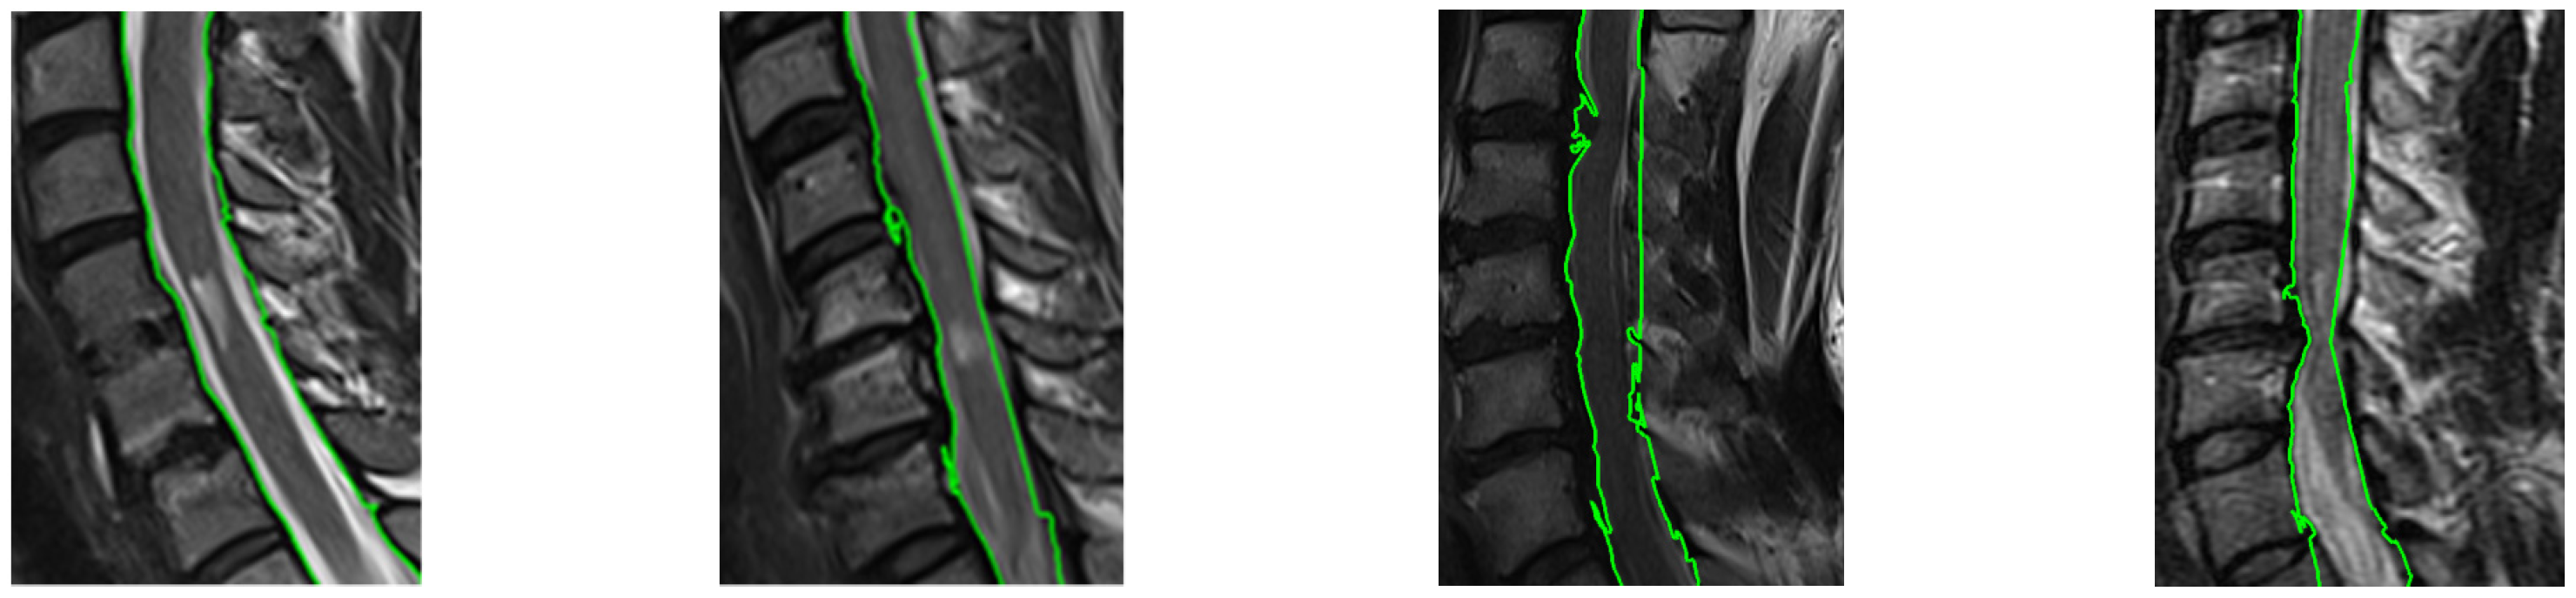
2.3. SC and IVD Boundary Extraction

In this stage, the vertebrae boundaries extracted from each T2-weighted image are used to guide the subsequent extractions of SC and IVD boundaries, taking into account that these structures are adjacent (Figure 7a). A stripe outlining the spinal cord is derived: starting from the 6 vertebrae contours, a contour-defined center is determined (Figure 7b), and two points are identified in the left and right side of each vertebra (Figure 7c). These reference points are connected with linear interpolation to derive the stripe outlining the spinal cord shape (Figure 7d). The regions at the left of the stripe are discarded (Figure 8a). Otsu thresholding with 3 gray levels is employed to extract the SC contour (Figure 8b). Taking into account that the SC is located at the left side of this stripe, the SC boundaries are identified (Figure 9).
The pipeline ends with IVD boundary extraction. This is obtained by subtracting the vertebrae bodies and SC (Figure 10).

3. Experimental Evaluation

3.1. Datasets

The proposed method is applied on six sets of MR images, with 20 sagittal images, using different scanners of pixel size within a range of 0.4688–0.6875 mm, and slice thickness of 3 mm. ASM training is performed on a CT dataset with 15 sagittal images. These CT images have a pixel size and slice thickness of 0.33 mm and 1.50 mm, respectively, and are used as reference for vertebrae boundary extraction. Both CT and MR image datasets are anonymized and obtained from the files of the “Tzaneio” public hospital in Peiraeus, Greece.

3.2. Evaluation Metrics

The ground truth for all CT and MR images used in the experiments was obtained by an expert radiologist, who performed manual annotations of the structures of interest. As evaluation metrics, we used Dice similarity coefficient (DSC) [15] and Hausdorff distance (HD) [16]. Both metrics compare the structure delineated by the proposed method and the ground truth structure: DSC depends on the number of common pixels, whereas HD is derived from distances of all pairs of pixels. Let  S g  and  S t  be the binary images defining the structure as delineated by the proposed method and the ground truth structure, respectively. In both images, the pixels of the structures are set to 1 and the rest are set to 0. Let also  X g  and  Y t  be the boundaries of structures in  S g  and  S t , respectively. DSC is defined as follows:
D S C S g , S t = 2 S g S t S g + S t
where  S g  and  S t  are the total vertebral and IVD regions,           denotes the number of pixels with value 1, and  S g S t  is the intersection of the two structures. DSC increases with similarity. HD is defined as follows:
H D ( X g , Y t ) = m a x s u p x X g i n f y Y t d ( x , y ) , s u p y Y t i n f x X g d ( x , y )
where  X  and  Y  are the boundaries compared. HD represents the proximity between two closed boundaries. It measures the maximal distance between any point of one boundary to the other boundary.

3.3. Results

Table 1, Table 2 and Table 3 present experimental comparisons between the proposed method and other state-of-the-art methods for vertebrae, IVD, and SC boundary extraction, respectively. It can be noted that, with respect to vertebrae boundary extraction, the proposed method obtains segmentation quality that is comparable or higher to various instances of the method of Al Arif et al. [11] and Zhang et al. [10] (Table 1), which encompass different neural network architectures. Similarly, the proposed method obtains segmentation quality which is comparable or higher to various instances of the method of Zhang et al. [10], with respect to IVD boundary extraction (Table 2). Finally, the proposed method obtains segmentation quality which is comparable or higher to various instances of the methods of Zhang et al. [10] and Sahar et al. [12], with respect to SC boundary extraction (Table 3). Each comparison is performed using the metrics employed in the respective original works. Figure 11 illustrates examples of superimposed IVD and SC boundaries extracted for different patients.

4. Discussion

Overall, the results presented in the previous section show that the proposed method extracts vertebrae, IVD, and SC boundaries with an accuracy which is comparable or higher to the accuracy obtained by state-of-the-art methods encompassing different neural network architectures. Accordingly, the proposed method could have a considerable impact on the diagnosis and treatment of cervical spine pathologies, aiding clinicians towards more informed decisions on treatment options. In addition, the proposed method is less dependent on large amounts of training samples than deep learning methods, and thus could be more accessible to healthcare institutions with limited resources. Moreover, it involves limited user intervention, facilitating the incorporation of this technology into the workflow of clinicians and radiologists, as well as accelerating the analysis process and reducing the risk of human error. Finally, the concurrent visualization of boundaries obtained aids the diagnosis of several spinal cord pathologies.

5. Conclusions

In this work, we propose a bimodal active shape model (ASM)-based method for IVD and SC boundary extraction in the area of cervical vertebrae, from C3 to C7. The statistics of vertebrae shapes on CT images are used to train the ASM. The trained ASM is applied on each T2-weighted MR image. A dataset of CT images is used for ASM training, whereas datasets of T1- and T2-weighted MR images are used for evaluating the proposed method. Sagittal slices are used both from CT and MR images. Experimental comparisons with state-of-the-art methods are performed on an MR image dataset. The results show that the proposed method extracts vertebrae, IVD, and SC boundaries with an accuracy which is comparable or higher to the accuracy obtained by state-of-the-art methods encompassing different neural network architectures. Future perspectives of this work include potential hybrid approaches, relying on ASMs guiding neural network-based segmentation.

Author Contributions

Methodology, M.L., M.A.S., P.A.A. and G.K.M.; software, M.L.; writing, M.L. and M.A.S.; supervision, G.K.M. All authors have read and agreed to the published version of the manuscript.

Funding

This research received no external funding.

Institutional Review Board Statement

All procedures performed in studies involving human participants were in accordance with the ethical standards of the institutional and/or national research committee and with the 1964 Helsinki Declaration and its later amendments or comparable ethical standards.

Informed Consent Statement

Informed consent was obtained from all individual participants included in the study.

Data Availability Statement

The data presented in this study are available on request from the corresponding author. The data are not publicly available due to the fact that this work is part of ongoing research.

Conflicts of Interest

The authors declare no conflict of interest.

References

  1. Emch, T.; Modic, M. Imaging of lumbar degenerative disk disease: History and current state. Skelet. Radiol. 2011, 40, 1175–1189. [Google Scholar] [CrossRef] [PubMed]
  2. Huang, J.; Jian, F.; Wu, H.; Li, H. An improved level set method for vertebra CT image segmentation. Biomed. Eng. Online 2013, 12, 48. [Google Scholar] [CrossRef] [PubMed]
  3. Castro, I.M.J.; Pereañez, P.M.M.; Lekadir, K.; Lazary, A.; Frangi, A.F. Statistical interspace models (SIMs): Application to robust 3D spine segmentation. IEEE Trans. Med. Imaging 2015, 34, 1663–1675. [Google Scholar] [CrossRef] [PubMed]
  4. Zheng, G.; Chu, C.; Belavý, D.L.; Ibragimov, B.; Korez, R.; Vrtovec, T.; Hutt, H.; Everson, R.; Meakin, J.; Andrade, I.L. Evaluation and comparison of 3D intervertebral disc localization and segmentation methods for 3D T2 MR data: A grand challenge. Med. Image Anal. 2017, 35, 327–344. [Google Scholar] [CrossRef] [PubMed]
  5. Chen, M.; Carassa, A.; Ohb, J.; Nairc, G.; Phamd, L.D.; Reichb, S.D.; Princea, L.J. Automatic magnetic resonance spinal cord segmentation with topology constraints for variable fields of view. Neuroimage 2013, 83, 1051–1062. [Google Scholar] [CrossRef] [PubMed]
  6. Yiannakas, M.C.; Mustafa, A.M.; Leener, B.; Kearney, H.; Tur, C.; Altman, D.R.; Angrlis, F.; Plantone, D.; Ciccarelli, O.; Miller, H.D.; et al. Fully automated segmentation of the cervical cord from T1-weighted MRI using PropSeg: Application to multiple sclerosis. NeuroImage Clin. 2016, 10, 71–77. [Google Scholar] [CrossRef] [PubMed]
  7. Lemay, A.; Gros, C.; Zhuo, Z.; Zhang, J.; Duan, Y.; Cohen, A.J.; Liu, Y. Automatic Multiclass Intramedullary Spinal Cord Tumor Segmentation on MRI with Deep Learning. NeuroImage Clin. 2021, 31, 102766. [Google Scholar] [CrossRef]
  8. Koh, J.; Scott, D.P.; Chaudhary, V.; Dhillon, G. An automatic segmentation method of the spinal canal from clinical MR images based on an attention model and an active contour model. In Proceedings of the IEEE International Symposium on Biomedical Imaging (ISBI), Chicago, IL, USA, 30 March–2 April 2011. [Google Scholar]
  9. Asman, A.J.; Bryan, W.F.; Smith, S.A.; Reich, S.D.; Landman, A.B. Groupwise multi-atlas segmentation of the spinal cord’s internal structure. Med. Image Anal. 2014, 18, 460–471. [Google Scholar] [CrossRef]
  10. Zhang, X.; Yang, Y.; Shen, Y.W.; Li, P.; Zhong, Y.; Zhou, J.; Zhang, K.R.; Shen, C.Y.; Li, Y.; Zhang, M.F.; et al. SeUneter: Channel attentive U-Net for instance segmentation of the cervical spine MRI medical image. Front. Physiol. 2022, 13, 1081441. [Google Scholar] [CrossRef]
  11. Al Arif, S.M.M.R.; Knapp, K.; Slabaugh, G. Fully automatic cervical vertebrae segmentation framework for X-ray images. Comput. Methods Programs Biomed. 2018, 157, 95–111. [Google Scholar] [CrossRef] [PubMed]
  12. Sahar, S.; Hamed, D.; Seyed, A.H.B.; Ali, K.; Mohammad, A. Fully automatic 3D segmentation of the thoracolumbar spinal cord and the vertebral canal from T2-weighted MRI using K-means clustering algorithm. Spinal Cord 2020, 58, 811–820. [Google Scholar]
  13. Cootes, T.F.; Taylor, C.J.; Cooper, D.H.; Graham, J. Active shape models-their training and application. Comput. Vis. Image Underst. 1995, 61, 38–59. [Google Scholar] [CrossRef]
  14. Mohammed, B.; Saïd, M.; Fabian, L. A framework of vertebrae segmentation using the active shape model-based approach. Int. J. Biomed. Imaging 2011, 2011, 764046. [Google Scholar]
  15. Taha, A.A.; Hanbury, A. Metrics for Evaluation 3D Medical Image Segmentation: Analysis, Selection, and Tool. BMC Med. Imaging 2015, 15, 29. [Google Scholar] [CrossRef] [PubMed]
  16. Huttenlocher, D.; Klanderma, G.; Rucklidge, W. Comparing images using the Hausdorff distance. IEEE Trans. Pattern Anal. Mach. Intell. 1993, 15, 850–863. [Google Scholar] [CrossRef]
Figure 1. Summary of the main stages of the proposed method.
Engproc 50 00001 g001
Figure 2. ASM training: (a) reference points (red), vertebral body landmarks (blue); (b) manually determined vertebral contours.
Engproc 50 00001 g002
Figure 3. Examples of manually derived vertebrae delineations, used for ASM training.
Engproc 50 00001 g003
Figure 4. ASM positioning on MR images: vertebrae centers (red) are projected on MR T1 images.
Engproc 50 00001 g004
Figure 5. An example of ASM application for vertebrae boundary extraction on a T1-weighted MR image.
Engproc 50 00001 g005
Figure 6. ASM results on T2-weighted MR image; the red color represents the vertebrae boundary.
Engproc 50 00001 g006
Figure 7. (a) The vertebrae body on T2 MR image is highlighted in black; (b) the contour-defined centers are marked with a green circle; (c) the left and right reference points are marked with a green line; (d) the reference points are connected with linear interpolation and the vertebrae-defined stripe is marked with a green contour.
Engproc 50 00001 g007
Figure 8. Contour extraction of SC: (a) the vertical line segments the SC from the reference points; (b) SC binary image; (c) the green line represents the boundary of the SC.
Engproc 50 00001 g008
Figure 9. Examples of SC boundary extraction on T2-weighted MR images (marked with red).
Engproc 50 00001 g009
Figure 10. IVD boundary extraction.
Engproc 50 00001 g010
Figure 11. Examples of superimposed IVD (marked with red) and SC (marked with green) boundaries extracted.
Engproc 50 00001 g011
Table 1. Segmentation quality for vertebrae boundary extraction on MRI.
MethodMean DSC (%) ± SDMean HD (mm) ± SD
Al Arif et al. [11] (Unet)84 ± 1.31.6 ± 2.6
Al Arif et al. [11] (UNet-S)84 ± 1.31.6 ± 2.5
Zhang et al. [10] (U-Net)85.09 ± 1.65-
Zhang et al. [10] (AttU-Net)87.68 ± 1.55-
Zhang et al. [10] (UNet++)85.08 ± 1.62-
Zhang et al. [10] (DeepLab-v3+)88.78 ± 1.78-
Zhang et al. [10] (TransUnet)87.9 ± 1.53-
Zhang et al. [10] (Swin-Unet)84.51 ± 1.55-
Proposed88.6 ± 5.2-
Table 2. Segmentation quality for IVD boundary extraction on MRI.
MethodMean DSC (%) ± SD
Zhang et al. [10] (U-Net)85.09 ± 1.65
Zhang et al. [10] (AttU-Net)87.68 ± 1.55
Zhang et al. [10] (UNet++)85.08 ± 1.62
Zhang et al. [10] (DeepLab-v3+)88.78 ± 1.78
Zhang et al. [10] (TransUnet)87.9 ± 1.53
Zhang et al. [10] (Swin-Unet)84.51 ± 1.55
Proposed84.9 ± 2.4
Table 3. Segmentation quality for SC boundary extraction on MRI.
MethodMean DSC (%) ± SDMean HD (mm) ± SD
Sahar et al. [12]81 ± 412.3 ± 2.4
Zhang et al. [10] (U-Net)85.09 ± 1.65-
Zhang et al. [10] (AttU-Net)87.68 ± 1.55-
Zhang et al. [10] (UNet++)85.08 ± 1.62-
Zhang et al. [10] (DeepLab-v3+)88.78 ± 1.78-
Zhang et al. [10] (TransUnet)87.9 ± 1.53-
Zhang et al. [10] (Swin-Unet)84.51 ± 1.55-
Proposed90 ± 3.54.3 ± 2.7
Disclaimer/Publisher’s Note: The statements, opinions and data contained in all publications are solely those of the individual author(s) and contributor(s) and not of MDPI and/or the editor(s). MDPI and/or the editor(s) disclaim responsibility for any injury to people or property resulting from any ideas, methods, instructions or products referred to in the content.

