1. Introduction
GNSS (Global Navigation Satellite Systems) are passive navigation systems based on radio-frequency-emitting satellites providing a space-time reference frame with continuous global coverage that is available to any number of users, regardless of existing atmospheric conditions. GNSS networks are defined as a set of GNSS satellite continuous tracking stations called CORS (Continuous Operating Reference Stations) that are strategically distributed in specific territories, providing real-time or post-processing services to solve the problem of absolute geodetic positioning to any users located in the territory or adjacent areas. There is an international GNSS network known as the IGS (International GNSS Service) which contributes to the International Terrestrial Reference Frame (ITRF). IGS stations are used as reference stations for any geodetic or geodynamic process research anywhere on Earth [
1].
This work focuses on the study of the geodynamic behavior of the Central America region (Guatemala, El Salvador, Honduras, Nicaragua, and Costa Rica), a highly active area in terms of natural hazards due to different geological phenomena (earthquakes, volcanic eruptions, tsunamis, landslides, floods, etc. Different permanent and semi-permanent GNSS-GPS station networks, such as COCONet (Continuously Operating Caribbean GPS Observational Network) and IGS, are used as measurement instruments, providing free access to the data. The purpose of this study is to determine an absolute regional geodynamic model obtained from GPS data processing and analysis techniques (PPP and Relative) as well as the application of specific data filtering techniques (1-sigma, 2-sigma, kalman, wavelets, and CATS analysis) [
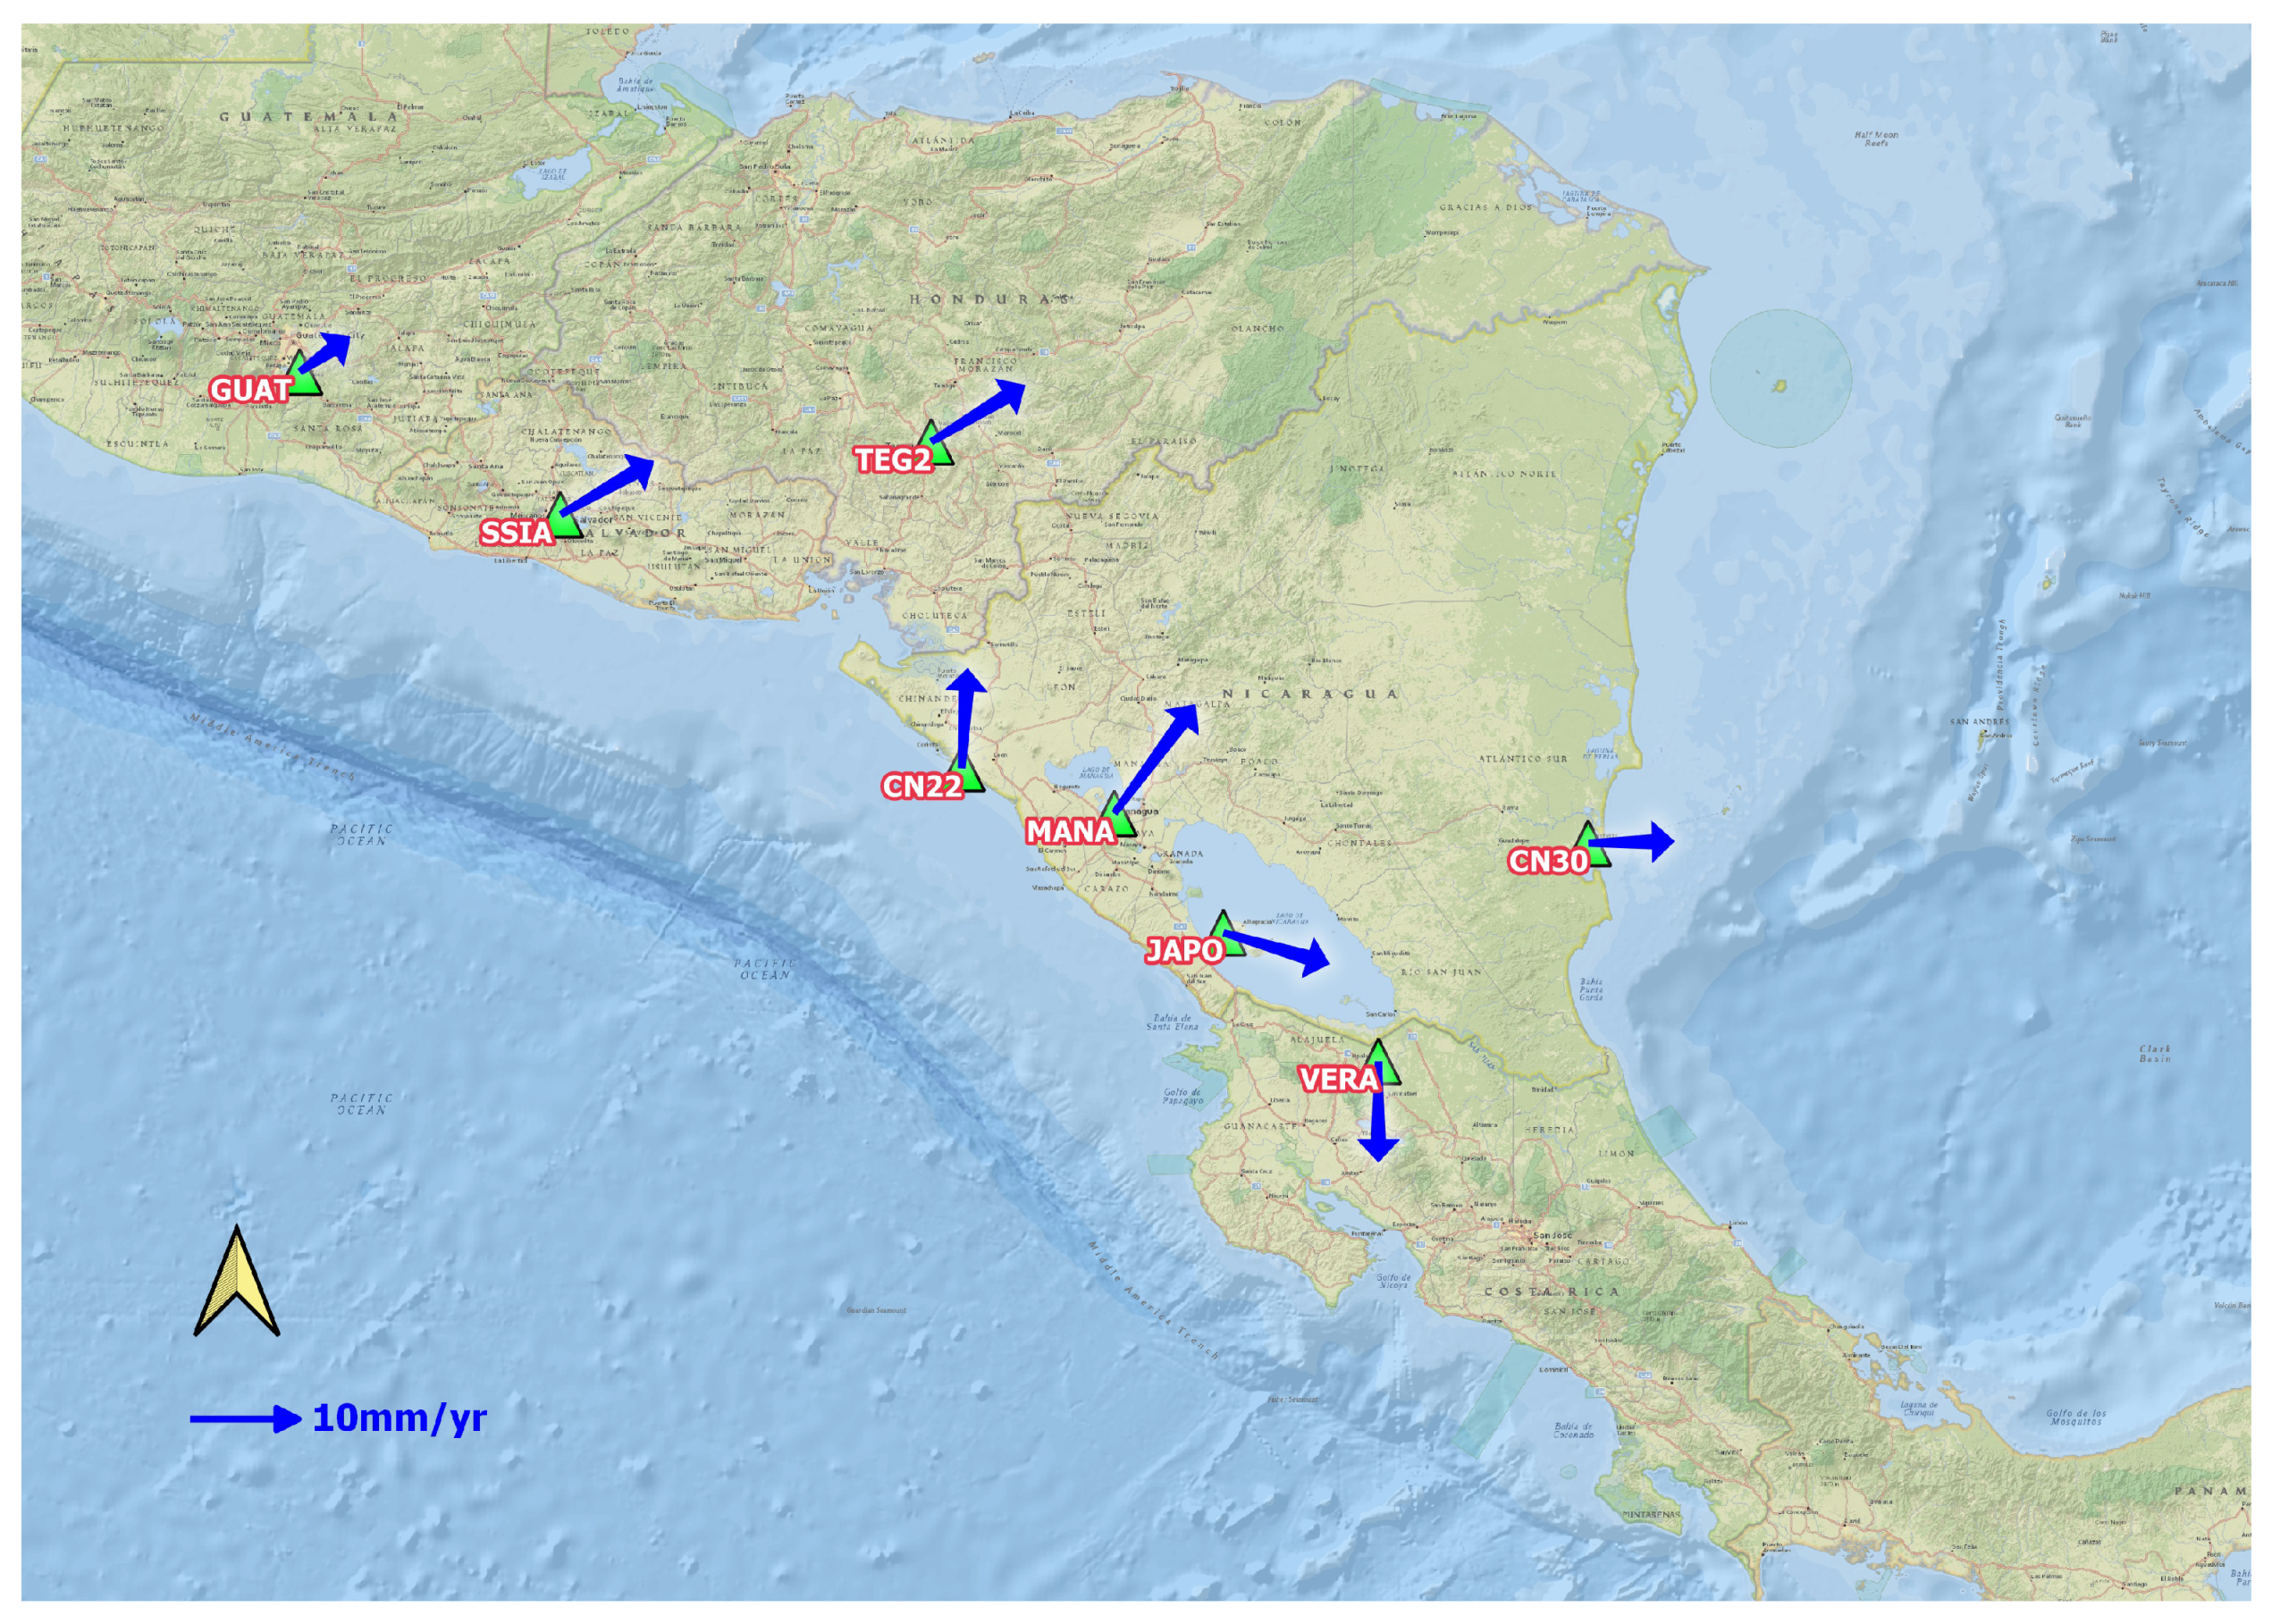
2] to determine the displacement at strategic points in the area, thus obtaining the deformation of the Earth’s surface. The GNSS stations used are: GUAT (Guatemala), SSIA (El Salvador), TEG2 (Honduras), MANA (Nicaragua), JAPO (Nicaragua), CN22 (Nicaragua), CN30 (Nicaragua) and VERA (Costa Rica).
2. Site Description
Geodynamic Framework of the Central America Region
The Central America Region is subject to the interaction of the Caribbean, North America, Cocos and Nazca tectonic plates, whose relative velocity is 2 to 9 cm per year. It is also responsible for the active volcanism in the region and the high rate of shallow and intermediate seismicity. Seismic events recorded with magnitudes from 5.5 to 7.9 on the Richter scale have occurred in this region, causing a great deal of destruction; the seismic sources are due to active interplate and intraplate tectonics.
There are important seismotectonic structures that occur intraplate: the Nicaraguan depression, the Polochic–Motagua fault system in Guatemala. The subduction zone is the main tectonic structure and source of seismic and volcanic activity in the countries of the region. It extends along the coasts of Central America on the Pacific. The zone of Wadati–Benioff, the volcanic arc, has a dip towards the northeast with angles of 60 to 80 and seismicity at a depth of up to 200 km.
The Mesoamerican trench includes segments of 100 and 300 km length that are distinguished in their strike and dip angle [
3]. The seismic occurrence rate in the Mesoamerican trench [
4] establishes that the most important seismic events have occurred in the trench segments off the coast of Guatemala, El Salvador, and Nicaragua. In this environment, there are also volcanic hazards associated with the collapse of large volumes of volcanic buildings, as in Vulcanian, Plinian, and Strombolian eruptions. The frequency of volcanic collapses in Central America is scarcely known due to the absence of precise dating of the deposits [
5]. The main risk is due to the movement of large amounts of debris that can move towards nearby populations with the risk of being buried and resulting in loss of human life.
3. Methods, Techniques, and Results
3.1. GNSS-GPS Data Processing Methods and Presentation of the Regional Geodynamic Model Obtained
The geodetic positioning method PPP (Precise Point Positioning) uses GNSS data from a single station and is therefore independent of other reference stations. This technique achieves its maximum precision (centimeter) using auxiliary data provided by IGS: ephemeris, clock corrections, Earth orientation parameters, atmospheric refraction parameters (ionosphere, troposphere), etc. [
6]. One of the peculiarities of this technique is that it necessarily requires solving the ambiguities of the satellites in order to guarantee precise coordinates, as it is made by the JPL GIPSY software. In this study, Bernese 5.2 scientific software was used to process daily (24 h) GPS data from 8 permanent and semi-permanent stations with an observation sample rate of 30 s [
7].
In stations influenced by the tectonic-volcanic effect, relative data treatment and processing was carried out, making use of simultaneous measurements of the different satellites in order to recognize and cancel orbital errors, satellite clock errors, and means of signal propagation (troposphere and ionosphere) through double satellite–receiver differences. This method makes it possible to calculate the difference between two positions with subcentimeter accuracy, thus requiring that one of the stations be recognized through a reference frame. The best accuracies are obtained with the relative processing technique, which focuses on calculating the distances between the GPS antenna and the satellite through the carrier wave itself by means of interferometric processes [
8]. The final calculation is obtained by combining this method with the differential method; that is, one of the receivers must be on a point with known and reliable coordinates [
9].
With regard to geodetic control, the variations of the absolute coordinates obtained through a geodetic calculation and adjustment process are analyzed in both Cartesian coordinates (X, Y, Z) and topocentric (east, north, up) using different techniques that guarantee millimeter-level precision to provide optimal results for regional tectonic or volcanic surface deformation parameters [
10] of the region. This implies the use of precise auxiliary parameters such as precise ephemeris, corrections of the satellite clocks and the tropospheric models, as well as data processing and filtering methods capable of jointly managing the results.
Figure 1 shows the absolute geodynamic model obtained from the analysis of the stations time series: GUAT, SSIA, TEG2, MANA, JAPO, CN22, CN30 and VERA. The
Table 1 contains coordinates and velocities of the GNSS stations analyzed.
3.2. GPS Data Filtering Techniques and Analyzed Linear and Non-Linear Time Series
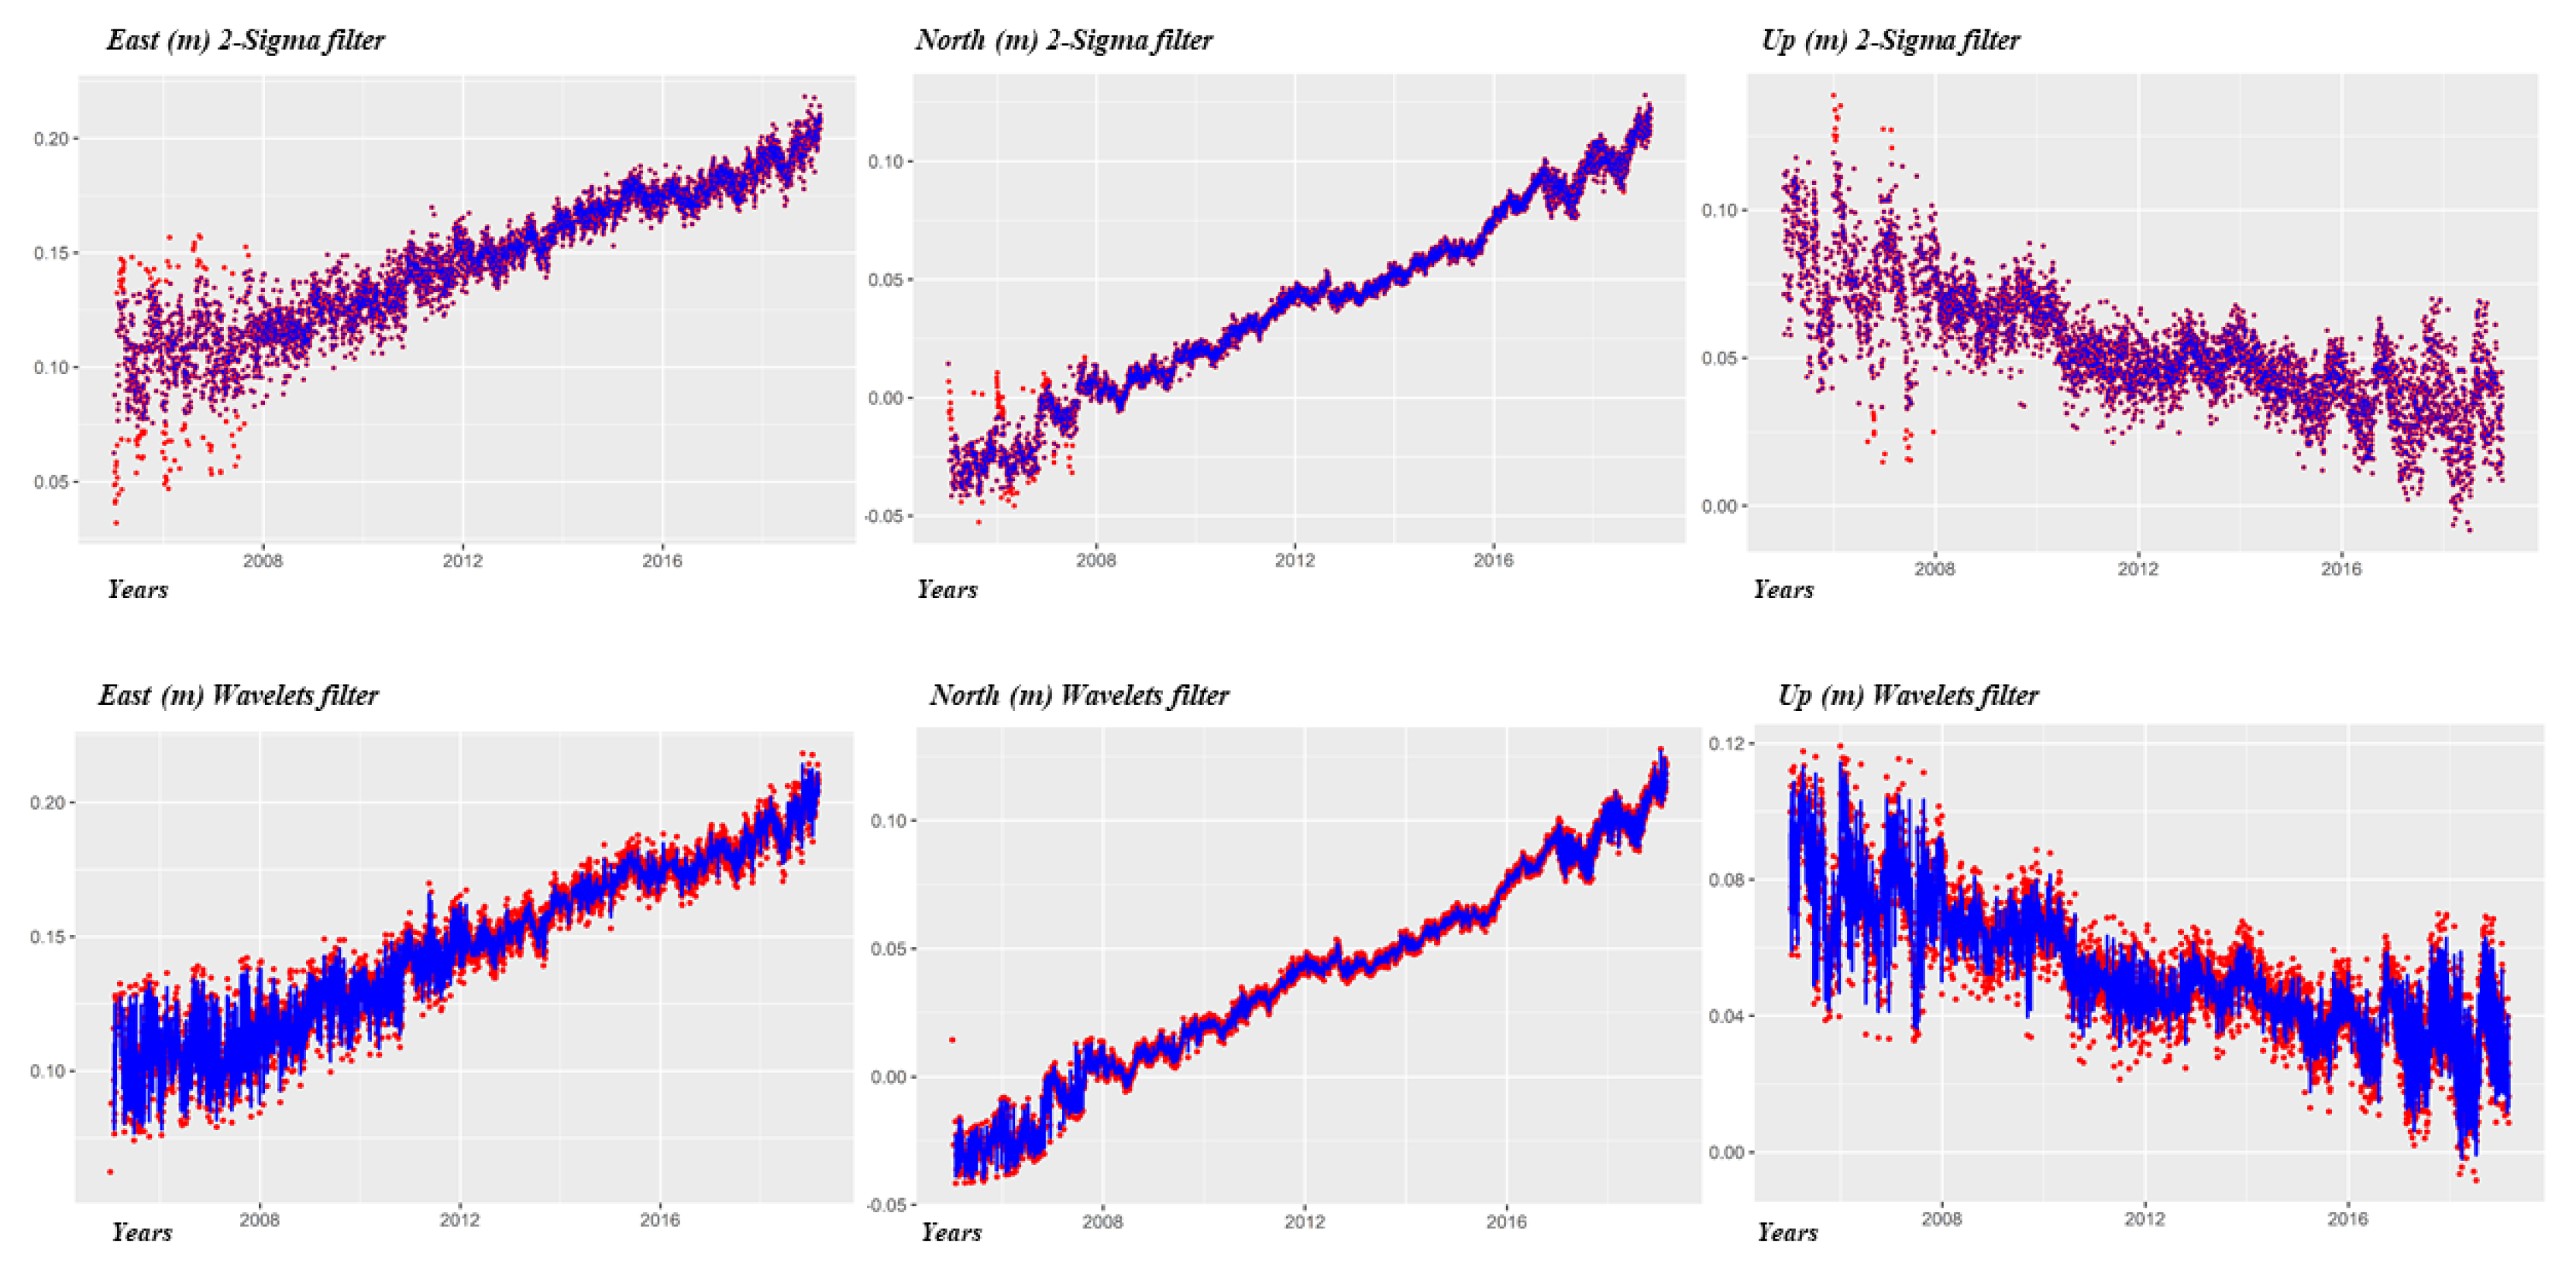
The previous model was obtained from the data processing (PPP and Relative) and a further analysis of the linear and non-linear time series. It was carried out using different mathematical and statistical techniques for detecting the behavior of the series once the outliers were filtered. Such outliers can introduced by the physical environment or by the instrument itself. The use of the different filtering techniques (1-sigma, 2-sigma, kalman, wavelets, and CATS analysis) applied to each time series minimizes noise and improves the resolution or accuracy of the results, more specifically in the determination of the velocity or displacement parameter in the east, north, and elevation components of each point. The filtering techniques used initially are 1-sigma and 2-sigma to search for anomalous values, considering their deviations through a linear regression method. Then we apply a Kalman predictive-corrective filter and in turn perform a harmonic analysis using the wavelets filtering technique (
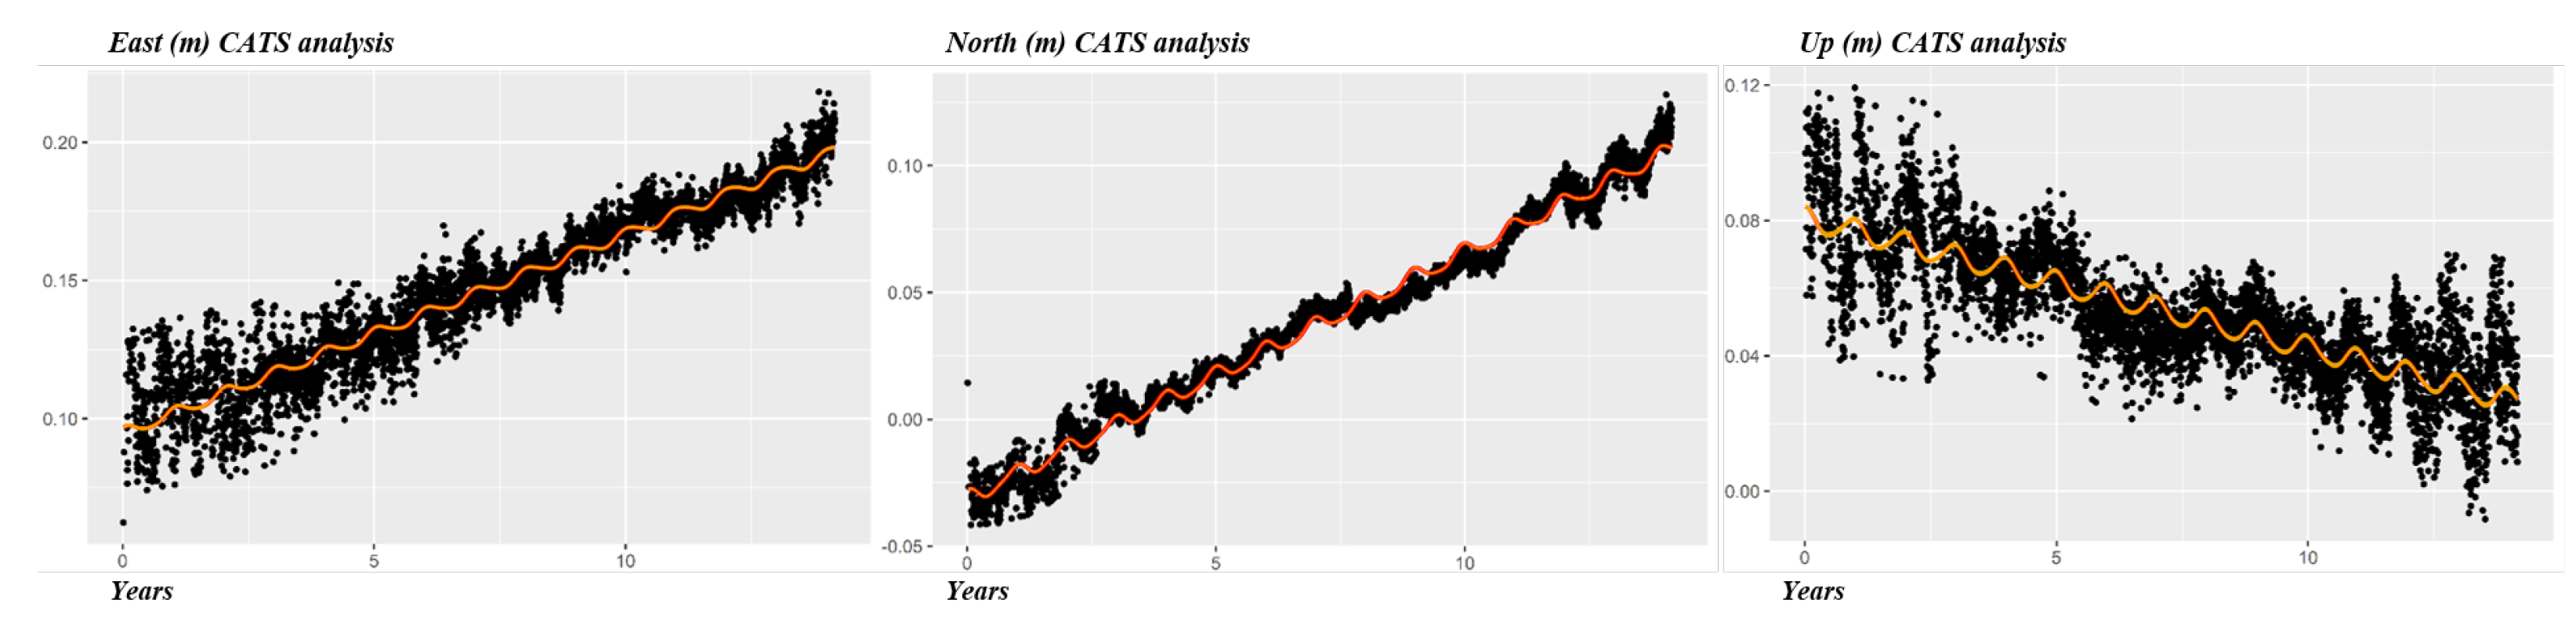
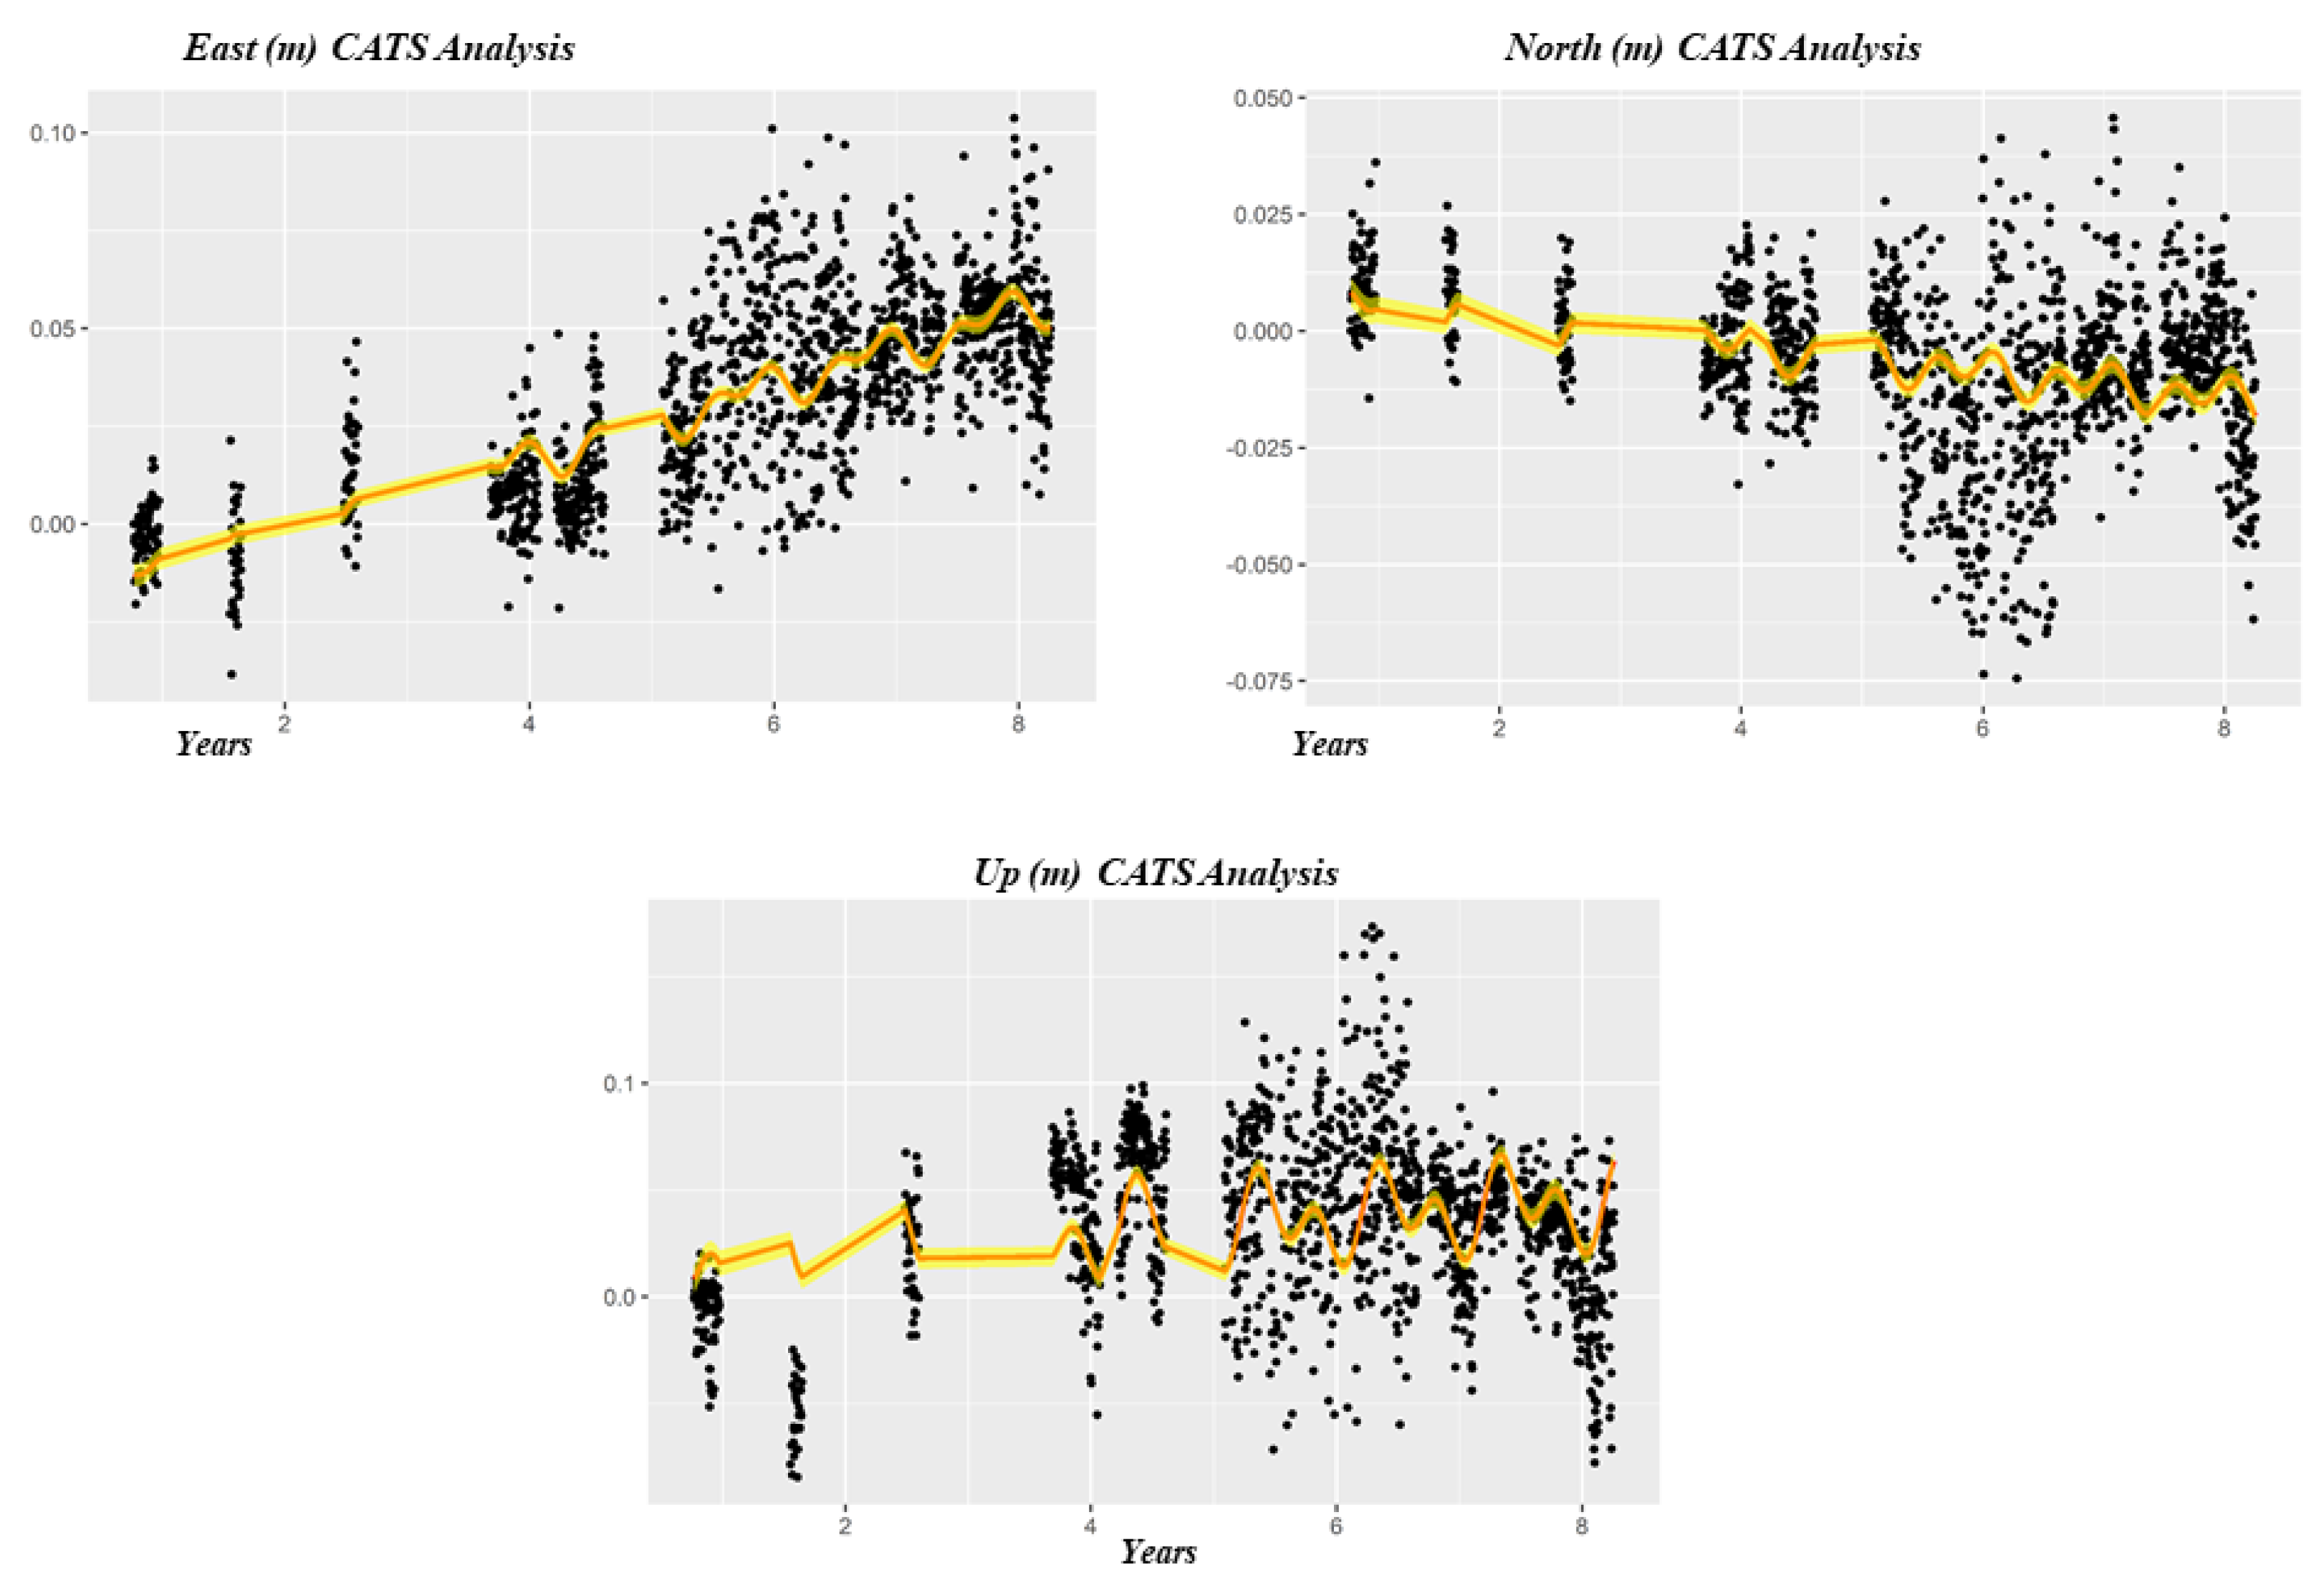
Figure 2) in order to reduce the noise in these series. Finally, for the calculation of the displacement parameter, correction of offsets, and definition of the series trend, we use the CATS analysis software (Create and Analyze Time Series) (
Figure 3), proving to be the one that best fits the geodynamic model.
3.3. Analysis of VERA Time Series Solutions
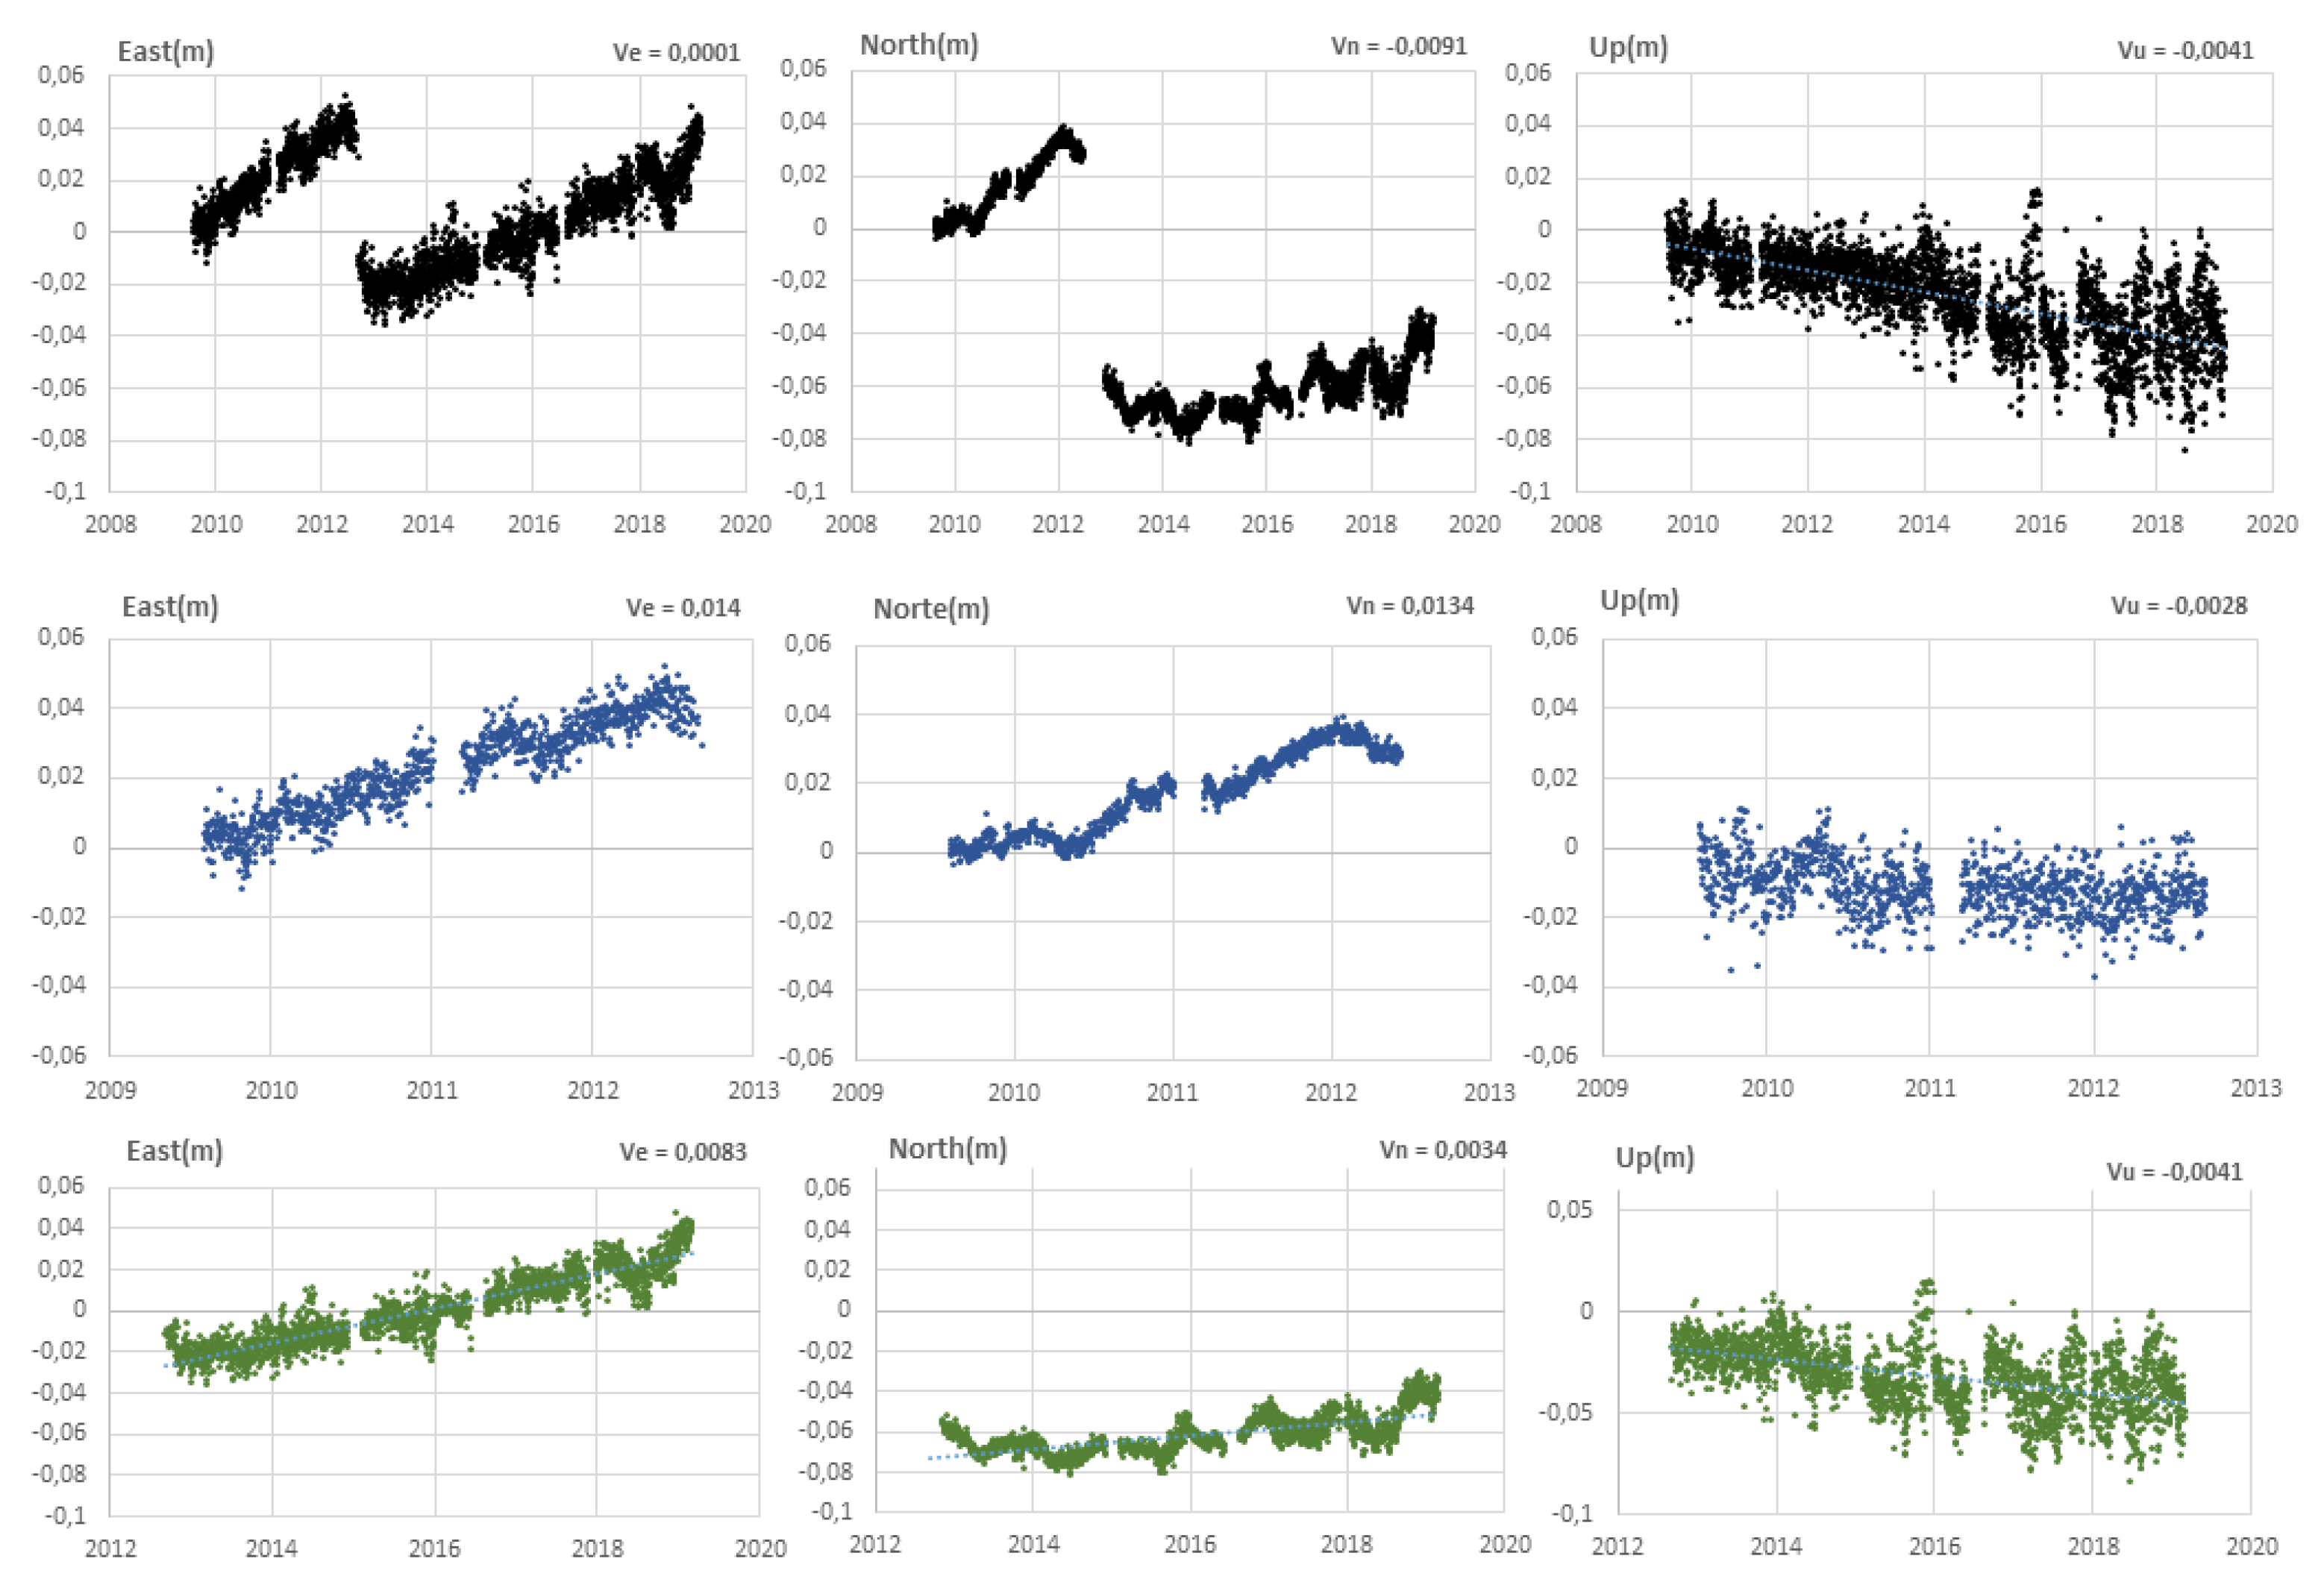
We observed an important change in the displacement of the VERA station, specifically in the horizontal component (east, north) produced by the earthquake occurring on 5 September 2012, 8 km northwest of Sámara, Guanacaste province, Costa Rica; the east seismic event had a 7.6 magnitude and 18 km depth (
Figure 4).
Table 2 shows the final velocities values (east, north, up) from the VERA GNSS station in three different phases (absolute series, pre-seismic phase and post-seismic phase).
3.4. Analysis of JAPO Time Series Solutions
The JAPO station, located on the Concepción Volcano of Ometepe Island, Nicaragua, is used to monitor volcanic activity and is part of the Conceptepe GNSS Network. The Concepción volcano has permanent activity, and around it there are many landslides that cause a great deal of destruction. In the JAPO time series (non-linear), changes in displacement can be observed due to the continuous volcano activity (
Figure 5).
Table 3 shows the final velocities values (east, north, up) from the JAPO GNSS station using CATS analysis technique.
4. Conclusions
This work shows the geodynamic behavior of the Central America region and adjacent areas. It also studies the quality of the observations of the reference stations and permanent and semi-permanent GNSS vertices to guarantee maximum precision (subcentimeter) in the time series obtained.
JAPO, VERA, and CN30 stations show changes in their behavior due to being influenced by volcanic activity, earthquake occurrence, or the lack of observations, respectively.
GNSS data filtering and fitting techniques (1-sigma, 2-sigma, wavelets, and CATS analysis) improve the precision of the results by eliminating offset in the components (east, north, up) of a data series; however, its application in nonlinear series can give incorrect solutions. Despite being included in the IGS network, the MANA permanent station, being immersed in the area of greatest seismic activity, means that it does not meet the necessary requirements for geodynamic surveillance in real time.
The VERA station is subject to constant changes in its displacement due to the different earthquakes that have occurred in the area due to local faulting and the Cocos–Caribe plate collision, one of the most important earthquakes in recent years occurring on 5 September 2012, 8 km northwest of Sámara, Guanacaste province, Costa Rica, with a magnitude of 7.6 and a depth of 18 km.
The JAPO time series shows changes in displacement due to the continuous activity of the Concepción volcano and the landslides that occur in this area. The permanent JAPO station is very important for the surveillance and monitoring not only of the Concepción volcano, but also for Maderas volcano located at the southern end of the Ometepe island. However, better solutions could be obtained using other processing techniques and reference stations with precise coordinates.
Data Availability Statement
– GPS data of the JAPO station belong to the Conceptepe network of INETER (Instituto Nicaragüense de Estudios Territoriales), Universidad de Cádiz (manuel.berrocoso@uca.es). Data belong to a research project and are not public.
Acknowledgments
We are thankful to all individuals and institutions contributing to GPS data collection and dissemination. Thanks are due to IGS (International GNSS Service), COCONet–UNAVCO (Continuously Operating Caribbean GPS Observational Network), INETER (Instituto Nicaragüense de Estudios Territoriales). We especially appreciate the contributions and suggestions of the editors and reviewers who helped improve this manuscript.
References
- Hofmann-Wellenhof, B.; Lichtenegger, H.; Wasle, E. GNSS: Global Navigation Satellite Systems—GPS, GLONASS, GALILEO and More; Springer Science and Business Media: Berlin, Germany, 2008. [Google Scholar]
- Williams, S.D.P. CATS: GPS coordinate time series analysis software. GPS Solut. 2008, 12, 147–153. [Google Scholar] [CrossRef]
- Burbach, G.; Frohlich, C.; Pennington, W.D.; Matumoto, T. Seismicity and tectonics of the subducted Cocos plate. J. Geophys. Res. Solid Earth 1984, 89, 7719–7735. [Google Scholar] [CrossRef]
- White, R.A.; Ligorria, J.P.; Cifuentes, I.L.; Rose, W.L. Seismic history of the Middle America subduction zone along El Salvador, Guatemala, and Chiapas, Mexico: 1526–2000. In Natural Hazards in El Salvador; Rose, W.I., Bommer, J.J., López, D.L., Carr, M.J., Major, J.J., Eds.; GSA SPECIAL PAPERS; Geological Society of America: McLean, VA, USA, 2004; Volume 375, pp. 379–396. ISBN 9780813723754. [Google Scholar] [CrossRef]
- Segall, P. Earthquake and Volcano Deformation; Princeton University Press: Princeton, NJ, USA, 2010; 458p. [Google Scholar]
- Zumberge, J.F.; Heflin, M.B.; Jefferson, D.C.; Watkins, M.M.; Webb, F.H. Precise point positioning for the efficient and robust analysis of GPS data from large networks. J. Geophys. Res. 1997, 102, 5005–5017. [Google Scholar] [CrossRef] [Green Version]
- Dach, R.; Lutz, S.; Walser, P.; Fridez, P. (Eds.) Bernese GPS Software, version 5.2; User Manual; Astronomical Institute, University of Bern, Printing Office of the University of Bern: Bern, Switzerland, 2015. [Google Scholar]
- Prates, G.; García, A.; Fernández-Ros, A.; Marrero, J.M.; Ortiz, R.; Berrocoso, M. Enhancement of sub-daily positioning solutions for surface deformation surveillance at El Hierro volcano (Canary Islands, Spain). Bull. Volcanol. 2013, 75, 724. [Google Scholar] [CrossRef]
- Rosado, B.; Fernández-Ros, A.; Jiménez, A.; Berrocoso, M. Modelo de deformación horizontal GPS de la región sur de la Península Ibérica y norte de áfrica (SPINA). Boletín Geológico y Minero 2017, 128, 141–156. [Google Scholar] [CrossRef]
- Rosado, B.; Fernández-Ros, A.; Berrocoso, M.; Prates, G.; Gárate, J.; De Gil, A.; Geyer, A. Volcano-tectonic dynamics of Deception Island (Antarctica): 27 years of GPS observations (1991–2018). J. Volcanol. Geotherm. Res. 2019, 381, 57–82. [Google Scholar] [CrossRef]
| Publisher’s Note: MDPI stays neutral with regard to jurisdictional claims in published maps and institutional affiliations. |
© 2021 by the authors. Licensee MDPI, Basel, Switzerland. This article is an open access article distributed under the terms and conditions of the Creative Commons Attribution (CC BY) license (https://creativecommons.org/licenses/by/4.0/).


