Proceeding Paper

Bernoulli Time Series Modelling with Application to Accommodation Tourism Demand †

by
Miguel Ángel Ruiz Reina
Department of Theory and Economic History (Staff of Fundamentals), University of Malaga, PhD Program in Economics and Business, s/n, Plaza del Ejido, 29013 Málaga, Spain
Presented at the 7th International Conference on Time Series and Forecasting, Gran Canaria, Spain, 19–21 July 2021.
Eng. Proc. 2021, 5(1), 17; https://doi.org/10.3390/engproc2021005017
Published: 28 June 2021
(This article belongs to the Proceedings of The 7th International Conference on Time Series and Forecasting)

Abstract

:
In this research, a new uncertainty method has been developed and applied to forecasting the hotel accommodation market. The simulation and training of Time Series data are from January 2001 to December 2018 in the Spanish case. The Log-log BeTSUF method estimated by GMM-HAC-Newey-West is considered as a contribution for measuring uncertainty vs. other prognostic models in the literature. The results of our model present better indicators of the RMSE and Ratio Theil’s for the predictive evaluation period of twelve months. Furthermore, the straightforward interpretation of the model and the high descriptive capacity of the model allow economic agents to make efficient decisions.

1. Introduction

Statistical Learning is a branch of science that is based on learning patterns and iden-tifying structures in data collection. Researchers develop theories using algorithms from Statistics, Mathematics, Machine Learning, Artificial Intelligence, Deep Learning, or mixed models. The applications of these methodologies are fundamental tasks of the description of the study and forecasting. The main difference, according to the statistical analysis, is the lack of a prior assumption of information and that knowledge is obtained from the data. In this paper, we will focus on the connection between Statistical Learning Theory and Econometrics [1].
The methodologies based on the use in the measurement of uncertainty can be classified into three broad categories: survey-based, model-based, and using economics and financial indexes as proxies [2]. Historically, the development of uncertainty measures has been based on the study of variance and its main distribution moments. The use of Entropy as an information measure has led to contributions in the field of uncertainty study [3]. Information Theory supposes the ordering of the results and the derivation in new conclusions. Maximum Entropy expresses the greatest uncertainty concerning the set of information analyzed [4]. Entropy, based on the Shannon Entropy concept [5], is a powerful tool for approximating exponential distributions and groups of families [6]. Despite the versatility and flexibility of the uncertainty study, it has not been widely used in empirical economic studies. The reason for this may be that the Statistical Learning approach has not been developed following an orthodox approach. In this study, we propose a sequential method for identifying uncertainty patterns in dynamic decision-making by agents based on an uncertainty function that we will call Bernoulli Time Series Modeling (BeTSM). The empirical application of this work is in the prediction of tourist hotel accommodation in Spain for decription (January 2001 to December 2018) and the out-sample period January to December 2019.
A theoretical framework is developed, and the dataset used to obtain the result was the case of Tourism markets for accommodation in Spain. In particular, we will model the decision of tourist accommodation in choosing apartments versus hotels. On a monthly database, the National Statistical Institute (INE) of Spain offers statistics related to tourism based on the National Survey of Tourist Accommodation. This database has been important in the study of the tourism market, assuming that this study is a methodological contribution on the disaggregated behaviour of uncertainty and the study of unobserved components of the Time Series [7]. The empirical results reveal an interesting cyclical movement of seasonality in decision-making. In the training period between January 2001 and December 2018, we have observed repetitive patterns: in the low season months for Spanish tourism there was less uncertainty and in the months of high demand, there was greater uncertainty in tourist decision-making. The study and description with forecasting tasks imply contributions for researchers or policy-makers.
In this article, we extend the use of BeTSM to a causality model with the use of the uncertainty factor based on the variance of BeTSM. We will call the uncertainty factor Bernoulli Time Series Uncertainty Function (BeTSUF), and it will be inserted in the predictive model called log-log BeTSUF. The easy interpretation with elasticities and the predictive capacity characterizes this method. Due to the simultaneous causality that occurs in the causal model, we will work with the Generalised Method of Moments corrected by the weighting of the Heteroskedasticity and Autocorrelation Consistent matrix (GMM + HAC-Newey-West). This method of estimation, based on a matrix of instruments, allows obtaining consistency properties of the estimated parameters. The results of our forecasting model improve the data of models contrasted in the tourism forecasting literature such as the Entropy model [8], Seasonal Autoregressive Integrated Moving Average (SARIMA) [9] and Autoregressive Distributed Lags extended to Seasonality (ARDL + Seasonality) [10]. The results of Ratio Theil’s ( R T s   U 1 ) verify these empirical results. In this paper, we work with models with Seasonality mainly because previous studies of uncertainty analysis have demonstrated their existence [8].
The remainder of this investigation is as follows: Section 1.1 provides a review of the existing literature on the forecasting Tourism; in Section 2, the theoretical methodology is developed; in Section 3, data analysis of Open Data sources is done, as is the application of the modeling; Section 4 is dedicated to the main conclusions obtained after applying the methods proposed. Finally, bibliographic references are shown.

1.1. Literature Review

This subsection cites and reviews the relevant literature and the most-used models in hotel accommodation forecasting from the last 50 years. There are great reviews of the literature that highlight the predictive capacity of the models in Time Series, Econometric Modeling, Neural Networks or other relevant frameworks in the tourism field [11,12,13,14]. In the big data field, there are also several reviews applied to tourism forecasting [15,16,17]. As we referred to before, three forecasting models are extracted from the review that we will use as a comparison for our contribution to the literature: Entropy Model, Seasonal Autoregressive Integrated Moving Average (SARIMA), and Auto-regressive Distributed Lags extended to Seasonality (ARDL + Seasonality).
In our work, we performed measurements for binary choices of tourist accommoda-tion. The use of a binary choice series can occur in many areas where the temporary problem to solve could be used in chemical, industrial, or socio-economic processes.
Some discrete Time Series methods, such as the Poisson distribution approach (model for counts), or continuous methods with a constant coefficient of variation (e.g., gamma) have been developed [18] for the use of clinical trial comparing the evaluation of logistic regression and Cox Regression with binary results in a fixed period [19]. For a better reading of these processes, deeper readings are recommended [20].
In the area where we will develop our empirical study, tourist accommodation markets and their decisions are unexplored using Bernoulli distribution in Time Series as far as our knowledge reaches. The development of the BeTSM is a contribution to the literature applied to Social Sciences. The crossover study of tourist accommodation in Hotels and the appearance of a competitor, such as a tourist apartment, has not been widely addressed in the measurement of final accommodation decisions. Researchers on tourism accommodation markets have focused their attention on the appearance since the global crisis of 2008 in studies of applications of apartment tourist offers such as Airbnb [21], apartment prices [22], the quality of accommodation services [23], and the effect of images on the final accommodation decision [24]. For more detail on forecasting and tourist accommodation, the reader has bibliographic reviews of papers at the beginning of this section.
In the field of Statistical Learning applied to the measurement of uncertainty in tourist accommodation, the introduction of Entropy in decision-making stands out. Of particular interest is the use of the Shannon Entropy dynamic to quantify the randomness in the decision between tourist accommodation in apartments and hotels. The authors highlight the descriptive and predictive goodness compared to the SARIMA predictive models, the measurement of the improvement in forecasting capacity is carried out with R T s   U 1 [8]. This relative ratio can be classified in the measurements of goodness of the ex-post prediction by its interpretability [25]. It should be noted that previous studies of Entropy applied to tourism reveal a cyclical behaviour compatible with seasonal flows [8].
From the reviewed literature, we observe in the empirical results section that our model shows improvements in the forecasts made for the Spanish hotel market. In the next sections, we will detail the theoretical modeling that we will apply in later sections.

2. Methods

In this methodological section, we will focus on the theoretical development of BeTSM. This modeling allows the descriptive, control and forecasting tasks to be carried out on events with two possible Time Series results. Once we have described the modeling of the temporal choice options, we will work with a log-log model of Time Series to perform forecasting. For this, we will introduce an uncertainty factor described by Bernoulli Time Series Uncertainty Function (BeTSUF). The inclusion of this factor implies simultaneous causality for the log-log model, violating the usual assumption of exogeneity in econometric models. We propose the GMM + HAC-Newey-West matrix. Forecasting tasks will be compared with automatic TRAMO-SEATS for SARIMA models [26] and causality models such as Autoregressive Distributed Lags Extended to Seasonality, in addition to the causality model with Entropy factor [27]. For the evaluation of the prediction, we propose the Root Mean Squared Error (RMSE) criterion and the relative dimensionless criterion of R T s   U 1 [10]. In the following paragraphs, we will describe the application methodology in the empirical section.

2.1. Bernoulli Time Series Modeling

In this subsection, we will define a binary decision mathematically over time. Suppose we are in a mutually exclusive and binary random situation in a time t = 1 ,     , T . For the application of our model in real cases, we will assume that in each monthly period, the tourist market decides between staying in a hotel or in a tourist apartment.
Let us consider that the temporary binary realization takes a value of zero or one, assuming that each temporary decision is individual and independent of the previous one. In a period the Bernoulli density function X t B e   ( p t ) could be expressed as follows:
f ( x t ) = p t x t ( 1 p t ) 1 x t ;   x t = { 0 , 1 }
Given the values of x t in each time t , the formulation would be:
f ( x t , p t ) = { 1 p t p t 0 f o r f o r i n   o t h e r   c a s e s x t = 0 x t = 1
Probability of a successful event is defined (It would be expressed by the number of times “ n t ” or “ m t ” that an event occurs   t and the number of possible cases ( n t + m t ) in that period. Alternatively, we can define the opposite event 1 p t = m t / ( n t + m t ) . In our work “ n t ” represents numbers of overnight hotels and “ m t ” represents te numbers of overnight apartments p t = n t / ( n t + m t )     t . For our work, we propose a chronologically ordered distribution of independent random variables called Bernoulli Time Series Modeling (BeTSM), proportioning information from each period, t , on the probability of an event.
For this work, we are interested in measuring the uncertainty in each period t ; for this, we will use the contemporary variance of each event defined by the expression var [ x t ] = p t ( 1 p t ) . Situations of uncertainty can be summarized with a minimal variance var [ x t ] = 0 if p t = 0 and a maximum variance var [ x t ] = 0.25 if p t = 0.5 .
The chronologically ordered distribution of var [ x 1 ] , var [ x 2 ] ,     , var [ x t ] is named the Bernoulli Time Series Uncertainty Function (BeTSUF).
In the example that we will develop in the empirical section, we will define the probability of success equal to the one for accommodation in hotels. Otherwise, we will consider that accommodation is produced in a tourist apartment. The sequence of all data collected chronologically will assume that the variance of this series will determine our Time Series (BeTSM) and the measurement of uncertainty. The ordering of the sequences of variances will represent what we have theoretically called BeTSUF.

2.2. Log-Log Modeling BeTSUF: Estimated by Generalized Method Moments HAC-Newey-West (GMM + HAC-Newey-West)

In a random context, we propose the introduction of the BeTSUF to carry out forecasting and control tasks. A statistical problem generated by the use of the uncertainty factor is the endogeneity of the regressors due to simultaneous causality of variables, not fulfilling the exogeneity and relevance conditions usually required for the estimation by the Instrumental Variables method. Furthermore, in the case of the existence of heteroscedasticity, we find a problem of efficiency in the parameters estimated. For this, we propose the estimation method Generalized Method of the Moments with the efficient residual matrix of Heteroskedasticity and Autocorrelation Consistent (HAC-Newey-West). HAC-Newey-West estimators of the variance-covariance matrix circumvent this issue [28]. For the theoretical development, we will rely on matrix expressions. Our modeling would be as follows:
Y = X β + B e T S U F δ + ε
where X and BeTSUF are the matrices of explanatory variables (endogenous and exogenous expressed in logarithms with base 10). β and δ are the vector of parameters to be estimated consistently through GMM + HAC-Newey-West. For this estimation, it is necessary to use a list of instruments. Z is the matrix of instruments that must satisfy the relevance condition ( cov ( X , Z ) 0 ) and exogeneity of the instruments ( cov ( Z , ε ) 0 ). The range condition must be fulfilled for the model to be at least identifiable [29]. The estimated parameters are obtained from the following expression:
β G M M = ( X Z Ω 1 Z X ) 1 ( X Z Ω 1 Z Y )
The matrix of the residuals is defined Ω = t = 1 T Z t Z t ε t 2 , which allows us to obtain the estimators β G M M efficiently. In testing the orthogonality of the instruments (null hypothesis E ( Z t ε t ) = 0 ), we use the test statistic J G M M = ( Z ε G M M ) Ω 1 ( Z ε G M M ) / t .
The residuals of the statistic are obtained from the estimation by GMM + HAC-Newey-West ε G M M = Y X β G M M B e T S U F δ G M M . Finally, the asymptotic distribution of the statistic is J G M M a χ m k 2 where m is the number of instruments and k is the number of endogenous regressors. Once the estimation of the β and δ parameter vectors has been carried out by the GMM + HAC-Newey-West, we can guarantee the asymptotic consistency property of the estimators [30,31].
For the empirical application, our dependent variable will be the number of hotel overnight stays. The explanatory variable will be the number of accommodations in tourist apartments and also the uncertainty factor BeTSUF. In subsequent sections, we will work with the model expressed in logarithms called log-log BeTSUF.

2.3. Accuracy of the Predictive Capacity of the Models

We propose an evaluation for the time horizon h = 12 with the value predicted y ^ t + h and real value y t + h . Specifically, we use two model selection criteria based on the prediction; on the one hand, we will use the Root Mean Squared Error (RMSE) [25]:
R M S E = h = 1 H ( y ^ t + h y t + h ) 2 h
On the other hand, we will propose the relative criterion R T s   U 1 , which is designed to perform model comparisons for prediction periods with the time horizon h . The benchmark is based on the concept of inequality of Theil U 1 [32] and developed for forecastings comparisons between the results of modeling [10]:
U 1 = [ 1 h i = 1 N ( y T + h y ^ T + h ) 2 ] 1 / 2 [ 1 h i = 1 N ( y T + h ) 2 ] 1 / 2 + [ 1 h i = 1 N ( y ^ T + h ) 2 ] 1 / 2
R T s y i t , y j t = U 1 y i t U 1 y j t
The values of the R T s   U 1 will determine which model has the most significant predictive capacity if it is equal to one; the models i and j will present the same predictive power. For values greater than one, the numerator model will show a worse predictive capacity than the denominator. For values between zero and one, the numerator model will present a better predictive capacity. In the next empirical section, we will show a comparative table with the most outstanding results in an annual forecast.

3. A Case Study in the Social Sciences: The Dichotomy of Choice between Hotels and Tourist Apartments

In this section, we divide two subsections: on the one hand, data and correlations, and on the other hand, empirical results. The first part presents the variables under study and the instruments for the estimation of elasticities; in the second subsection, we apply modeling to these data. For our analysis, we have modeled the contemporary choice in the field of empirical application in the tourism sector. The objective is to analyze how the probabilities of accommodation in one place or another are distributed through the market for hotel demand and tourist apartments in Spain. With the temporal analysis, we will observe how tourists in the Spanish market reflect their housing interests in terms of probabilities.

3.1. Data and Correlations

In this subsection, we will carry out an analysis of the modeling presented in the previous sections. In particular, Open Data resources available in the INE for the application of the statistical model in the field of social sciences. We will consider a monthly training analysis period from January 2001 to December 2018, the evaluation of the predictive capacity will be carried out for all the months of 2019. The descriptive statistics are those shown in Table 1.
In Table 1, we identify the variable y t as the number of hotel accommodations, the variable x t as the number of accommodations in tourist apartments and B e T S U F t is the uncertainty factor described in the methodological section.
The descriptive data with 216 observations without missing values are for the training period and the aggregate data from the Spanish Tourism market. The descriptive statistics in the table indicate the maximum values of the accommodations found at their maximum values in August 2017. On the other hand, the maximum value of the uncertainty factor is given in January 2001. The minimum amounts are different chronologically for the different variables, for the hotel demand Time Series it occurs in December 2001, for the tourist apartments demand it happened in January 2010 and for the uncertainty factor in May 2012. As for the Skewness and Kurtosis, we can highlight that the three series present positive asymmetry and this could be determined by the strong seasonality where the predominant months are June, July and August compared to the remaining nine that generally show lower values.
Referring to the methodological section, with the modeling that we present, we must use instrumental variables for the variables of our model due to simultaneous causality. In the following Table 2, the correlations between the explanatory variables of our model are presented ( x t , B T S U F t ) and the list of instruments: rural apartments ( z 1 t , z 1 t 1 ) and accommodation in campsites ( z 2 t , z 2 t 1 ) .
In Table 2 of cross-correlations, we can observe that all the instruments meet the relevance conditions since all the instrumental variables are correlated with the regressors. In Table 2, we find the value of the statistic and in parentheses the p-value under the hypothesis of no correlation between explanatory variables and the list of instruments. The results present all p-values less than 0.05, the correlation between contemporary camping sites and the uncertainty factor (0.61) being the only one greater. For the rest of the lagged variables, the relevance assumption is fulfilled. Taking this matrix into account, we can consider that a priori the list of instruments is valid for estimating through the GMM + HAC-Newey-West method.

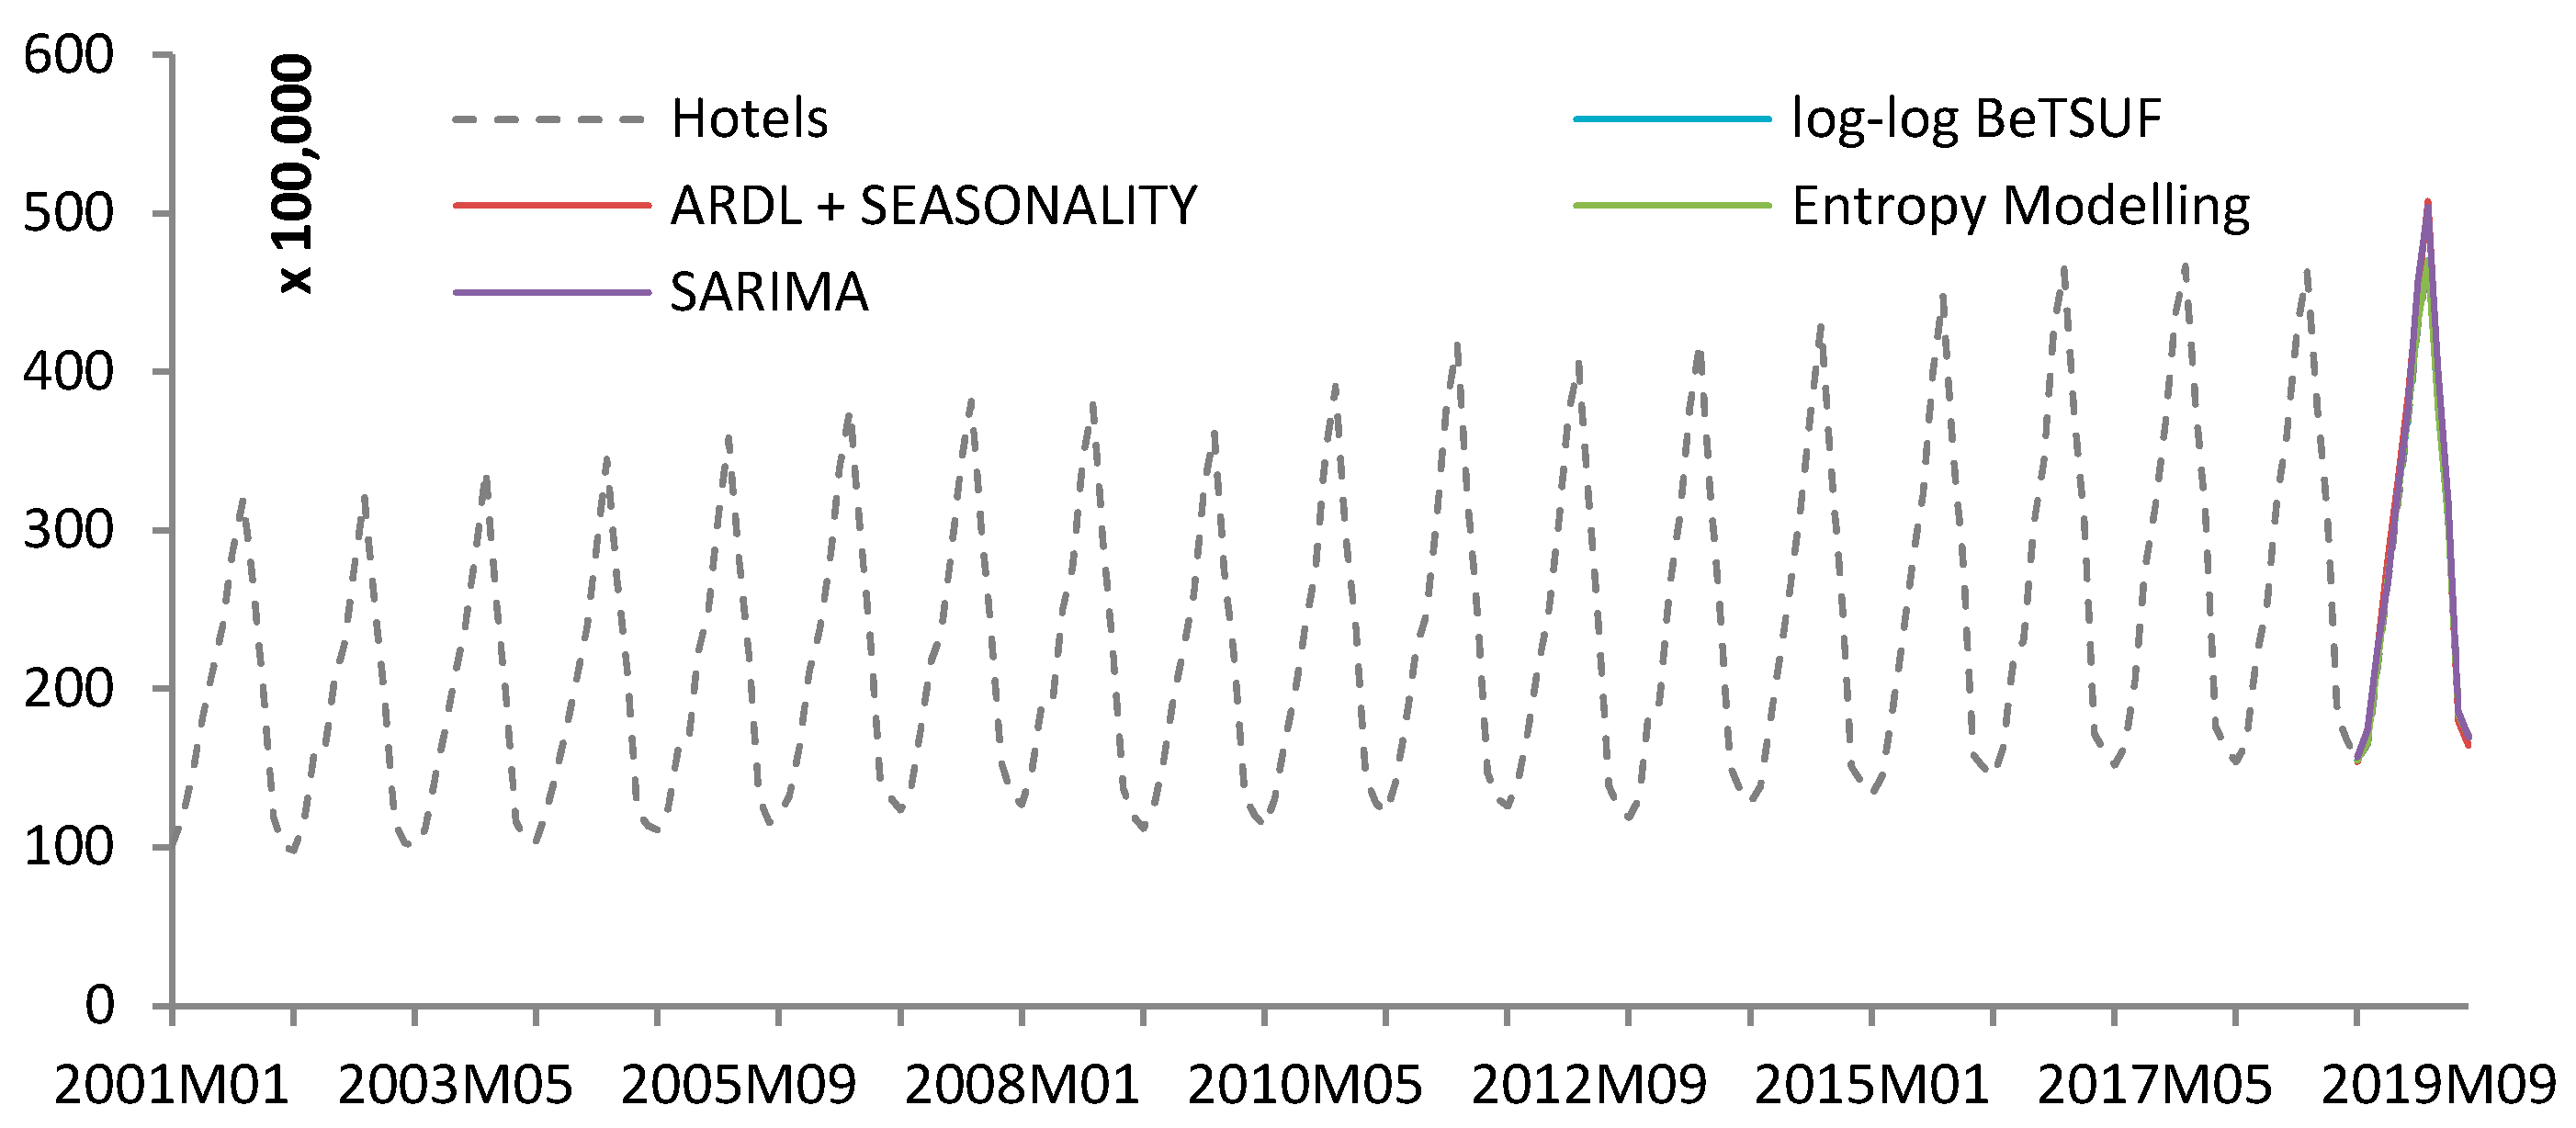
3.2. Empirical Results

In this subsection, we work with the application of the data collected to the modeling log-log BeTSUF described in the methodological section. Given the results of the correlation matrix in Table 2, we proceed to carry out the estimation through the GMM + HAC-Newey-West. The estimation and training period of the model is for 216 months (from 2001 to 2018). The purpose of establishing an analysis period with sample prediction is to obtain a robust model to face a prediction scenario with the most significant guarantees.
In our model (8) the parameters estimated should be interpreted as elasticities. From the results obtained, we can verify the signature of the estimated parameters, the contrast z-statistic obtained in the consistent HAC matrix is shown in parentheses. Values greater than ± 2 imply that parameters are significant in the modeling. The modeling of resids present a white noise structure with a Seasonal Autoregressive structure S A R ( 1 , 12 ) . Given this modeling log-log BeTSUF, we can highlight the high explanatory capacity R 2 = 0.998 .
In this case, the model presents overidentification; the contrast J allows us to contrast the exogeneity of the instruments. Taking into account that the empirical value shows a probability of 0.1517 , we cannot reject the hypothesis of exogeneity of the instruments with a 95 % confident.
log y t = 1.2077 ( 7.1837 ) + 0.9869 ( 138.7423 ) log x t 1.5317 ( 40.7203 ) log B e T S U F + ε t R 2 = 0.9998 ;   Pr o b   J - S t a t i s t i c = 0.1517 ε t = 0.5316 ( 7.0338 ) ε t 1 + 0.8149 ( 7.0338 ) ε t 12 + e ^ t S a m p l e   o f   E s t i m a t i o n :   2001.1   t o   2018.12 I n s t r u m e n t s   l i s t : log ( z 1 t ) , log ( z 1 t - 1 ) , log ( z 2 t ) , log ( z 2 t - 1 )
According to the validation of the model log-log BeTSUF, we proceed to interpret the estimated parameters of the model. The first aspect to highlight is that the signs obtained are as expected; the relationship between hotel accommodation and tourist apartments is positive. The elasticity is 0.9869 , which implies a direct relationship between both variables analyzed. Second, the inverse relationship between BeTSUF and the hotel accommodation variable should be highlighted. According to our model, we can interpret that when there is more significant uncertainty, hotel accommodations lose demand in favour of tourist accommodation. In particular, when there is an increase of one per cent in uncertainty, hotel accommodations decrease their demand by 1.5317 ceteris paribus.
After analyzing the descriptive capacity of the model and its validation, we will focus on the forecasting capacity and its comparison with other forecasting models through RMSE and R T s   U 1 . Regarding our causal model estimated through GMM weighted by HAC-Newey-West, it is worth highlighting the goodness of the predictive capacity of the model based on the scale of the data.
The forecasting period is between January 2019 to December 2019. According to Table 3, our model log-log BeTSUF presents the minimum values (78,507.36) of the widespread RMSE criterion, giving a better predictive capacity compared to forecasting models. The Entropy model (107,581) showing proximity in terms of the predictive power of a complete cycle of twelve months. The rest of the models present very high values, which are considered worse than the model exposed to our work.
As a relative measure of prediction calculation, we observe the R T s   U 1 of the estimated models in Table 4. It should be noted that all are greater than 1, and our benchmark method is the model exposed in our methodological development. The scores obtained for the ADRL + Seasonality and SARIMA methodology are widely worse (19 times worse) than our estimated model with the uncertainty factor. The closest model compared to our benchmark method is that of Entropy, taking a value higher than 1.37 times.
The following Figure 1 shows the predictions with a time horizon of twelve months. From a graphic point of view, it is difficult to differentiate between models, but the use of ratios allows us to quantify the benefits of our model proposed in the methodological section. In Table 4, we can verify that the best model is the log-log BeTSUF. Finally, in the conclusions section, we will specify the advantages, advances and limitations of the use of this proposed methodology.

4. Conclusions

In the scientific article, we have developed modeling under the assumption of BeTSM with Application to Accommodation Tourism Demand. The objective covered is to create a Statistical Learning approach through the analysis of behavioural patterns of the Hotel accommodation market, in particular, we have modeled the market decision between hotel accommodation and tourist apartments with data from INE Spain. The use of the uncertainty factor described in the methodological section allows us to analyze how unobservable information BeTSUF is transmitted from one variable to another in the sense of causality. In theoretical terms, it assumes that an applied quantity function is used instead of a state counter such as Entropy [8].
Log-log BeTSUF is worth highlighting robust theoretical and empirical properties. The property of consistency of the estimators of the explanatory variables of the model and the efficient use of the residuals to carry out inference tasks with GMM + HAC-Newey-West, giving a solution to the problem of causal simultaneity found in the theoretical modeling.
According to our results, we have found a high explanatory capacity of the model with a high R 2 = 0.998 . The easy interpretability measured in elasticities, from which we can deduce that the variables of hotel accommodation and tourist apartments present a unitary elasticity ( 0.9869 ); the uncertainty factor provides added value in the modeling, knowing that the unitary elasticity of this uncertainty factor allows us to see the transfer of information that occurs from one variable to another. Meaning that an increase of 1% in uncertainty presents a decrease of 1.5317 in demand for hotel accommodation in favour of the apartments; regarding the predictive capacity, our modeling log-log BeTSUF gave the lowest RMSE and the best relative criterion of R T s   U 1 for the models presented in this paper for the same period of forecasting.
This study provides knowledge about the uncertainty that has to be measured. As it was introduced in this article, it is possible to consider this modeling to explain situations in Computer Science, Engineering, Physics, Mathematics and many other applications.
As can be seen, taking into account the possible limitations that the researcher could find with the application of this technique, this article contributes to the scientific literature and adds forecasting tools. The study exposed continues to open the field of forecasting and control for the advancement of these techniques from a theoretical and empirical point of view. This debate should always be based on robustness criteria, which implies sensitivity to changes in specific factors to be tested and insensitive to changes in outliers in practice. The work developed is in the context of uncertainty, and this work has been a contribution to a real forecasting problem [33].

Funding

This research received no external funding.

Institutional Review Board Statement

Not applicable.

Informed Consent Statement

Not applicable.

Data Availability Statement

The datasets generated during and analyzed during the current study are available in the repository (https://drive.google.com/file/d/1T5_dQGxCLlG7IKMOPvgFUD9lsCe344fn/view?usp=sharing (accessed on 22 June 2021)).

Acknowledgments

The author wishes to acknowledge the support given by the University of Malaga. PhD. Program in Economics and Business, effective from 16 July 2013. Especially to Associate Professor Antonio Caparrós Ruiz from the University of Malaga for reviewing this work. Group of research: “SEJ157-INIDICADORES SOCIALES”.

Conflicts of Interest

The author declares no conflict of interest.

References

  1. Maasoumi, E.; Medeiros, M.C. The link between statistical learning theory and econometrics: Applications in economics, finance, and marketing. Econ. Rev. 2010, 29, 470–475. [Google Scholar] [CrossRef]
  2. Shoja, M.; Soofi, E.S. Uncertainty, information, and disagreement of economic forecasters. Econ. Rev. 2017, 36, 796–817. [Google Scholar] [CrossRef]
  3. Maasoumi, E. A compendium to information theory in economics and econometrics. Econ. Rev. 1993, 12, 137–181. [Google Scholar] [CrossRef]
  4. Jaynes, E.T. Information theory and statistical mechanics. Phys. Rev. 1957, 106, 620–630. [Google Scholar] [CrossRef]
  5. Shannon, C.E. A mathematical theory of communication. Bell Syst. Tech. J. 1948, 27, 379–423. [Google Scholar] [CrossRef] [Green Version]
  6. Lehmann, E.L.; Casella, G. Theory of Point Estimation, 2nd ed.; Springer: Berlin, Germany, 1998. [Google Scholar]
  7. Harvey, A. Chapter 7 forecasting with unobserved components time series models. Handb. Econ. Forecast. 2006. [Google Scholar] [CrossRef]
  8. Ruiz-Reina, M.Á. Entropy of tourism: The unseen side of tourism accommodation. In Proceedings of the International Conference on Applied Research in Business, Management and Economics, Barcelona, Spain, 12–14 December 2019. [Google Scholar]
  9. Box, G.E.P.; Jenkins, G.M.; Reinsel, G.C. Time Series Analysis: Forecasting and Control, 4th ed.; John Wiley & Sons: Hoboken, NJ, USA, 2013. [Google Scholar]
  10. Ruiz-Reina, M.Á. Big data: Does it really improve forecasting techniques for tourism demand in spain? In International Conference on Time Series and Forecasting; Godel Impresiones Digitales S.L.: Granada, Spain, 2019; pp. 694–706. [Google Scholar]
  11. Li, G.; Song, H.; Witt, S.F. Recent developments in econometric modeling and forecasting. J. Travel Res. 2005. [Google Scholar] [CrossRef] [Green Version]
  12. Song, H.; Li, G. Tourism demand modelling and forecasting-A review of recent research. Tour. Manag. 2008, 29, 203–220. [Google Scholar] [CrossRef] [Green Version]
  13. Peng, B.; Song, H.; Crouch, G.I. A meta-analysis of international tourism demand forecasting and implications for practice. Tour. Manag. 2014. [Google Scholar] [CrossRef]
  14. Jiao, E.X.; Chen, J.L. Tourism forecasting: A review of methodological developments over the last decade. Tour. Econ. 2019. [Google Scholar] [CrossRef]
  15. Wu, D.C.; Song, H.; Shen, S. New developments in tourism and hotel demand modeling and forecasting. Int. J. Contemp. Hosp. Manag. 2017, 29, 507–529. [Google Scholar] [CrossRef]
  16. Mariani, M.; Baggio, R.; Fuchs, M.; Höepken, W. Business intelligence and big data in hospitality and tourism: A systematic literature review. Int. J. Contemp. Hosp. Manag. 2018. [Google Scholar] [CrossRef] [Green Version]
  17. Li, J.; Xu, L.; Tang, L.; Wang, S.; Li, L. Big data in tourism research: A literature review. Tour. Manag. 2018, 68, 301–323. [Google Scholar] [CrossRef]
  18. Zeger, S.L.; Qaqish, B. Markov regression models for time series: A quasi-likelihood approach. Biometrics 1988, 44, 1019–1031. [Google Scholar] [CrossRef] [PubMed]
  19. Peduzzi, P.; Holford, T.; Detre, K.; Chan, Y.K. Comparison of the logistic and Cox regression models when outcome is determined in all patients after a fixed period of time. J. Chronic Dis. 1987, 40, 761–767. [Google Scholar] [CrossRef]
  20. Hung, Y.; Zarnitsyna, V.; Zhang, Y.; Zhu, C.; Wu, C.F.J. Binary time series modeling with application to adhesion frequency experiments. J. Am. Stat. Assoc. 2008, 103, 1248–1259. [Google Scholar] [CrossRef] [PubMed] [Green Version]
  21. Bakker, M.; Twining-Ward, L. Tourism and the Sharing Economy: Policy and Potential of Sustainable Peer-to-Peer Accommodation; The World Bank: Washington, DC, USA, 2018. [Google Scholar]
  22. Portolan, A. The impacts of private accomodation attributes on tourism demand. In DIEM: Dubrovnik International Economic Meeting; Sveučilište u Dubrovniku: Dubrovnik, Croatia, 2013. [Google Scholar]
  23. Juaneda, C.; Raya, J.M.; Sastre, F. Pricing the time and location of a stay at a hotel or apartment. Tour. Econ. 2011, 17, 321–338. [Google Scholar] [CrossRef]
  24. Ert, E.; Fleischer, A.; Magen, N. Trust and reputation in the sharing economy: The role of personal photos in Airbnb. Tour. Manag. 2016, 62–73. [Google Scholar] [CrossRef]
  25. Hyndman, R.J.; Koehler, A.B. Another look at measures of forecast accuracy. Int. J. Forecast. 2006, 22, 679–688. [Google Scholar] [CrossRef] [Green Version]
  26. Hyndman, R.J.; Khandakar, Y. Automatic time series forecasting: The forecast package for R. J. Stat. Softw. 2008, 27. [Google Scholar] [CrossRef] [Green Version]
  27. Ruiz-Reina, M.Á. Entropy of Tourism: The Unseen Side of Tourism Accommodation. Available online: https://www.dpublication.com/wp-content/uploads/2019/12/424.pdf (accessed on 22 June 2021).
  28. Hayashi, F. Econometrics; Princeton University Press: Princeton, NJ, USA, 2000. [Google Scholar]
  29. Chow, G. Econometrics; McGraw-Hill Book Company: New York, NY, USA, 1983. [Google Scholar]
  30. Sargan, J.D. The estimation of relationships with autocorrelated residuals by the use of instrumental variables. J. R. Stat. Soc. Ser. B 1959, 21, 91–105. [Google Scholar] [CrossRef]
  31. Hall, A.R. Advanced Texts in Econometrics: Generalized Method of Moments; Oxford University Press: Oxford, UK, 2005. [Google Scholar]
  32. Christ, C.F.; Theil, H. Economic forecasts and policy. Econometrica 1962. [Google Scholar] [CrossRef]
  33. Gill, P.E.; Murray, W.; Saunders, M.A.; Tomlin, J.A.; Wright, M.H.; George, B. Dantzig and systems optimization. Discret. Optim. 2008, 151–158. [Google Scholar] [CrossRef] [Green Version]
Figure 1. Out-sample forecast hotel accommodation h = 12 (January 2019 to December 2019). Own Elaboration.
Engproc 05 00017 g001
Table 1. Descriptive Statistics (January 2001 to December 2018). Own Elaboration.
y t x t B e T S U F t
Mean22,934,3935,891,9360.163905
Median21,721.2144,858,9730.162965
Maximum46,657,18712,520,4970.221206
Minimum9,797,6443,302,2420.118740
Std. Dev.9,463,7502,433,8070.023312
Skewness0.5659251,234,3840.312166
Kurtosis2.3303.4082.441
Observations216216216
Table 2. Cross correlations for explanatory and instruments variables. Sample January 2001–December 2018. Own Elaboration.
x t B T S U F t z 1 t z 2 t z 1 t 1 z 2 t 1
x t 1.00 (----)
B T S U F t 0.15 (0.03)1.00 (----)
z 1 t 0.74 (0.00)−0.24 (0.00)1.00 (----)
z 2 t 0.94 (0.00)0.03 (0.61)0.84 (0.00)1.00 (----)
z 1 t 1 0.38 (0.00)−0.39 (0.00)0.49 (0.00)0.33 (0.00)1.00 (----)
z 2 t 1 0.66 (0.00)−0.13 (0.06)0.53 (0.00)0.56 (0.00)0.84 (0.00)1.00 (----)
Table 3. Summary of forecasting accuracy (RMSE). Out-Sample training January 2019–December 2019. Own Elaboration.
log - log   B e T S U F E n t r o p y A D R L + S e a s o n a l i t y S A R I M A
R M S E   ( h = 12 ) 78,507.36107,5811,524,2951,528,357
Table 4. Summary of forecasting accuracy ( R T s   U 1 ). Out-Sample training January 2019–December 2019. Own Elaboration.
log - log   B e T S U F E n t r o p y A D R L + S e a s o n a l i t y S A R I M A
R T s   U 1   ( h = 12 ) 11.369619.021019.0699
Publisher’s Note: MDPI stays neutral with regard to jurisdictional claims in published maps and institutional affiliations.

