1. Introduction
The study of the diffusion process of telecommunication services is of paramount importance in understanding the factors influencing the development of telecommunication networks. For telecommunication service operators, it provides the basis for strategic decisions, such as technology selection and capacity expansion. Moreover, the derived knowledge can be used by policy makers and regulators for shaping market competition.
Based on the findings in [
1], telecommunications’ demand modelling and forecasting usually involves the use of traditional diffusion theory. Most commonly used diffusion models include the Bass model, the Fisher–Pry model, the Gompertz models and some representatives of the logistic variants. With respect to studies not mentioned, examples of this literature include the work of [
2,
3,
4,
5] and more recently [
6,
7].
These S-shaped diffusion models accurately capture the telecommunications’ market expectations, but do not provide measures for the inherent uncertainty in their forecasts [
1]. Consequently, the decision maker is deprived of the ability to estimate the risk (systematic and/or idiosyncratic based on the diffusion process under study) inherent to the market under study, as well as to investigate the link between this risk and the market’s competitive environment.
To cope with this shortcoming, the literature suggests the use of stochastic models, e.g., Geometric Brownian Motion (GBM). In [
8], an error factor with normal distribution was used to model uncertainty. In [
9], GBM is described as a mathematical tool with the capability of calibrating demand volatility very reasonably and accurately. In [
10], GBM was indicated as a good first approximation for uncertainties. In [
11], a GBM process with a linear expected growth rate was used to model the stochastic nature of the diffusion process. In [
12], GBM modelling was applied to generate sample paths of demand in the semiconductor manufacturing industry. In the telecommunications’ market, the relevant literature is quite limited; in [
13], four datasets in the energy, transportation, and telecommunication sectors were analyzed using GBM.
Despite their ability to capture and communicate forecast uncertainties better to stakeholders, the above stochastic models have also received some criticism; in [
14], it was pointed out that stochastic models cannot capture demand trends as good as S-shaped models. For GBM applications, this can be accounted for by the constant drift rate, which varies significantly from the dynamic growth exhibited in new product demand [
11]. To tackle this issue, in [
15], a calibrated GBM model with spline interpolation was proposed to address the problem of stochasticity in forecasting diffusion of a new product with scarce historical data; the drift parameter is calculated from the forecasted data provided by a best-fit polynomial model and the volatility parameter is considered equal to the root mean square error (RSME) of the best-fit function found for the drift. This approach enables the stochastic model to capture the dynamics of the product’s life cycle; yet, it should not be used in forecasting because of the polynomial model’s prowess to overfitting.
To consider both dynamic growth and possible stochasticity in the future demand for telecommunication services, this study suggests the use of an S-curve calibrated generalized Brownian motion—Ito stochastic process. Dynamic growth is captured by a variable drift parameter following the diffusion rate provided by the best-fitting S-shaped model. Furthermore, the diffusion uncertainty is modelled through the volatility parameter, which is defined as the standard deviation of the percentage error of the best-fitting S-shaped model. Since an Ito process is used, the proposed model is valid provided the actual diffusion log changes follow a normal distribution.
The proposed approach offers significant advantages in telecommunications’ demand modelling and forecasting over the existing literature. S-curve diffusion modelling has proven its ability to accurately capture growth trends in telecommunication services. This ability is incorporated in the proposed stochastic model by the variable growth rate of the best-fitting S-curve model, which serves as the drift parameter of the model. The main advantage, though, lies with the accurate estimation of the volatility incorporated in the diffusion process under study; the better determination of the data drift highlights the changes in data due to uncertainty, thus allowing for a better determination of diffusion uncertainty. If the diffusion process of an entire market is examined, the calculated volatility reflects the overall market uncertainty, whereas, if the diffusion process of a specific technology on a provider basis is examined, the calculated volatility corresponds to the overall technology uncertainty the provider experiences.
The proposed stochastic process can be used in telecommunications’ demand forecasting. Monte Carlo Simulation is deployed to provide the diffusion forecast. Depending on the diffusion process under study, through this analysis, the estimation of both the systematic and the idiosyncratic risk inherent in the telecommunications’ services market may also be provided. Moreover, when a specific technology for both the overall market and a provider are examined, through a standard cointegration analysis, the effect of the overall market uncertainty to the provider uncertainty may also be determined.
To indicate the dynamics of the proposed method, a real-world example, based on the diffusion of the mobile market in Greece, is provided. Monte Carlo Simulation outputs of the calibrated stochastic process are compared with the equivalent results from a standard GBM model. Results validate the enhanced uncertainty measurement and diffusion forecast hypothesis.
To conclude, this paper addresses the uncertainty determination problem in the telecommunications’ market diffusion processes and the introduction of this uncertainty in diffusion forecasting. The latter allows the estimation of the idiosyncratic and/or the systematic risk inherent in the diffusion process under study. In addition, it provides a way to estimate the effect of the overall market uncertainty to the diffusion of a specific firm/technology.
The rest of the paper is organized as follows.
Section 2 provides an overview of the proposed model.
Section 3 presents the results, after its application in a telecommunication market paradigm. Finally,
Section 4 concludes.
2. Forecasting Telecommunications’ Services Diffusion under Uncertainty
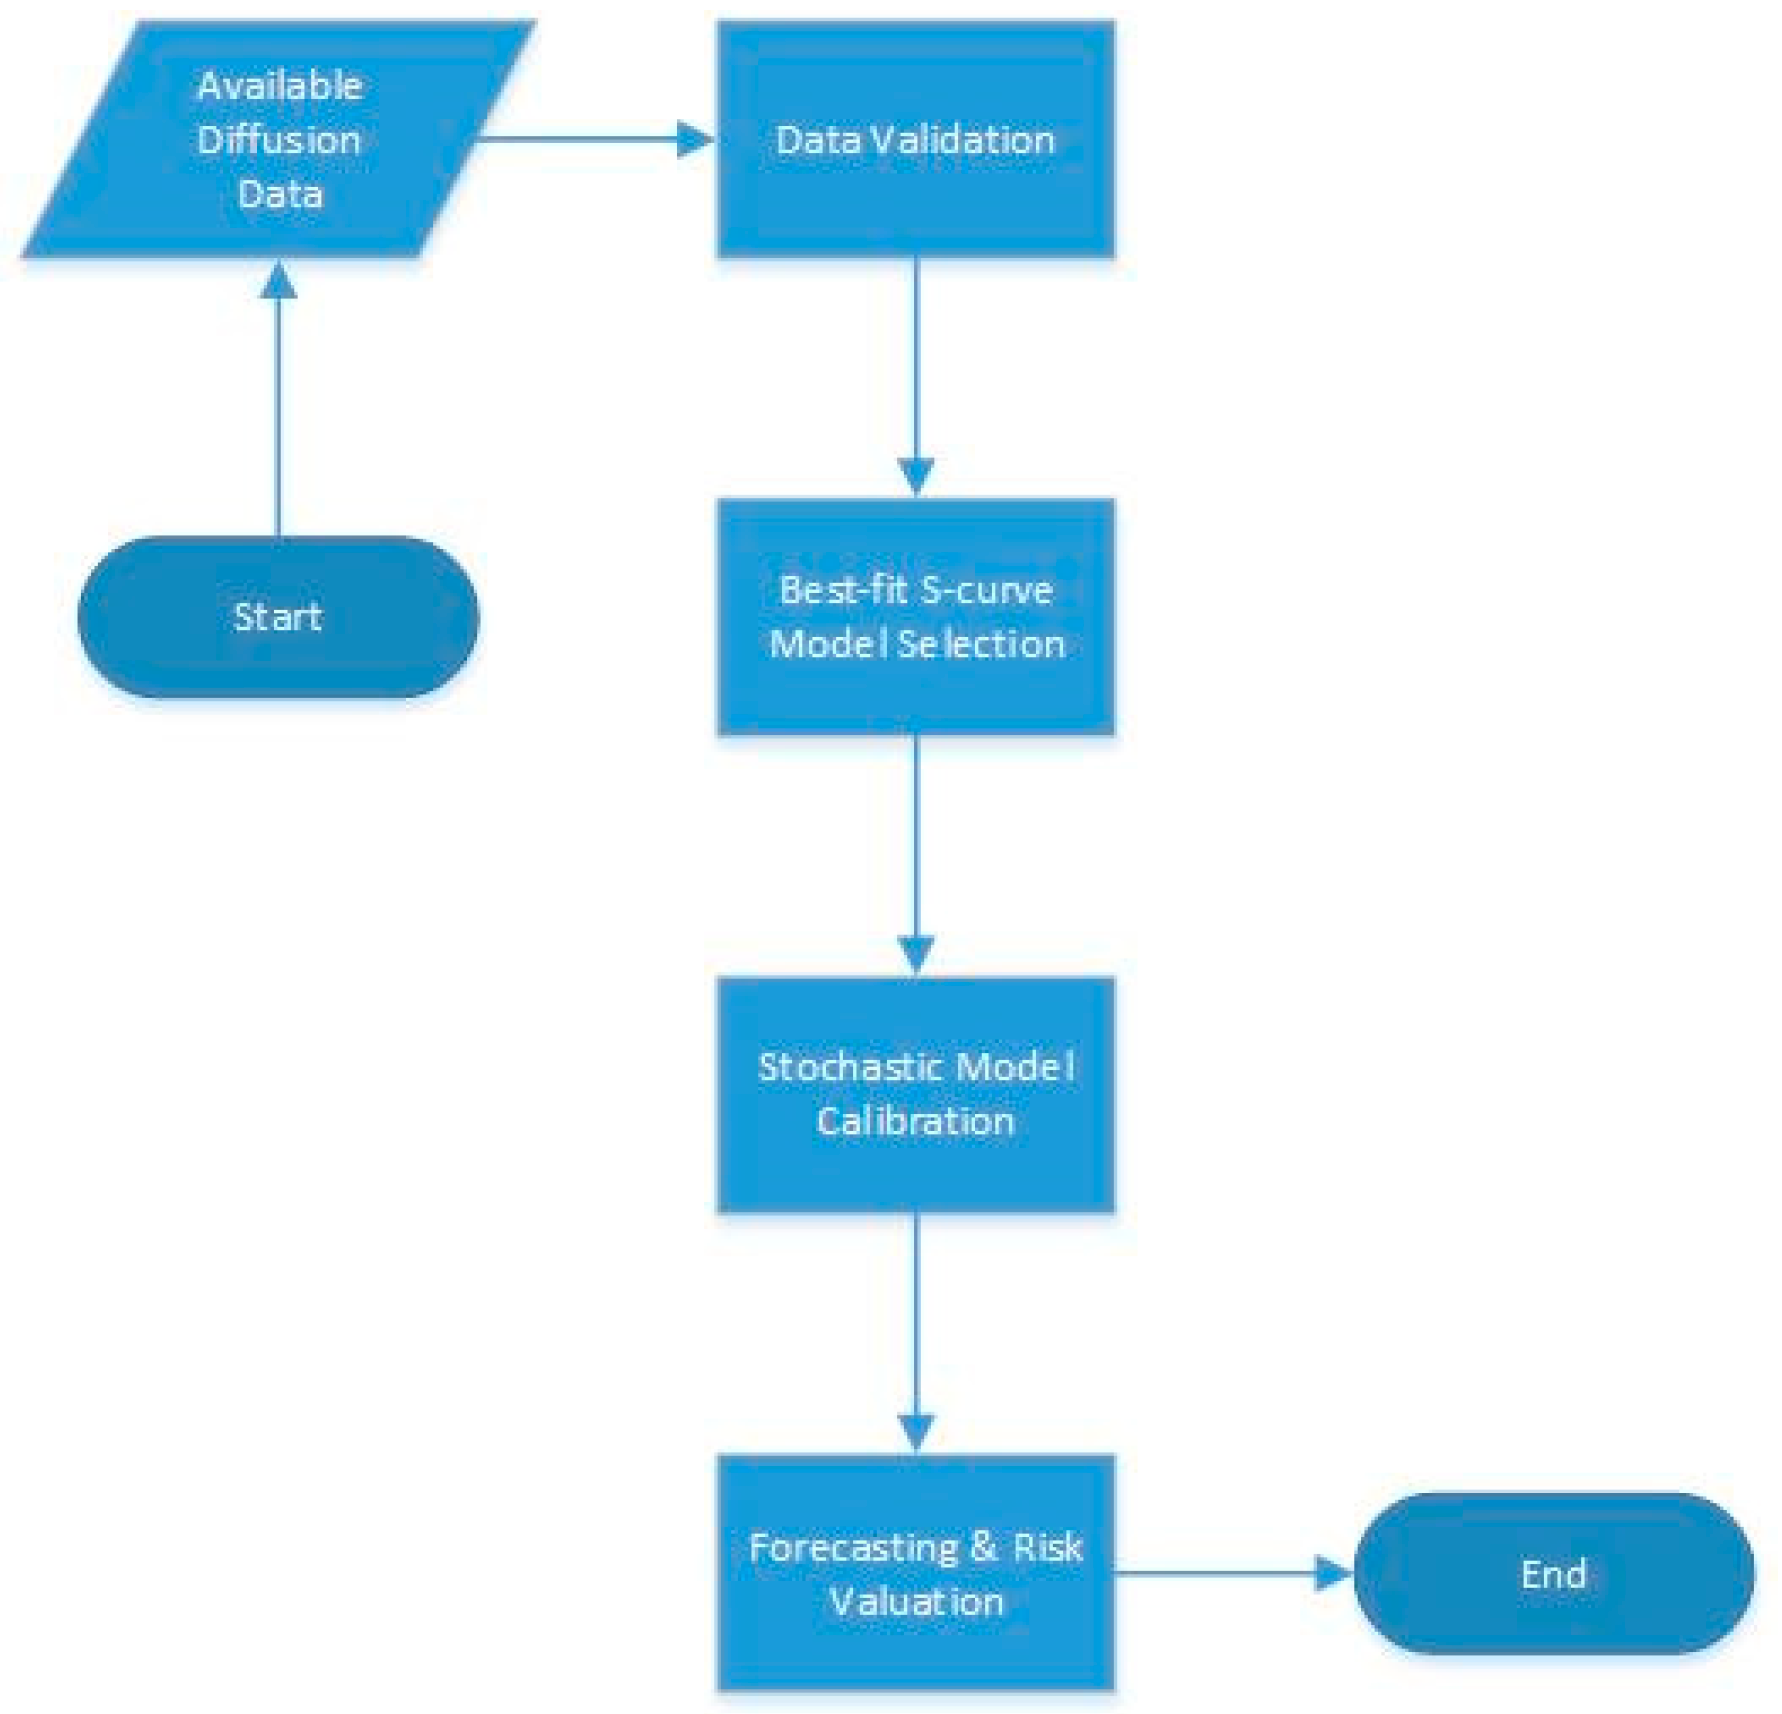
The aim of this study is to propose a statistical and simulation-based methodology for forecasting the demand of a telecommunication service in an uncertain and dynamic environment. This methodology builds upon the use of a calibrated generalized Brownian motion—Ito stochastic process. The steps taken in performing the proposed forecasting methodology are represented in
Figure 1.
As can be seen in
Figure 1, the proposed methodology follows a four-step procedure, comprising Data Gathering and Validation, the Best-fit S-curve Model Selection, the Stochastic Model Calibration and the Forecasting and Risk Valuation. Details of each step are provided below.
2.1. Data Gathering and Validation
The first step of the methodology includes the respective data collection about the telecommunication service diffusion and the validation of this data for use.
Since an Ito process is used, the proposed model is valid provided the actual diffusion log changes follow a normal distribution. Consequently, a normality test has to be deployed to determine if the data set is well-modeled by a normal distribution.
2.2. Best-Fit S-Curve Model Selection
The second step of the methodology includes the selection of the S-curve model that best describes the demand evolution of the diffusion process under study.
The S-shaped diffusion models can be derived from the differential equation represented in (1).
where
N(
t) represents the penetration estimation,
K is the saturation level and
δ is the coefficient of diffusion.
From (1), it can be seen that for a diffusion model to produce an estimation, the saturation level
K and diffusion coefficient
δ have to be determined. While the determination of the saturation level
K is most of the times a more straightforward procedure, the diffusion coefficient involves the estimation of model-specific parameters through data-fitting procedures, e.g., in the Bass model, described in (2), in which the diffusion coefficient involves the determination of parameter
p—the coefficient of innovation—and parameter
q—the coefficient of imitation.
where
m is the market potential,
p is the coefficient of innovation and
q is the coefficient of imitation.
The estimation of the parameters of the models under evaluation may be achieved through data fitting, with the use of dedicated software. It should be considered that for an S-curve model to produce valid results, a considerable amount of data is required.
Following the estimation of the required parameters, the selection of the best-fitting model is accomplished with the use of forecast accuracy measures, such as the Mean Absolute Percentage Error (MAPE) and Root Mean Square Error (RMSE). Failure to select the S-curve model that best captures the diffusion process dynamics will have a strong impact on the validity of the results of the proposed methodology.
2.3. Stochastic Model Calibration
The proposed model is based on a generalized Brownian motion—Ito stochastic process. The latter was chosen because, unlike GBM, it incorporates drift and volatility coefficients that are functions of the current state and time.
The Ito process is represented by (3):
where
dz is the increment of a Wiener process and
a(
x,
t) and
b(
x,
t) are known (nonrandom) functions serving as the drift and volatility parameters, respectively.
Equation (3) defines two terms that affect the calculated estimation. The first term defines that at each time period, the estimated value will drift up by the expected market growth rate. The second term indicates that a random value, scaled from the volatility coefficient, will be added to or subtracted from the drift value. Hence, estimations follow a series of steps, which result from the interactions of the above two terms and are independent of past estimations (a Markov process property).
When stochastic models are used for diffusion modelling, their parameters are estimated based on historical data, e.g., [
16]. In few cases, these parameters are considered variable and are calibrated based on existing data, e.g., [
15]. Under the proposed methodology, the drift coefficient of the Ito process is calibrated based on the diffusion rate provided by the best-fitting S-shaped model of Step 1, whereas the volatility coefficient is calculated after the extraction of the drift trend of the data.
2.3.1. Drift Coefficient Calibration
To incorporate the market dynamic growth into the Ito stochastic process, the drift coefficient
a(
x,
t) is set equal to the variable market growth rate provided by the best-fitting S-shaped diffusion model. For S-shaped models providing cumulative penetration estimation, like the logistic family of models, this growth rate may be calculated at any given time period
t following (4),
whereas for models providing spot penetration growth, like the Bass model, the growth rate may be calculated using (5).
Hence, the proposed Ito process, after calibration, is represented by (6):
It should be noted that in the absence of volatility (b(x,t) = 0), the results of (6) converge to the results provided by (1), the S-shaped diffusion model that was used for the forecast.
2.3.2. Volatility Coefficient Estimation
Similar to the work proposed in [
15], following the Ito process drift coefficient calibration, the volatility coefficient has to be estimated. Under the proposed methodology, volatility is defined as the standard deviation of the percentage error of the best-fitting S-shaped model for
μ(
t). In this way, the volatility coefficient
b(
x,
t) will remain constant throughout the evaluation period and depends on the residuals of the S-curve fitting process. These residuals are considered to be a direct result of the inherent uncertainty in the diffusion process under study. Therefore, the better determination of the data drift highlights the changes in data due to uncertainty, thus allowing for a better determination of diffusion uncertainty.
Moreover, based on this view of the residuals of the S-curve fitting process, when a specific technology for both the overall market and a provider are examined, the effect of the overall market uncertainty to the provider uncertainty may also be determined. This may be achieved through a standard cointegration analysis, provided that both residual data series are integrated of the same order.
2.4. Forecasting and Risk Valuation
Given the best-fitted function to the demand growth as well as the value obtained for the volatility coefficient, the targeted stochastic differential equation is made based on (7).
To generate possible demand forecasts, Monte Carlo Simulation is deployed. Outputs include the probabilistic distribution of the future demand for the telecommunication service under evaluation, at a specific time t. It is noted that even though there is no constrain for the forecast period, the larger this period, the higher the data deviations due to the underlying uncertainty.
Besides the generation of future diffusion forecasts, Monte Carlo Simulation may be used to estimate the risk inherent to the diffusion process. The calculated probabilistic distribution constitutes a risk assessment of the forecasted diffusion of the telecommunication service under study. If the diffusion process of an entire market is examined, the calculated volatility reflects the overall market uncertainty, thus enabling the estimation of the market’s systematic risk. On the contrary, if the diffusion process of a specific technology on a provider basis is examined, the calculated volatility corresponds to the overall technology uncertainty the provider experiences. This enables the estimation of the total technology risk for the provider, which includes both the systematic and the idiosyncratic technology risk.
Following the risk estimation, the results may be compared to various levels of risk tolerance. This can help telecommunication providers to adjust their strategy regarding technology selection and capacity expansion. Moreover, the derived knowledge can be used by policy makers and regulators for shaping market competition. This concludes the proposed method.
3. Insights from the Greek Mobile Telecommunications Market
To indicate the dynamics of the proposed methodology, a real-world example, based on the diffusion of the mobile market in Greece, is provided.
In its current state, the Greek mobile telecommunications market offers a subscriber the ability to choose between four competing technologies, 2–2.5G, 3G, 4G and 5G. After the introduction of VoLTE, all four technologies may be used for both telephony and data services. These services are included in either prepaid or postpaid packages and are provided by three companies, namely, CosmOTE, Vodafone and Wind, with an expected new entrant, Forthnet. The market is regulated by the National Telecommunications and Post Commission (EETT,
https://www.eett.gr (accessed on 28 May 2021)). The responsibility for drafting legislation is retained by the Greek Ministry for Transport and Communications (YME,
www.yme.gr (accessed on 28 May 2021)).
The data used in the analysis were published by EETT. These involve the number of active subscriptions per mobile telecommunications service provider from 1998, when the first mobile telecommunications networks were deployed in Greece, to 2019. These data for the incumbent operator CosmOTE and the total market are presented in
Figure 2.
It can be seen that the incumbent operator CosmOTE captures about 50% of the entire market. The other 50% is split between the other operators, namely, Vodafone and Wind.
3.1. Methodology Application
3.1.1. Data Validation
To be able to apply the proposed methodology, the annual log changes of active subscriptions must be normally distributed. The Anderson–Darling normality test was used for this purpose. Results are presented in
Figure 3.
As can be seen in
Figure 3, both the total market and the incumbent operator CosmOTE annual log changes of their active subscriptions are not normally distributed. Subsequently, they cannot be used with the proposed methodology. This is not the case though with Vodafone and Wind, whose data may be used for future demand forecasting with the proposed methodology.
3.1.2. Best-Fitting S-Curve Model Selection
For the purposes of this study, four S-curve diffusion models were evaluated: The Logistic, Fisher–Pry, Gompertz and TONIC models. Moreover, the Mean Absolute Percentage Error (MAPE) was selected as a forecast accuracy measure and calculated in each case. MAPE was calculated for all sets of data and the model for which the smallest statistical error was calculated is consequently considered to be the most appropriate to be used for forecasting future diffusion of mobile services. The results are presented in
Table 1.
Based on the data of
Table 1, the best-fitting S-curve model for Vodafone is the Fisher–Pry model, whereas for Wind, the best-fitting S-curve model is Gompertz. Parameter estimation for the best-fitting models are given in
Table 2.
3.1.3. Stochastic Model Calibration
Following the proposed methodology, the Ito process was calibrated based on the data provided by the best-fitting S-curve model. The calculated volatility coefficients are provided in
Table 3. For comparison purposes, the equivalent GBM volatility coefficients are also included in
Table 3.
It can be seen that the calibration of the Ito process provides results in the smaller volatility coefficient calculation. This is due to the better capturing of the diffusion trend, provided by the S-curve model.
3.1.4. Forecasting and Risk Valuation
To complete the analysis, Monte Carlo Simulation was deployed to forecast diffusion for a period of 6 years (up to 2025). Results were compared with the ones provided by traditional GBM forecasting.
As can be seen in
Figure 4, all possible paths provided by the calibrated Ito process are below the saturation point of the total market. On the contrary, for both operators, traditional GBM forecasting provides a significant number of paths that greatly exceed the total market saturation point. This is due to the constant drift rate and the higher volatility coefficient assumed by GBM. Consequently, application results validate the enhanced uncertainty measurement and diffusion forecast hypothesis; the proposed calibrated Ito process outperforms the traditional GBM forecasting.
Moreover, the calculated probabilistic distribution constitutes a risk assessment of the forecasted Vodafone and Wind mobile services diffusion. Therefore, it corresponds to the overall risk experienced by both providers, which includes both the systematic and the idiosyncratic risk. Results may help telecommunication operators to adjust their strategy. Furthermore, provided that the proposed methodology could be applied to total market diffusion data, the market’s systematic risk could be extracted, thus enabling the estimation of the operators’ idiosyncratic risk.
4. Conclusions
In this paper, a forecast methodology was suggested for capturing both the dynamism and stochasticity of future demand for telecommunication services. The proposed methodology is based on the calibration of a generalized Brownian motion—Ito stochastic process for use in telecommunications’ demand modelling.
Under the proposed methodology, the drift coefficient follows the variable diffusion rate provided by the best-fitting S-shaped diffusion model. Moreover, the volatility parameter is defined as the standard deviation of the percentage error. The calibrated Ito forecast model permits involving possible uncertainty in predicting future demand. The outputs of the proposed forecast model consist of a probabilistic distribution of future demand that constitutes a risk assessment of the forecasted diffusion of the telecommunication services under study.
The performance of the proposed methodology was tested against traditional GBM forecasting. A result comparison confirmed the enhanced uncertainty measurement and the capability of the proposed methodology in demand forecasting in the telecommunications sector.
The proposed methodology contributes well to developing strategic plans in dynamic and uncertain markets when a robust scenario analysis is required. In addition, it is compatible with all S-shaped diffusion models. Therefore, it can be applied over all cases of the high-technology market, where a diffusion model is commonly used for diffusion modelling and obtaining future demand forecasts.


