Proceeding Paper

A Sensitive Voltammetric Approach Employing a Bare Boron-Doped Diamond Electrode as a Sensor for the Determination of Hydroxocobalamin †

by
Lenka Janíková
*,
Renáta Šelešovská
,
Iveta Stýblová
and
Jaromíra Chýlková
Institute of Environmental and Chemical Engineering, Faculty of Chemical Technology, University of Pardubice, Studentská 573, 532 10 Pardubice, Czech Republic
*
Author to whom correspondence should be addressed.
Presented at the 2nd International Electronic Conference on Chemical Sensors and Analytical Chemistry, 16–30 September 2023; Available online: https://csac2023.sciforum.net/.
Eng. Proc. 2023, 48(1), 7; https://doi.org/10.3390/CSAC2023-14894
Published: 25 September 2023

Abstract

:
The voltammetric behavior of hydroxocobalamin (OH-CBL) was firstly studied by employing a bare boron-doped diamond electrode as a working electrode. It was found that OH-CBL provided four anodic signals on BDDE in acidic supporting electrolytes and one cathodic signal. The anodic peak situated at +412 mV (vs. Ag|AgCl|KCl (sat.) recorded in 0.1 mol/L H2SO4) was found to be suitable for analytical purposes due to its position and shape. A novel voltammetric approach based on differential pulse voltammetry was developed and it was found as a sensitive analytical tool, with low limit of detection (LD = 13.2 nmol/L), applicable in analysis of vitamin preparations.

1. Introduction

Hydroxocobalamin (OH-CBL) is one of the natural forms of water-soluble vitamin B12. It can also be synthetized and employed as an efficient anti-anemic tool with a more prolonged effect than commonly used synthetic derivative cyanocobalamin (CN-CBL). Moreover, OH-CBL is employed as a very efficient and non-toxic antidote in case of cyanide poisoning [1,2].
Some studies were interested in cobalamins’ electrochemistry, particularly on mercury electrodes, e.g., [3,4], or concerning a voltammetric behavior and determination of CN-CBL, e.g., [5,6]. Also, two papers dealt with a voltammetric determination of CN-CBL on a boron-doped diamond electrode (BDDE) [7,8], which was utilized as a sensor in the present work as well. The possibilities for voltammetric determination of other forms of cobalamins was poorly studied. Our research group focused on the voltammetric behavior of OH-CBL previously, and proposed a sensitive voltammetric method based on its reduction on silver solid amalgam working electrodes [9]. The aim of the present work was to expand the range of known information about electrochemical behavior of cobalamins, specifically OH-CBL, and to propose a simple voltammetric approach for its determination. BDDE was chosen as a working electrode due to its unique electrochemical properties, like a wide potential window, stability, and a low and stable background [10].

2. Experiment

2.1. Chemicals

Solutions of the required concentration of the analyte were freshly prepared daily from 0.1 mol/L solution OH-CBL, which was retrieved dissolving of a solid chemical (purity ≥ 96%, originated from Sigma Aldrich, Prague, Czech Republic) in deionized water. Various supporting electrolytes were used during the first set of experiments, which consisted of determining the effect of the supporting electrolyte’s pH on the analyte’s electrochemical behavior. Specifically, the following solutions were employed: Britton–Robinson buffer (BRB) of pH 2–12, borate buffer (BB) of pH 10, ammonium buffer (AB) of pH 9 or nitric (0.1 mol/L), and sulfuric acid (0.1 and 0.5 mol/L, respectively). BRB was prepared by mixing of the acidic component (consisting of 0.04 mol/L solution of H3PO4, H3BO3, and CH3COOH) and the alkaline component (0.2 mol/L solution of NaOH). The solutions were prepared by diluting stock solutions of concentrated acids (85% H3PO4 and 99% CH3COOH) or by dissolving a particular amount of a solid chemical (NaOH, H3BO3). BB consisted of a mixture of 0.05 mol/L Na2B4O7·10H2O and 0.1 mol/L NaOH. The solutions were prepared by dissolving a particular amount of solid chemicals in deionized water. AB was a mixture of NH3 and NH4Cl. The solutions were again prepared by dissolving a particular amount of solid chemical (NH4Cl) or diluting the stock solution (NH3). Used solutions of inorganic acids were prepared by diluting a particular stock solution of concentrated acids (65% HNO3 and 96% H2SO4, respectively). All of the above-mentioned chemicals were of p.a. purity and originated from Penta-Švec, Prague, Czech Republic.

2.2. Instrumentation

Eco-Tribo Polarograph PC ETP (EcoTrend Plus s.r.o., Prague, Czech Republic) combined with software Polar 5.1 was employed for all of the voltammetric experiments. The three-electrode set-up consisted of BDDE with a working surface of 7.07 mm2 (Windsor Scientific Ltd., Slough, United Kingdom) as a working electrode, a saturated Ag|AgCl|KCl electrode as a reference, and platinum wire as a counter electrode (both electrodes from Monokrystaly s.r.o., Turnov, Czech Republic). A pH meter, the Fisher Scientific Accumet AB 150 (Fisher Scientific s.r.o., Pardubice, Czech Republic), was used for the preparation of the buffers. The analytical balances KERN ALS 120-4N (Kern & Sohn GmbH, Balingen, Germany) were used for weighing solid chemicals. An ultrasonic bath, Bandelin Sonorex (BANDELIN electronic GmbH & Co. KG, Berlin, Germany), was applied in the preparation of samples improving their dissolution.

2.3. Procedures

2.3.1. Voltammetric Measurements

Cyclic voltammetry (CV) was employed for two sets of experiments: a study of the influence of supporting electrolyte’s pH on the OH-CBL voltammetric behavior (pH study) and an examination of the influence of the scan rate on the OH-CBL current response (scan rate study), respectively. The pH study was realized with a constant scan rate (v = 100 mV/s), but the initial (Ein), final (Efin), and switching (Eswitch) potential varied due to changes in the used supporting electrolyte, particularly its pH value. The scan rate study was realized under the following conditions: 0.1 mol/L H2SO4 as a supporting electrolyte, Ein = Efin = −1200 mV, Eswitch = +2200 mV, and v = 10–500 mV/s.
Differential pulse voltammetry (DPV) was chosen as a sensitive tool for the determination of the analyte and, thus, its parameters were optimized. The obtained values are summarized in Table 1 for both of the investigated electrochemical processes.

2.3.2. Preparation of Real Samples for Analysis

Two vitamin preparations containing OH-CBL were analyzed. “Vitamin B12 (hydroxocobalamin)” was in a liquid form, and the content of OH-CBL was declared by the producer Metabolics Ltd. (Eastcott, United Kingdom) as 98 μg of OH-CBL per 1 drop (calculated as 0.983 × 10⁻³ mol/L). This sample was analyzed only after simple dilution. Preparation “Vitamin B12 as hydroxocobalamin 1 mg—sub-lingual” was produced by Cytoplan Ltd. (Worchester, United Kingdom). Ten tablets of the preparation were ground in a grinding mortar, and the powder was quantitatively transferred into a 100 mL volumetric flask. It was sonicated for 25 min, and the undissolved residue was removed by filtration through a folded paper filter. Finally, the flask was filled up to the mark, and the obtained solution of the calculated concentration of 7.43 × 10⁻⁵ mol/L was analyzed. The content of OH-CBL was determined in both cases by a standard addition method when at least two additions were added. The analysis was 5times repeated and particular statistical parameters were calculated.

3. Results and Discussion

3.1. Influence of pH of Supporting Electrolyte on Voltammetric Behaviour of OH-CBL

The choice of a supporting electrolyte plays a crucial role in the optimization process of the voltammetric approaches. The nature of the ongoing electrochemical processes is often strongly dependent on the features of the used electrolyte. Thus, the effect of various buffers (BRB (pH 2–12), BB (pH 10), AB (pH 9)), and two acids of various concentrations (0.1 mol/L HNO3, 0.1 mol/L H2SO4, and 0.5 mol/L H2SO4) was examined employing CV. Four anodic signals (labeled from the most negative as “1” to the most positive as “4”, Figure 1A) were recorded in media of pH ≤ 3. A decreasing number of anodic signals was recorded with an increasing pH value, and only one signal (peak 3, Figure 1B) could be detected in electrolytes of pH 8–11. Moreover, one reduction signal (RED) could be measured in the whole tested pH range. It was obvious that signals 2–4 recorded in acidic media were ill-developed, and their proper evaluation was very difficult. This was caused by the presence of the other responses, and by the onset of the decomposition of a supporting electrolyte. On the other hand, the shape of signal 1 (Figure 1C) was not influenced by the presence of any other responses, nor by the decomposition of the supporting electrolyte solution. It was well-developed and easily evaluable. Its highest response was recorded in 0.1 mol/L H2SO4, which was used for all further experiments as a supporting electrolyte.

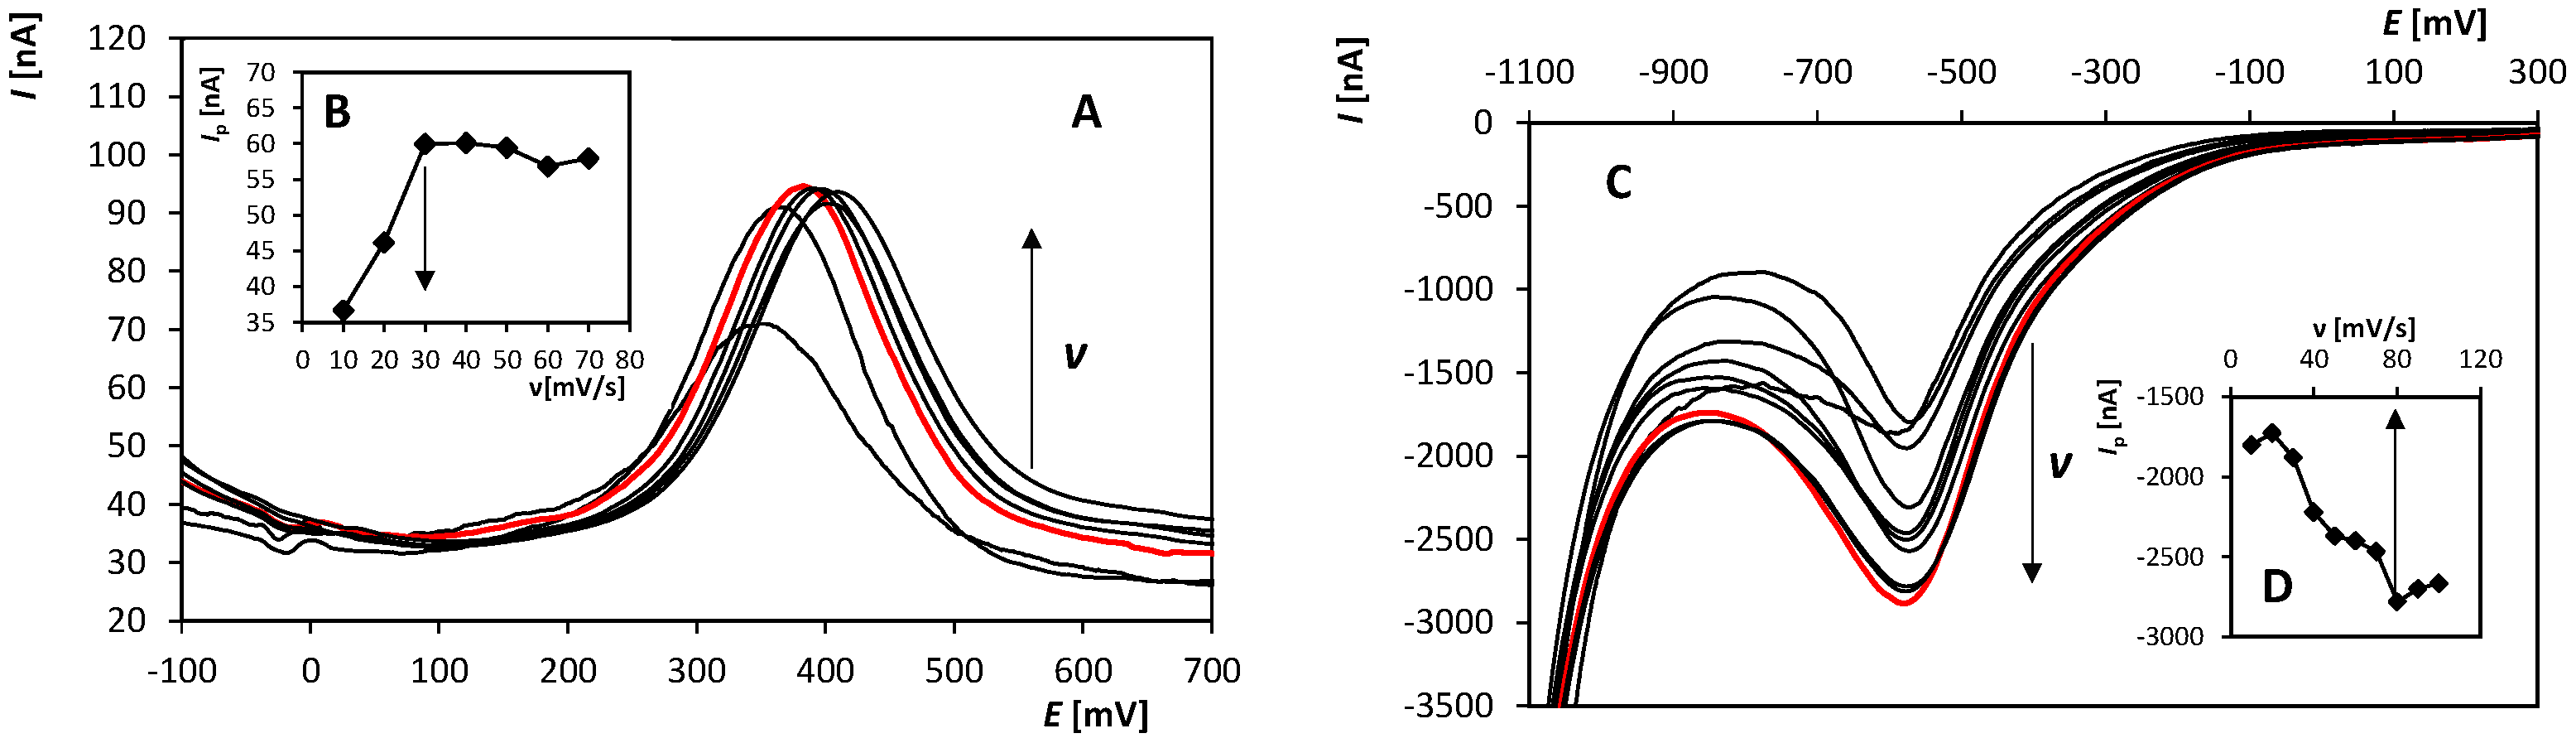
3.2. Influence of Scan Rate

The effect of scan rate was examined employing 5 × 10⁻⁵ mol/L OH-CBL in a range of v from 10 to 500 mV/s. The current response 1, and RED as well, grew with an increase in the following parameter, but the growth was non-linear. Conversely, a linear course of the dependence was obtained between the peak height (Ip) and the square root of the scan rate (v1/2). This dependence could be described by Equation (1) for anodic signal 1 and (2) for the cathodic response RED. A diffusion-controlled electrode reaction could be assumed for both of the following responses. This result was partially confirmed by logarithmic analysis, and obtained linear dependencies (log(Ip)–log(v)) could be described by Equation (3) for anodic signal 1 and (4) for the cathodic response, respectively. The value of the slope of Equation (4) is close to the theoretical one of 0.5, which is typical for diffusion-controlled reactions. This type of ongoing electrode reaction is characteristic of the working surfaces of boron-doped diamonds. On the other hand, the value of the slope of Equation (3) is lower than 0.5. Thus, it could be assumed that the anodic process 1 is more complicated, and it was influenced by diffusion and kinetics of the electrode reaction as well.
Ip [nA] = (9.085 ± 0.280) (v [mV/s])1/2 + (29.182 ± 3.299), R2 = 0.9929
Ip [nA] = (−754.856 ± 6.679) (v [mV/s])1/2 + (−471.011 ± 91.377), R2 = 0.9991
log (Ip [nA]) = (0.384 ± 0.012) log (v [mV/s]) + (1.316 ± 0.024), R2 = 0.9932
log (Ip [nA]) = (0.453 ± 0.008) log (v [mV/s]) + (3.004 ± 0.016), R2 = 0.9991

3.3. Optimization of Differential Pulse Voltammetric Parameters and Analysis of Model Samples

Pretreatment of the working surface of BDDE is often applied to increase the sensitivity or repeatability of analyses. Anodic (30 s at +2000 mV) and cathodic (30 s at −2000 mV) pretreatment procedures were tested for anodic signal 1. Worse repeatability and a signal decrease were recorded under the stated pretreatment procedures. Thus, any of the pretreatments of the working surface were not employed, and good stability and reproducibility of the signal was confirmed by repeated measurements with excellent results. The relative standard deviation of 11 repeated measurements (RSDM(11)) equaled 1.26%. Different results were obtained in the case of the cathodic response. The omission of the pretreatment step, as in the previous case, led to a substantial decrease in the peak height. Therefore, the anodic and cathodic pretreatments were tested. In the case of the anodic procedure, a substantial decrease in the cathodic response, as in the case of no pretreatment, was recorded. Inserting the cathodic potential before every scan caused a rapid signal drop (about 50%), and the stability of the response was also very poor. Therefore, a combination of anodic and cathodic pretreatment (20 “potential jumps” between +2000 mV and −1500 mV) was examined as the last option. A stable and well-developed reduction signal was recorded, which could be confirmed by repeated measurements and the obtained statistical parameter RSDM(11) = 1.45%.
The next steps were to find optimal values of the following parameters of DPV: Ein, v, and height and width of a pulse. For the whole optimization process, 2.5 × 10⁻⁶ (peak 1) and 1 × 10⁻⁵ mol/L (peak RED), respectively, OH-CBL was used. An example of the obtained voltammetric curves recorded on BDDE at various scan rates could be found in Figure 2. The obtained optimal values of particular parameters are summarized in Table 1.
The applicability of the proposed DPV method was first tested on model solutions containing known amounts of OH-CBL. First, the concentration dependence for the two monitored peaks under the selected analysis conditions was recorded. For the monitored signals, the concentration range was repeatedly measured as over at least 1 concentration order from the lowest concentration value at which the signal could be reliably evaluated to a concentration at which a noticeable increase in the monitored peak was observed. In the case of the anodic peak, this was a range from 2 × 10⁻⁸ to 1 × 10⁻⁶ mol/L, and in the case of the RED peak, a range from 2 × 10⁻⁷ to 6.5 × 10⁻⁶ mol/L was measured. The dependence of Ip on OH-CBL concentration was linear for the oxidation peak over almost the entire studied range (particularly from 2.00 × 10⁻⁸ to 8.25 × 10⁻⁷ mol/L), which represents the linear dynamic range (LDR) and is described by Equation (5). Using the values of the slope and standard deviation intercept of this dependence, the values of a limit of detection and quantification as well were calculated and are as follows LD = 1.32 × 10⁻⁸ mol/L and LQ = 4.39 × 10⁻⁸ mol/L. In the case of the reduction peak, the obtained dependence of Ip on OH-CBL concentration did not show a linear character, but a polynomial one. Characterization of the dependence in the concentration range from 1.99 × 10⁻⁷ to 2.91 × 10⁻⁶ mol/L results in Equation (6). Based on these results, the anodic signal 1 was chosen for further examination. Repeated analyte determinations were carried out for two model samples with known concentrations of OH-CBL. The obtained results are summarized in Table 2. It is obvious that obtained results are correct and precious.
Ip [nA] = (15.09 ± 0.1480) (c [μmol/L]) + (0.142 ± 0.066), R2 = 0.9982
I p   [ nA ] = ( 193.56 ± 21.49 )   ( c   [ μ mol / L ] ) 2 ( 1447.1 ± 68.3 )   ( c   [ μ mol / L ] ) + ( 94.86 ± 44.86 ) , R 2 = 0.9966

3.4. Analysis of Real Samples

The applicability of the proposed method employing the anodic peak 1 was finally verified by an analysis of vitamin preparation containing OH-CBL. Preparation for analysis is described in Section 2.3.2. A standard addition method, when at least two standard addition were added, was utilized. The obtained results are summarized in Table 3. In the case of liquid preparation, the determined amount is in good agreement with the declared amount of the vitamin. On the other hand, slightly higher amounts (from 2.6 to 9.8%) of OH-CBL than declared by the producer were determined in the second analyzed product. The result could be caused by higher content than declared, which should be verified by different analytical techniques in future work, or by the complicated matrix of the sample.

4. Conclusions

The voltammetric behavior of hydroxocobalamin, a member of vitamin B12 group, was investigated utilizing boron-doped diamond as a sensor. It was proved that the proposed voltammetric approach based on differential pulse voltammetry represented a rapid and effective tool for monitoring this analyte in vitamin preparation.

Author Contributions

Conceptualization, L.J.; methodology, L.J. and R.Š.; investigation, I.S. and L.J.; resources, I.S. and L.J.; data curation, I.S. and L.J.; writing—original draft preparation, L.J.; writing—review and editing, R.Š., J.C. and I.S.; visualization, L.J.; supervision, L.J.; project administration, R.Š. All authors have read and agreed to the published version of the manuscript.

Funding

This research was funded by The University of Pardubice project number SGSChT_2023_002.

Institutional Review Board Statement

Not applicable.

Informed Consent Statement

Not applicable.

Data Availability Statement

Data are available on request from the corresponding author.

Conflicts of Interest

The authors declare no conflict of interest.

References

  1. Ramezanpour, A.E.; Annamaraju, P. Hydroxocobalamin. In StatPearls; StatPearls Publishing: Treasure Island, FL, USA, 2023. [Google Scholar]
  2. Hall, C.A.; Begley, J.A.; Green-Colligan, P.D. The availability of therapeutic hydroxocobalamin to cells. Blood 1984, 63, 335–341. [Google Scholar] [CrossRef]
  3. Jaselskis, B.; Diehl, H. The polarography of vitamins B12r and B12a. J. Am. Chem. Soc. 1954, 76, 4345–4348. [Google Scholar] [CrossRef]
  4. Lexa, D.; Saveant, J.M. The electrochemistry of vitamin B12. Acc. Chem. Res. 1983, 16, 235–243. [Google Scholar] [CrossRef]
  5. Pala, B.B.; Vural, T.; Kuralay, F.; Cirak, T.; Bolat, G.; Abaci, S.; Baki, D.E. Disposable pencil graphite electrode modified with peptide nanotubes for vitamin B12 analysis. Appl. Surf. Sci. 2014, 303, 37–45. [Google Scholar] [CrossRef]
  6. Parvin, M.H.; Azizi, E.; Arjomandi, J.; Yong, L.J. Highly sensitive and selective electrochemical sensor for detection of vitamin B12 using an Au/PPy/FMNPs@ TD-modified electrode. Sens. Actuat B-Chem. 2018, 261, 335–344. [Google Scholar] [CrossRef]
  7. Stanković, D.M.; Kuzmanović, D.; Manojlović, D.; Kalcher, K.; Roglić, G. Electroanalytical approach for vitamin B12 quantification based on its oxidation at boron doped diamond electrode. J. Electrochem. Soc. 2016, 163, B348–B351. [Google Scholar] [CrossRef]
  8. Pereira, D.F.; Santana, E.R.; Piovesan, J.V.; Spinelli, A. A novel electrochemical strategy for determination of vitamin B12 by Co (I/II) redox pair monitoring with boron-doped diamond electrode. Diam. Relat. Mater. 2020, 105, 107793. [Google Scholar] [CrossRef]
  9. Bandžuchová, L.; Šelešovská, R.; Navrátil, T.; Chýlková, J. Silver solid amalgam electrode as a tool for monitoring the electrochemical reduction of hydroxocobalamin. Electroanal 2013, 25, 213–222. [Google Scholar] [CrossRef]
  10. Kraft, A. Doped Diamond: A Compact Review on a New, Versatile Electrode Material. Int. J. Electrochem. Sci. 2007, 2, 355–385. [Google Scholar] [CrossRef]
Figure 1. Cyclic voltammograms recorded on BDDE in the absence (dotted line) and presence (solid line) of 5 × 10⁻⁵ mol/L OH-CBL in acidic (A) and alkaline (B) supporting electrolytes. (C) Detail of the area of signal 1 in an acidic medium. Parameters: supporting electrolyte: 0.1 mol/L H2SO4 (A,C) and BRB (pH 10) (B), Ein = Efin = −1000 mV (A,C) and −1500 mV (B), Eswicth = +2200 mV (A) and +1800 mV (B), v = 100 mV/s (AC).
Engproc 48 00007 g001
Figure 2. Anodic (A) and cathodic (C), respectively, DP voltammograms recorded on BDDE in the presence of OH-CBL at various scan rates. (B,D) Dependence of the peak height (peak 1 (B) and RED (D), respectively) on the scan rate. Parameters: supporting electrolyte: 0.1 mol/L H2SO4 (AD), pretreatment (20 “potential jumps” between +2000 mV and −1500 mV) (C,D), Ein = −400 mV (A,B) and +2000 mV (C,D), Efin = +2300 mV (A,B) and −1500 mV (C,D), v = 10–70 mV/s (A,B) and 10–100 mV/s (C,D), pulse height of 50 mV (A,B) and −65 mV (C,D), pulse width of 80 ms (A,B) and 20 ms (C,D).
Engproc 48 00007 g002
Table 1. Chosen parameters of DPV for voltammetric determination of OH-CBL on BDDE.
Ein
[mV]
Efin
[mV]
ν
[mV/s]
Pulse Height
[mV]
Pulse Width
[ms]
oxidation−400+2300306520
reduction+2000−150080−6540
Table 2. Results of repeated determination of model samples.
Added c
[mol/L]
Determined c
[mol/L]
RSD5
[%]
Recovery
[%]
5.000 × 10⁻⁸(5.026 ± 0.044) × 10−81.3399.64–101.4
1.000 × 10⁻⁷(1.015 ± 0.015) × 10−72.21100.0–103.0
Table 3. Results of repeated determination of real samples.
Declared c
[μg/1 drop]
Determined c [μg/1 drop]RSD5
[%]
Recovery
[%]
Liquid preparation98.00101.95 ± 4.096.0599.9–108.2
Declared c
[μg/1 tablet]
Determined c [μg/1 tablet]RSD5
[%]
Recovery
[%]
Tablets10001062.29 ± 36.005.13102.6–109.8
Disclaimer/Publisher’s Note: The statements, opinions and data contained in all publications are solely those of the individual author(s) and contributor(s) and not of MDPI and/or the editor(s). MDPI and/or the editor(s) disclaim responsibility for any injury to people or property resulting from any ideas, methods, instructions or products referred to in the content.

